4028
Investigation of bioenergetic adaptations under galactose stress in OXPHOS deficient fibroblasts using a combined metabolic Flux and HR-MAS NMR approach1Departments for BioMedical Research and Radiology University of Bern, Bern, Switzerland, 2Institute of Clinical Chemistry, University Hospital Bern, Bern, Switzerland
Synopsis
Defects in the mitochondrial OXPHOS lead to an extremely heterogeneous group of disorders and common
laboratory screening methods are prone to misinterpretations. In this study we report metabolic adaptation of OXPHOS deficient human skin
fibroblasts during galactose stress condition. We report a rapid HR-MAS NMR based method for
the relative quantification of untargeted metabolome profiling providing
containment of over 40 metabolites, which allowed us to observe unique cellular metabolic profiles in OXPHOS deficient
fibroblast.
Synopsis
Defects in mitochondrial oxidative phosphorylation lead to heterogeneous disorders and common laboratory methods do not allow unambiguous diagnosis. In this study we report metabolic adaptation of mitochondrial pyruvate dehydrogenase and complex 1 deficient human skin fibroblasts under glucose based cell culture condition and galactose stress condition. We tested metabolic profiling using High Resolution Magic Angle Spinning NMR as a diagnostic tool and identified potential biomarkers. We report a rapid HR-MAS NMR based method for the relative quantification of untargeted metabolome profiling providing containment of over 40 metabolites, which allowed us to observe unique cellular metabolic profiles in OXPHOS deficient fibroblast.Introduction
Defects in the mitochondrial oxidative phosphorylation (OXPHOS) lead to an extremely heterogeneous group of disorders. Laboratory screening methods are prone to misinterpretations and do not allow for unambiguous diagnosis. New diagnostic methods are therefore needed.
In this study we investigate metabolic adaptation of OXPHOS deficient human skin fibroblasts (FB) during galactose stress condition by combined High-Resolution Magic Angle Spinning (HR-MAS) NMR and metabolic flux analysis. Furthermore, we test metabolic profiling using HR-MAS NMR as a diagnostic tool for mitochondrial diseases.
Methods
Cell culturing: We used human skin fibroblasts (FB) from five controls, two patients with complex 1 deficiency (C1, namely ND6 and NDUFAF2), and from two patients with pyruvate dehydrogenase deficiency (PDH, namely 1Eα defects). Cells were grown for 18h under standard culture condition (Dulbecco's Modified Eagle Medium with 5.5 mM glucose, 10% dialyzed FCS, 2 mM L-glutamine, 1 mM sodium pyruvate, 50μM uridine) or were exposed to galactose based stress medium (10mM Galactose).
NMR Spectroscopy: Sample preparation for 1H-HR-MAS NMR was performed as described previously(1). Each sample was lysed after collection and additionally heated (70°C). On average 2.2 Million cells in D2O-based PBS were inserted in 4mm rotors using a 50µl insert. HR-MAS NMR experiments were performed on a 500 MHz Bruker Avance II spectrometer operating at 285K and 3kHz spinning. A PROJECT(2) pulse sequence with water presaturation was used for acquiring 1H-NMR spectra with a TE of 211ms. 768 transients were acquired. Spectral processing was performed using TopspinTM software, including line-broadening, FFT, phasing and baseline-correction. Chemometrics and individual peak analysis was performed with MatLab, PLS_Toolbox (Eigenvector Research,Inc.), using PQN-normalized individually sized buckets.
Metabolic flux analysis: We investigated metabolic flux in unbuffered culture medium using a Seahorse XF24 cell Analyzer. The oxygen consumption rate (OCR), an assessment of aerobic mitochondrial function, and extracellular acidification rate (ECAR), a detection of extracellular acid production, were measured simultaneously.
Results
Chemometric analysis of NMR spectra
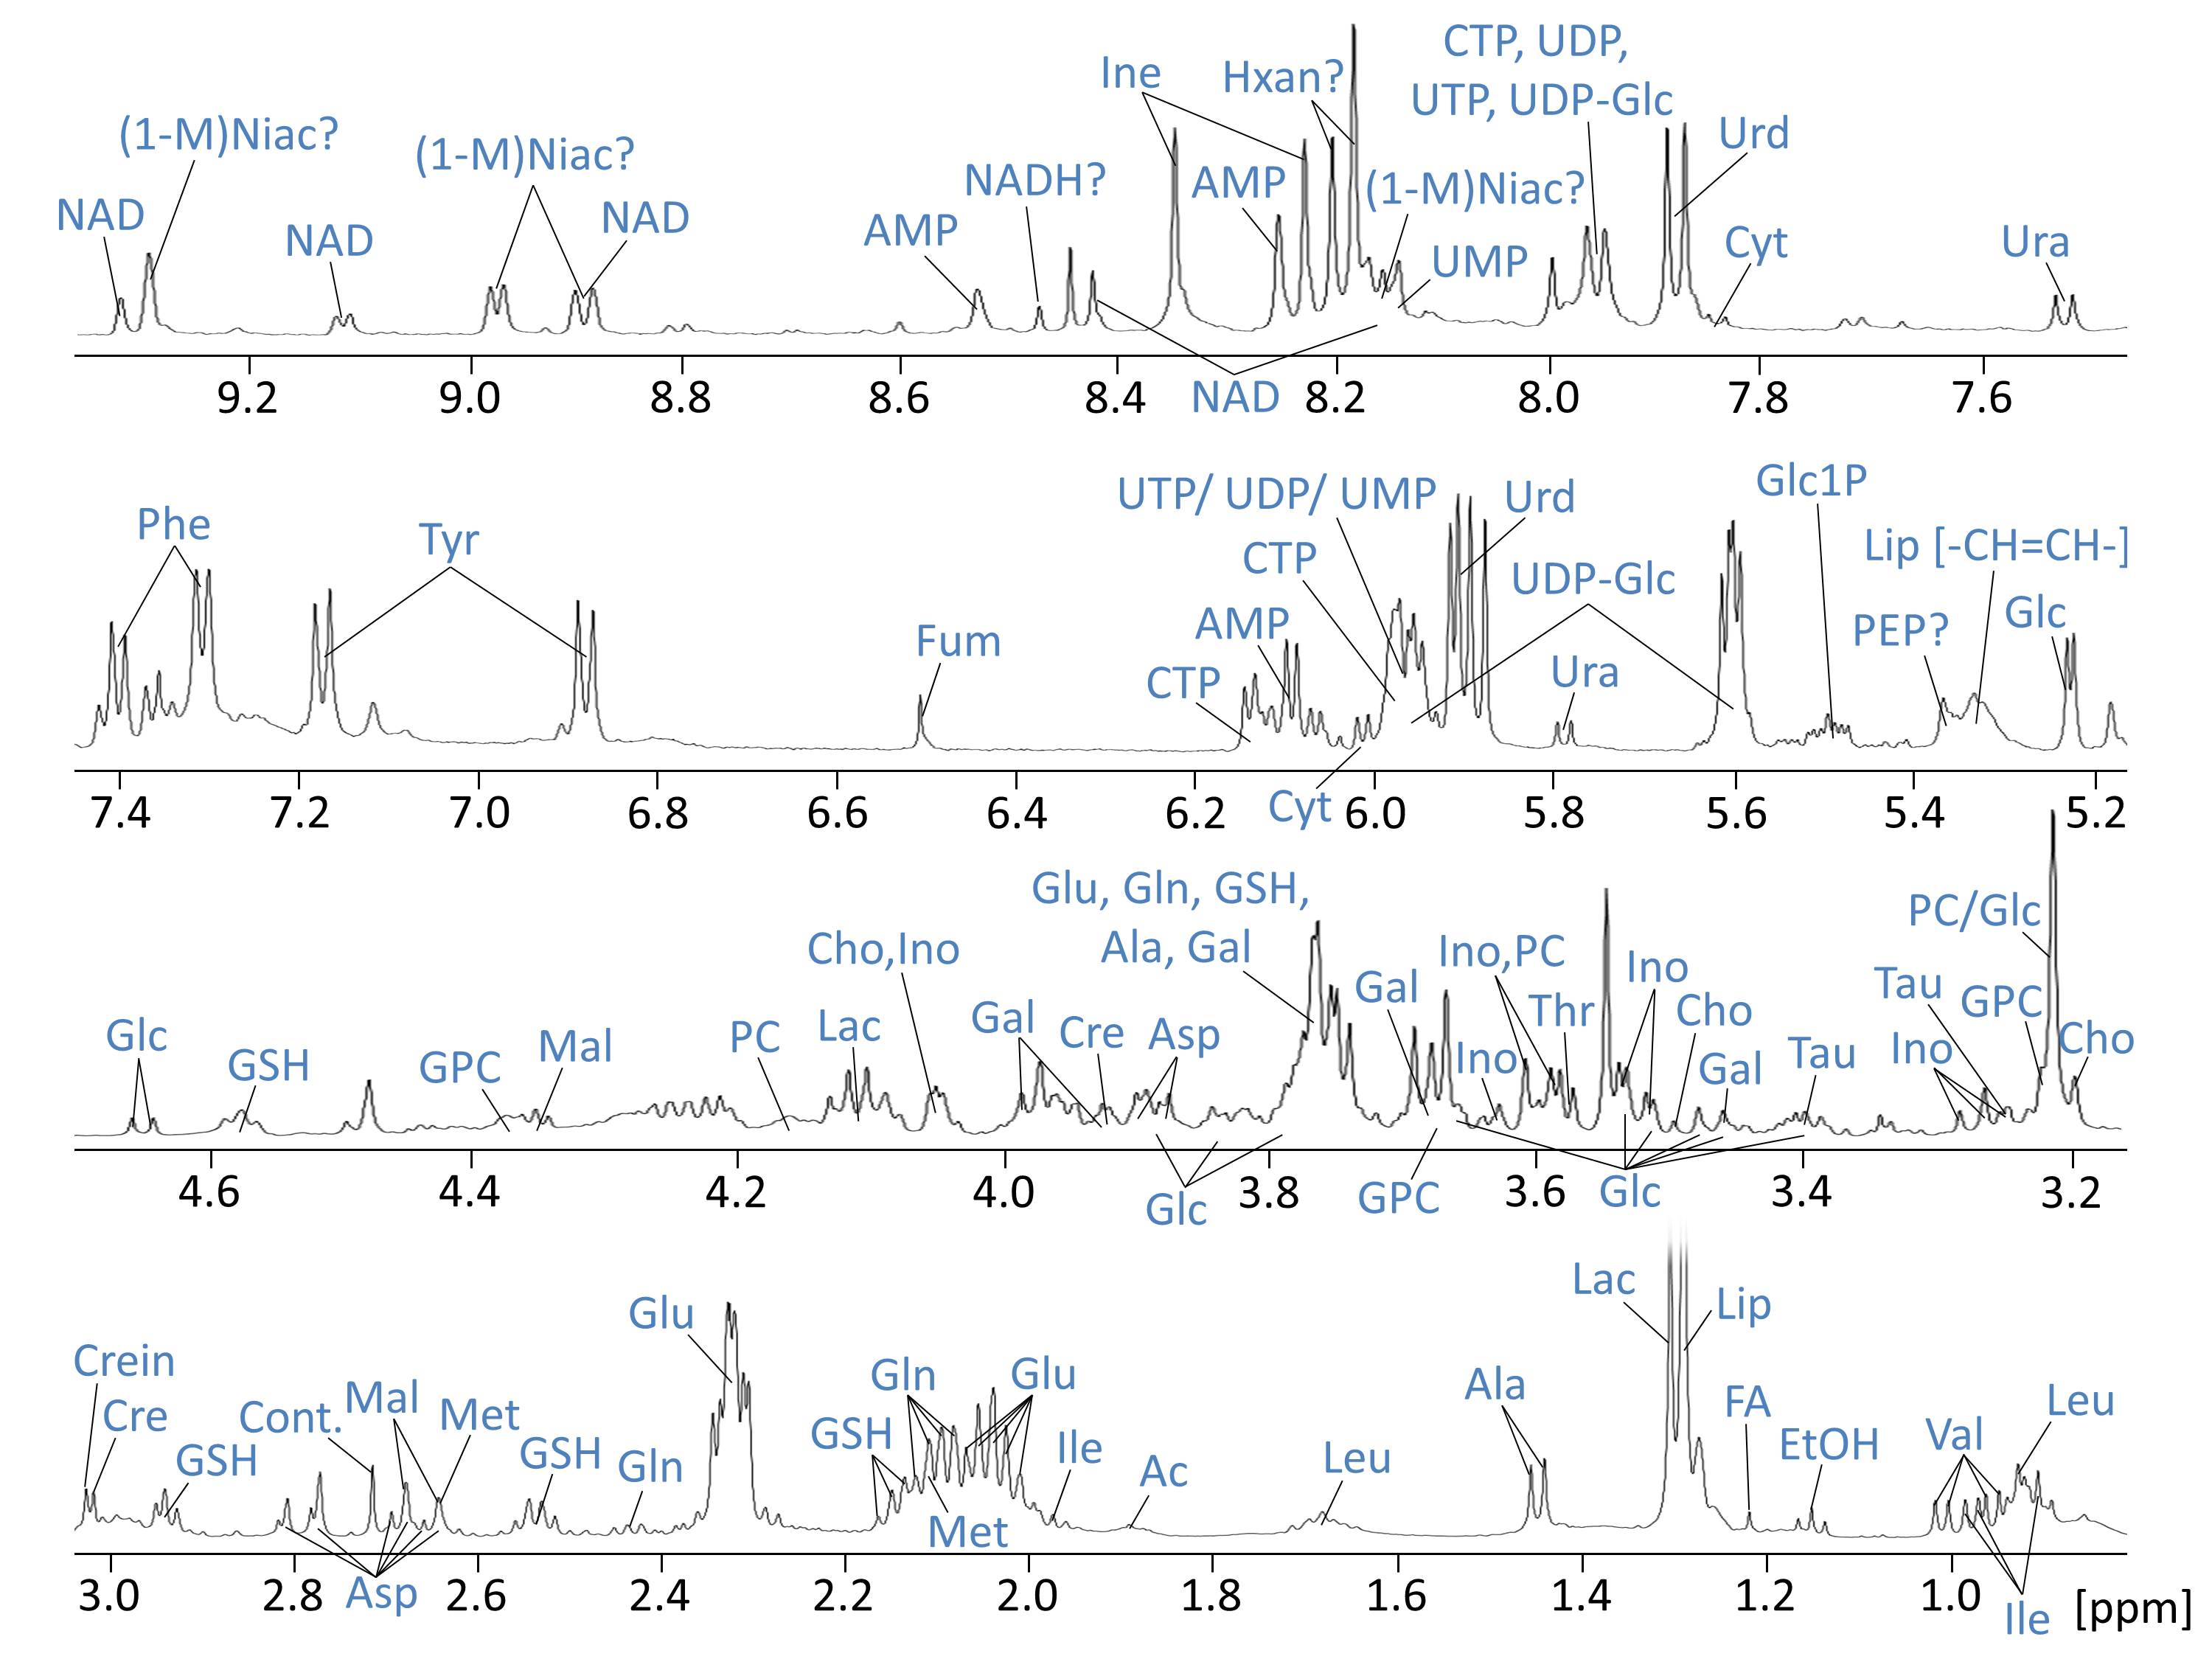
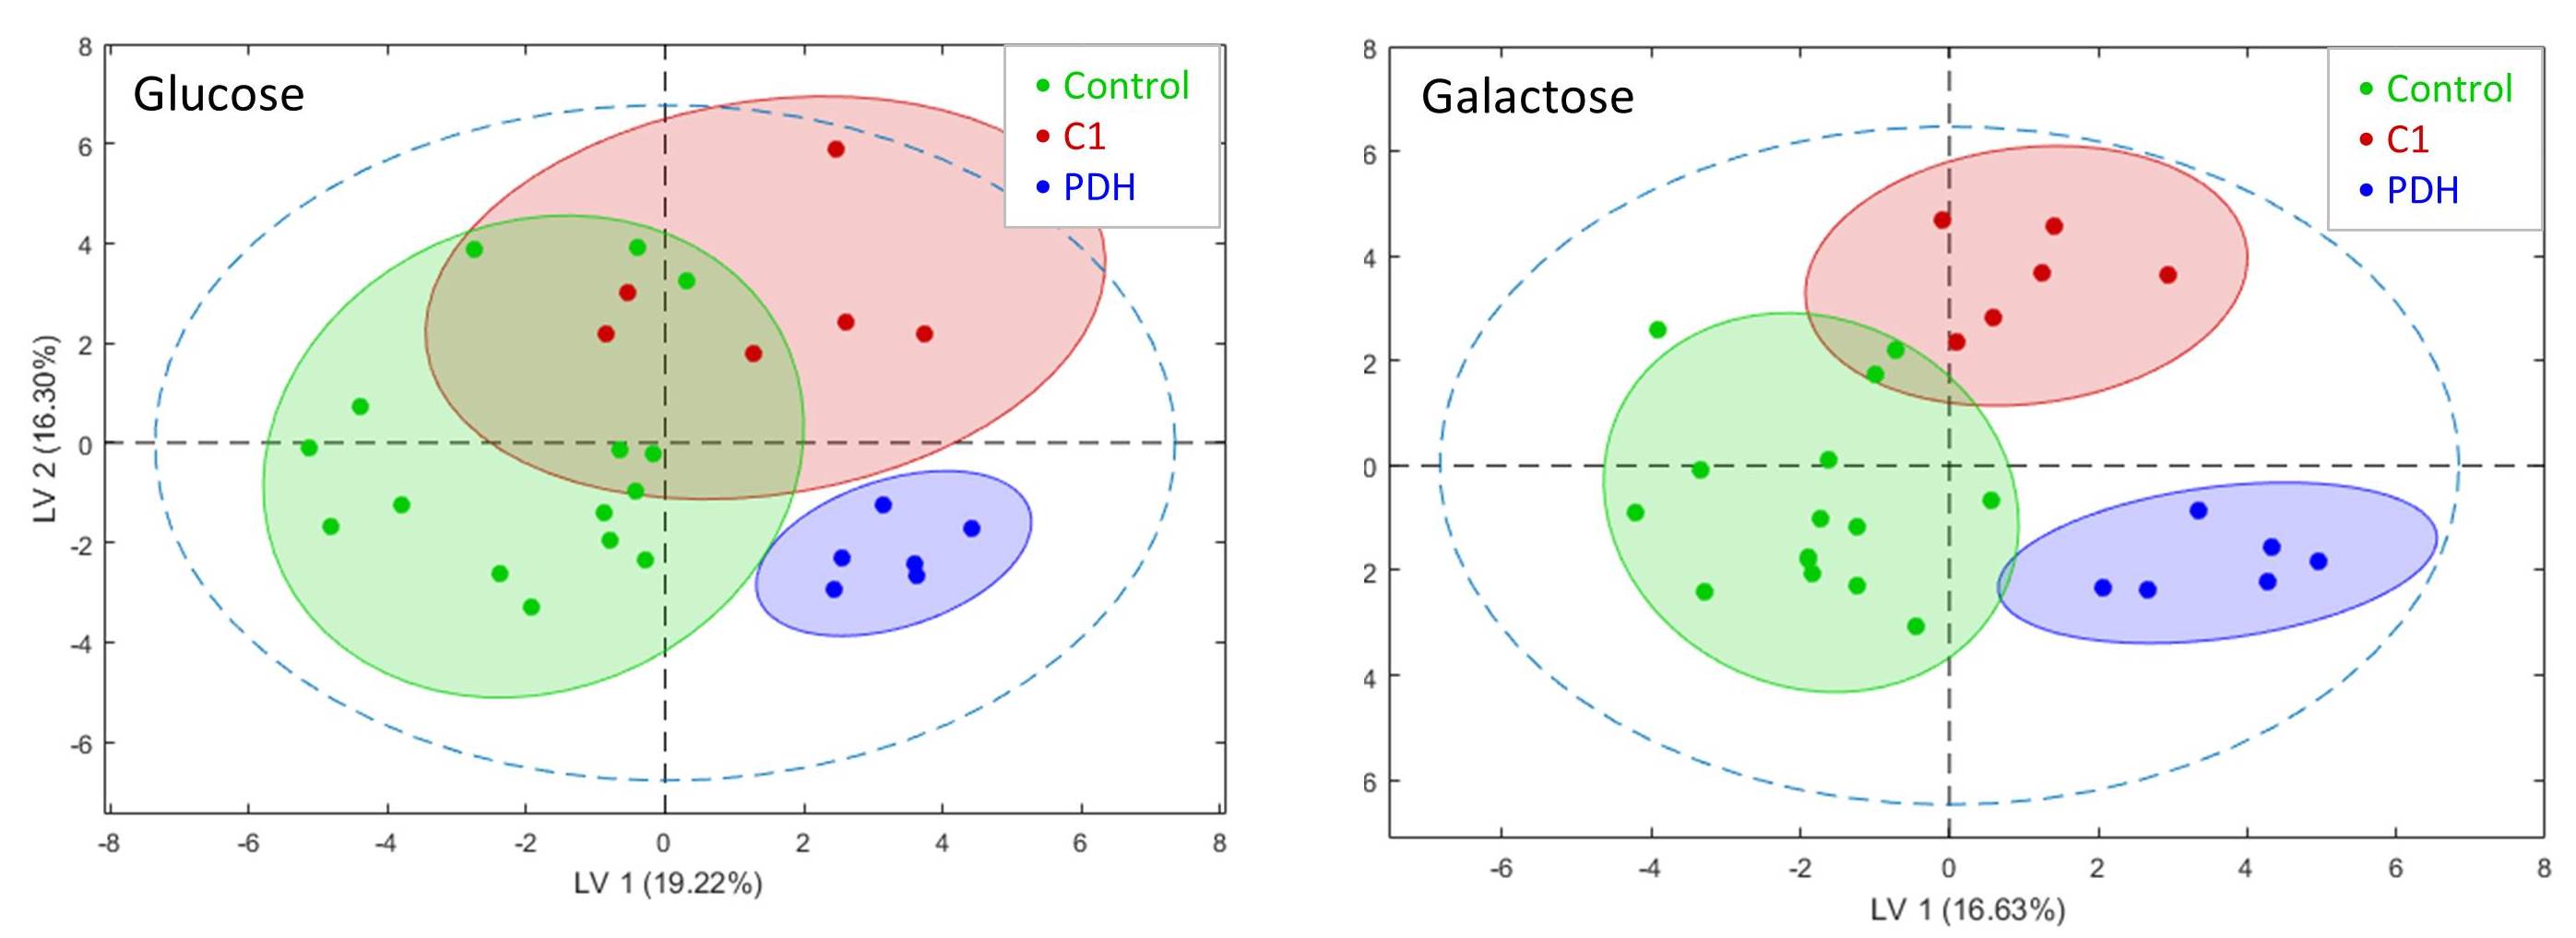
Resonances of the NMR spectra were assigned to approximately 40 metabolites (Fig.1). Partial least squares Discriminant Analysis (PLS-DA) revealed (based on cross-validation) significant separation of metabolomes of control, PDH defects and C1 deficient FB (all P < 0.05). Separation of metabolomes of control and PDH defects under glucose culture conditions were also significant (P < 0.05). C1 deficient FB were not significantly separated under glucose (Fig.2).
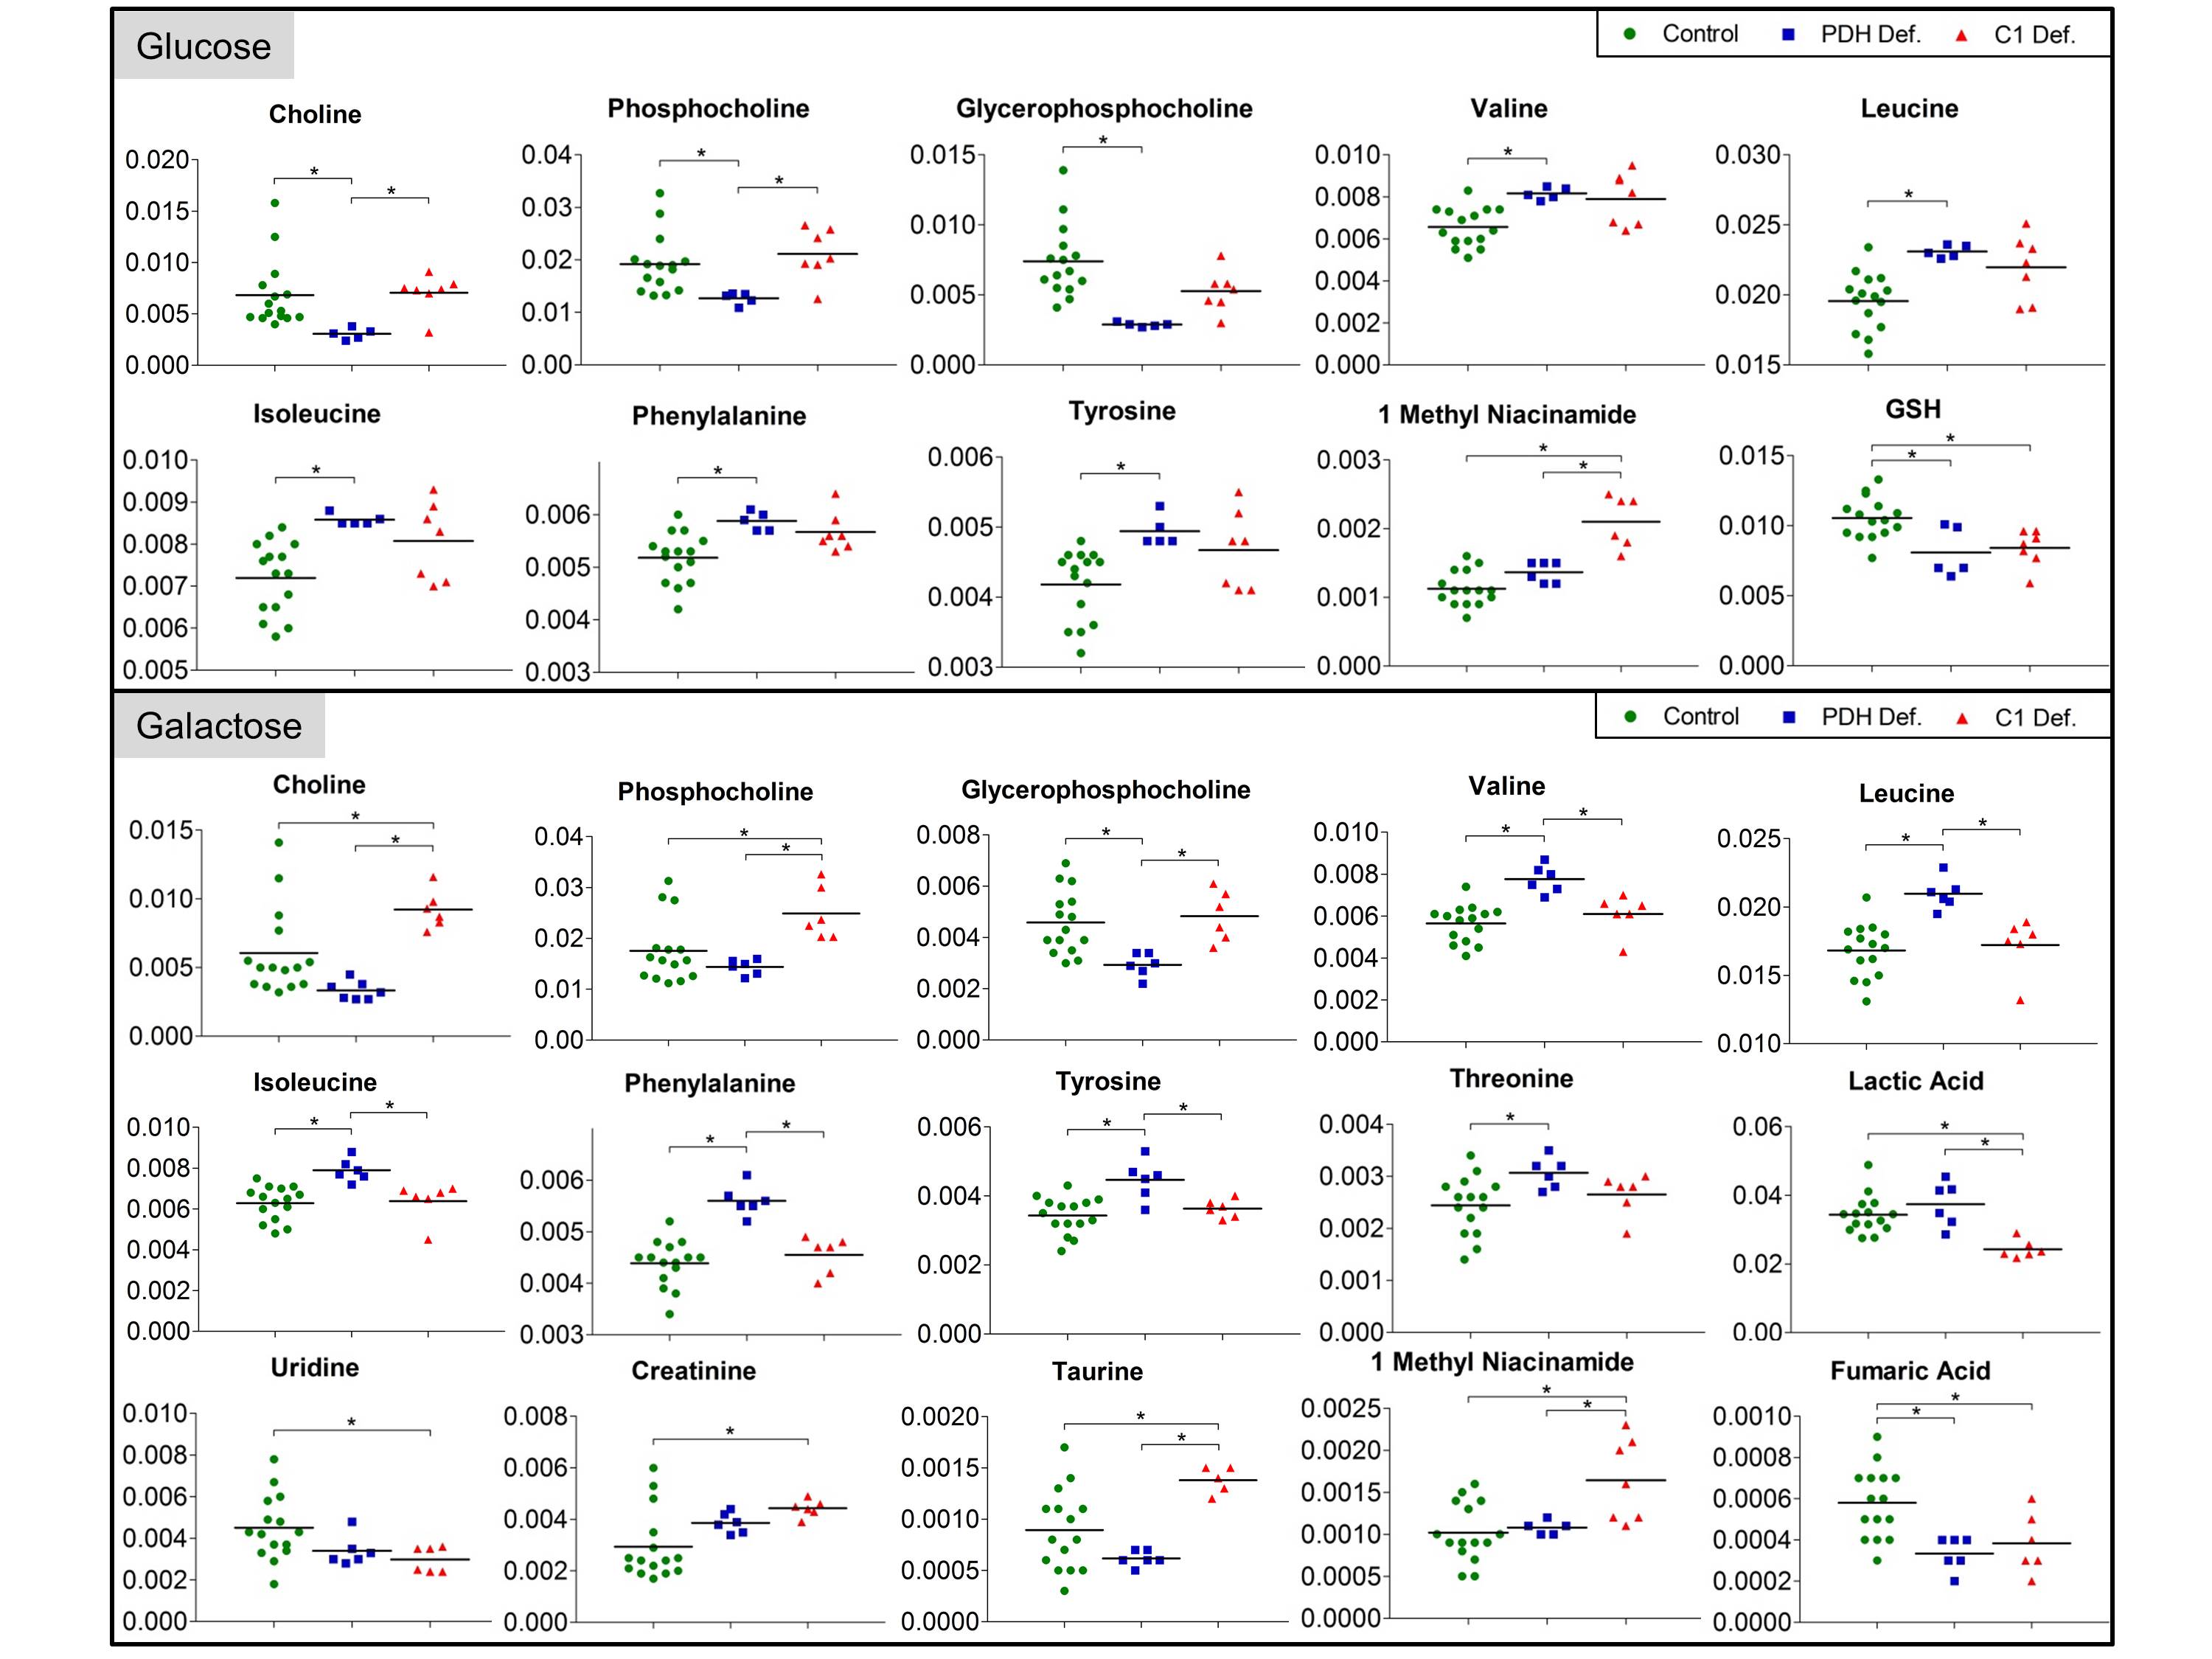
Analysis of individual metabolites revealed specific defect dependent differences (see Fig.3). PDH defects showed around 2-fold decrease in choline (Cho), phosphocholine (PC) and glycerophosphocholine (GPC) under glucose, whereas only GPC was significantly decreased under galactose. In contrast, C1 defects showed around 1.5-fold increase in Cho and PC under galactose. Furthermore, PDH deficient FB were separated by a pattern of increased accumulation of branched-chain and ketogenic amino acids under both culture conditions.
Energetic phenotypes using metabolic flux analysis
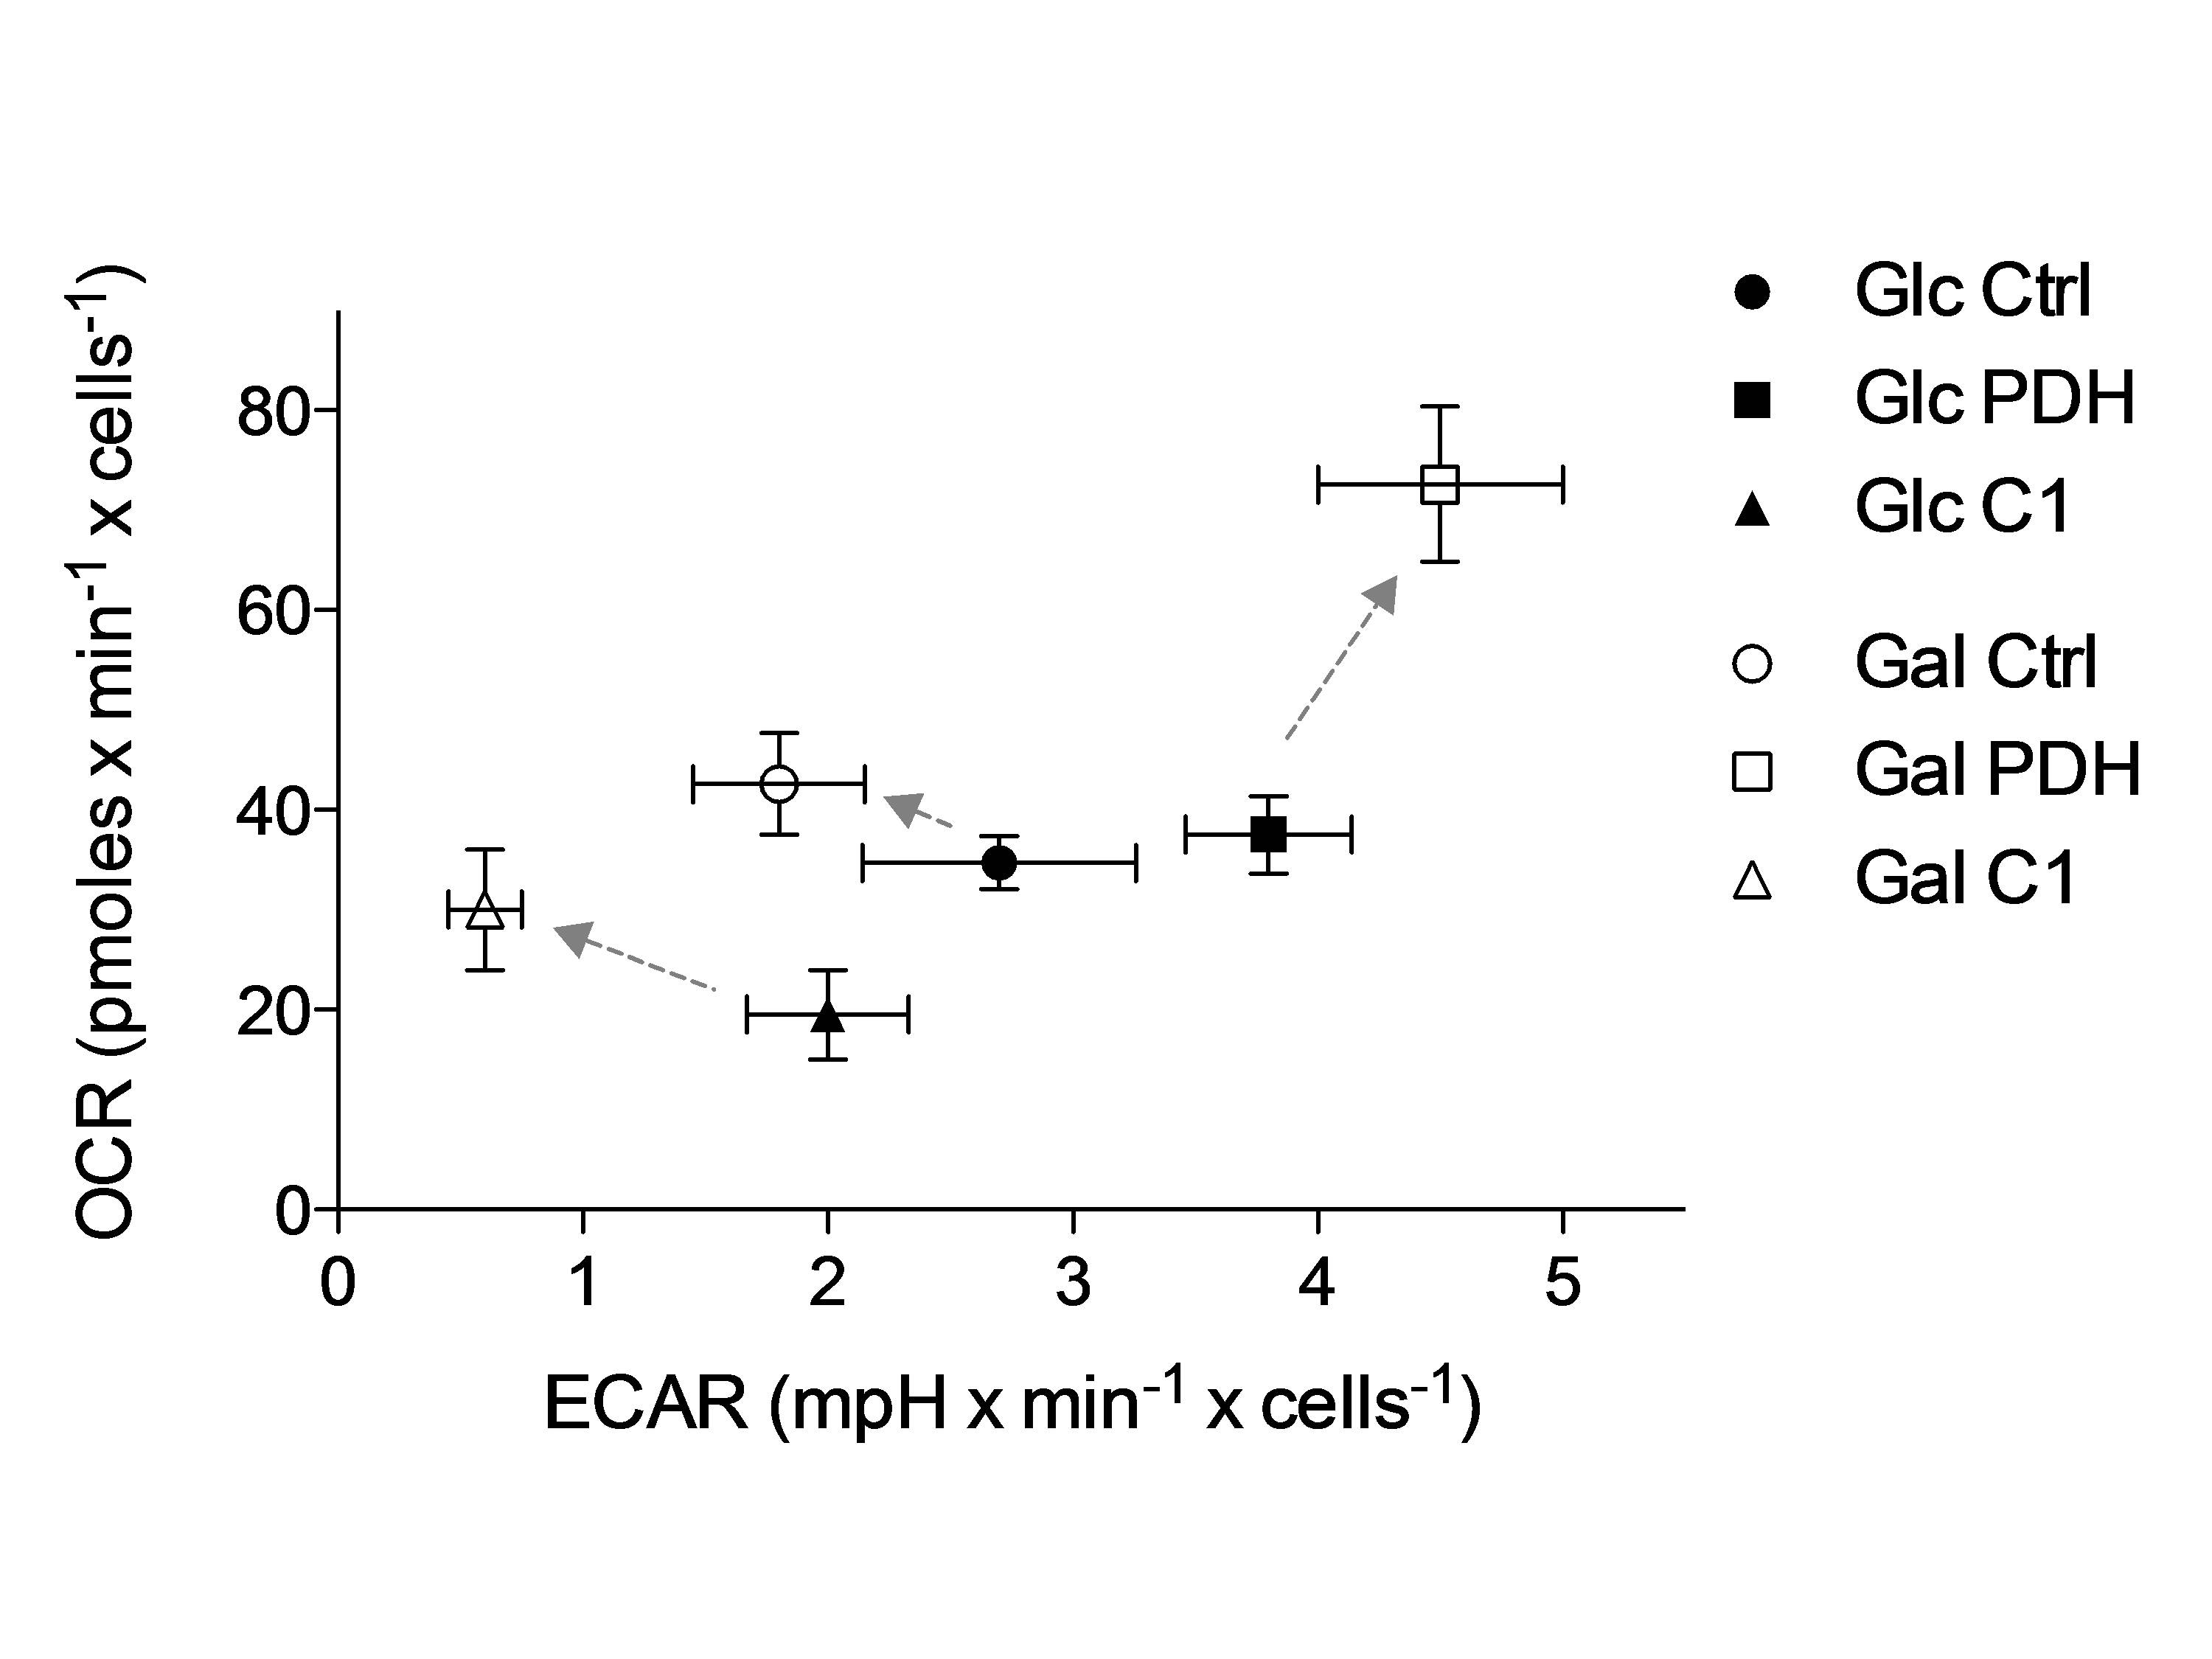
Metabolic flux analysis revealed clear separation of C1 and PDH deficient FB from controls (Fig.4) confirming expectation. PDH defects were characterized by an increased ECAR and shifted under galactose to an even more stressed phenotype (higher OCR and ECAR). In contrast, C1 showed a decreased metabolic activity (low OCR and ECAR) and shifted towards a more aerobic phenotype under galactose (higher OCR), which represented the physiological adaptation in control FB.
Discussion
OXPHOS deficiency resulted in distinct changes in several Cho metabolites, which were oppositional in the two studied defects. Changes in Cho metabolites may be associated with altered cellular membrane turnover, possibly including mitochondrial membranes(3). Altered Cho catabolic and anabolic pathways might thus represent interesting potential biomarkers for mitochondrial dysfunction.
Furthermore, accumulation of amino acids might be caused by increased protein degradation in order to fuel krebs cycle and/or inhibited catabolism. Interestingly, branched-chain amino acids are also involved in metabolic signalling(4). Further investigations are necessary in order to elucidate the association between PDH defects and amino acid dysmetabolism.
Conclusion
This study shows the relevance of selective culture methods in discriminating normal from metabolic deficient cells. Functional defects in PDH and C1 have specific biochemical consequences that are reflected by unique cellular metabolic profiles. NMR profiling has potential to distinguish specific mitochondrial diseases and to determine new disease biomarkers.Acknowledgements
This work was supported by the Swiss Mobiliar's Anniversary Foundation.References
(1) G. Diserens, D. Hertig, M. Vermathen, B. Legeza, C.E. Fluck, J.M. Nuoffer, and P. Vermathen, Analyst 2017, 142(3): p. 465-471.
(2) J. A. Aguilar, M. Nilsson, G. Bodenhausen, G.A. Morris, Chemical Communications 2012, 48, 811-813.
(3) A.T. Baykal, M.R. Jain, H. Li, Metabolomics 2008, 4(4):347-356.
(4) C.J. Lynch, S.H. Adams, Nat Rev Endocrynology 2014, 10(12):723-736.
Figures