4024
In vitro NMR spectroscopy identifies metabolic changes resulting from addition of a novel anti-cancer agent (AZD2014) to standard treatment, guiding potential imaging approaches1The Institute of Cancer Research and The Royal Marsden NHS Foundation Trust, London, United Kingdom
Synopsis
Previous reports showed that activation of the PI3K/mTOR pathway is associated with chemoresistance in ovarian cancer cells, and this can be reversed by combining chemotherapy with the mTORC1/2 inhibitor vistusertib (AZD2014). This combination is now being pursued clinically. In this study, we used NMR spectroscopy to establish biomarkers for this combination in A2780Cis human ovarian carcinoma cells. We report that this combination resulted in decreases in lactate, PC, GPC and tCho and was associated with inhibition of glycolysis- and choline-regulatory enzymes. This indicates that choline metabolites and lactate may provide potential non-invasive biomarkers of tumour response to this combination therapy.
INTRODUCTION
Activation of the PI3K/mTOR signalling pathway has been shown to contribute to resistance in ascitic cells from ovarian cancer patients showing chemoresistance to cisplatin.1 Additive apoptosis was seen when vistusertib (AZD2014, a dual mTORC1/2 inhibitor) was added to paclitaxel in preclinical models, and this combination is now being pursued clinically.2 Our aim was to assess whether this combination results in metabolic changes that are detectable by NMR spectroscopy providing potential non-invasive biomarkers for monitoring response to AZD2014 and paclitaxel combination during early stage clinical trials.
METHODS
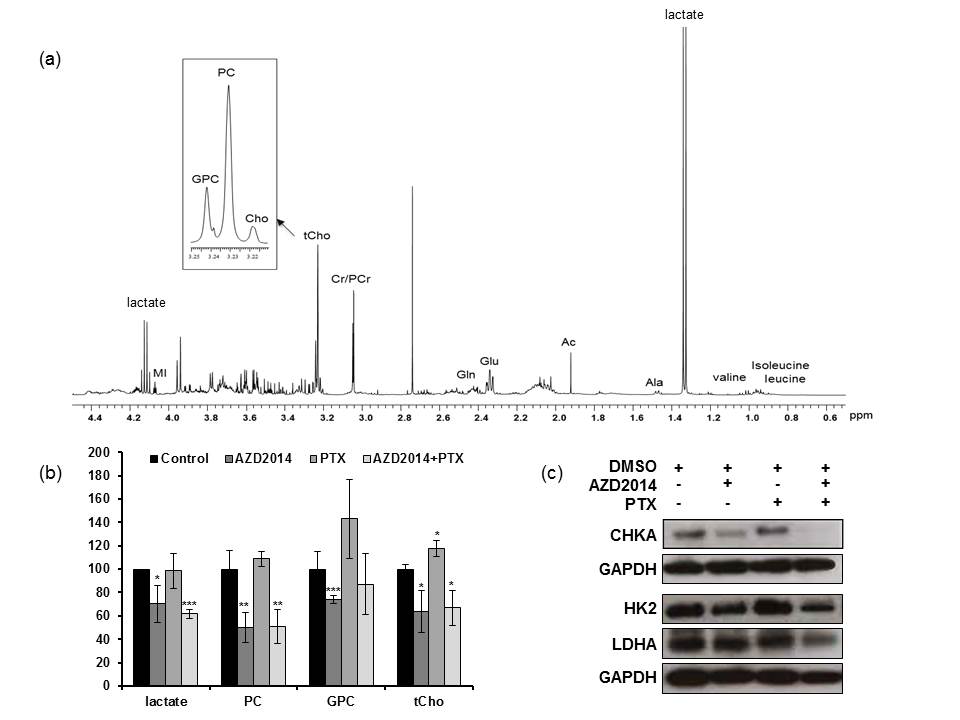
The A2780Cis human cisplatin-resistant ovarian carcinoma cell line was treated with AZD2014 (AstraZeneca; 2.5xGI50) and paclitaxel (2.5xGI50) both individually and in combination (2.5xGI50 +2.5xGI50) for 24hr. Treatment effects were studied at molecular and cellular levels. Metabolic changes were evaluated by NMR spectroscopy at 25°C with a 500 MHz Bruker spectrometer. Metabolite contents were determined by integration and normalised relative to the peak integral of an internal reference and the number of cells extracted per sample.RESULTS & DISCUSSION
Treatment of A2780Cis cells with paclitaxel reduced cell number (down to 67±5, P=0.001) relative to their controls. AZD2014 also resulted in a decrease in the cell number (down to 78±6, P=0.008) of treated cells compared to controls. Combination of paclitaxel with AZD2014 resulted in a further decrease in treated cell number (down to 56±8, P=0.003) compared to controls. Consistent with the mechanism of action, immunoblotting analysis of cells treated with AZD2014 showed an inhibition of PI3K/mTOR signalling observed as a decrease in the levels of phosphorylated AKT(Ser473) and RPS6(Ser240/244) in treated cells compared to their controls, while paclitaxel induced apoptosis as detected by cleaved PARP. Combination treatment of paclitaxel with AZD2014 resulted in combined molecular effects of both agents including inhibition of PI3K/mTOR signalling and induction of apoptosis. 1H-NMR analysis showed that treatment with AZD2014 induced a significant (P≤0.05) decrease in the levels of lactate, phosphocholine (PC), glycerophosphocholine (GPC) and total choline (tCho; Fig. 1a&b). In contrast, paclitaxel resulted in increased levels of tCho (P≤0.05; Fig. 1a&b). Interestingly, combination treatment of paclitaxel with AZD2014 resulted in metabolic changes similar to those caused by single treatment with AZD2014 including a decrease in the levels of lactate, PC and tCho (P≤0.05; Fig. 1a&b). These metabolic changes in cells support our previous findings where similar changes in choline-containing metabolites were observed both in vivo and ex vivo.3 To explore potential mechanisms underlying the detected metabolic changes, immunoblotting was used to assess treatment effects on protein levels of enzymes involved in glycolysis and choline metabolism. Our results showed that the decrease in levels of PC observed following treatment with AZD2014 alone and in combination with paclitaxel was associated with a decrease in the protein levels of choline kinase α (CHKA), the enzyme responsible for choline phosphorylation into PC (Fig. 1c). A previous report showed that the mTORC1 inhibitor Everolimus resulted in a decrease in the hyperpolarized lactate-to-pyruvate ratio and that was associated with a drop in expression of LDHA (catalyses the conversion of pyruvate to lactate).4 In line with this study, a decrease in the protein expression level of LDHA was detected following AZD2014 treatment and the combination (Fig. 1c). In addition, a reduction in the glycolytic enzyme HK2 (phosphorylates glucose into glucose-6-phosphate) was observed (Fig. 1c), providing further evidence for the inhibition of glycolysis as a mechanism for the NMR-detected depletion of lactate.CONCLUSION
Our results show that NMR spectroscopy can detect metabolic changes including changes in lactate and choline metabolites following combination treatment of paclitaxel with the mTORC1/2 inhibitor AZD2014. Our findings correlate with in vivo NMR-detected biomarkers and indicate that MRS or other imaging modalities (e.g. PET and DNP) may have the potential to be used to monitor response to this combination therapy during early stage clinical trials.Acknowledgements
CRUK and EPSRC support to the Cancer Imaging Centre at ICR and RMH in association with MRC and Department of Health C1060/A10334, C1060/A16464 and NHS funding to the NIHR Biomedical Research Centre and the Clinical Research Facility in Imaging.References
- Carden C et al. Mol Cancer Ther 11 (2012) 1609-17.
- Thavasu P et al. In: Proceedings of the 106th AACR Annual Meeting 2015; April 18-22, 2015; Philadelphia, PA. Abstract nr CT138.
- Wong Te-Fong AC et al. In: Proceedings of the AACR Special Conference: Metabolism and Cancer; Jun 7-10, 2015; Bellevue, WA. Philadelphia (PA): AACR; Mol Cancer Res 2016;14(1_Suppl):Abstract nr B10.
- Chaumeil MM et al. NeuroImage 59 (2012) 193–201.
Figures