4023
A metabolomic evaluation of prostate cancer field effects1Pathology, Massachusetts General Hospital, Charlestown, MA, United States, 2Oncology, Charite Medical University, Berlin, Germany
Synopsis
The gold standard in diagnosing prostate cancer (PCa) is pathological examination of biopsy cores. Still, false negative rates remain between 30-50%. Studies of cancer field effects suggest that tissue without histologically visualizable cancer cells has diagnostic value and could enlarge biopsy target regions. To map metabolic field effects in human prostates, we used HRMAS-MRS to analyze multiple tissue samples throughout entire removed cancer-positive prostates. Evaluation of metabolomic profiles of histologically-benign (Hb) tissue showed that Hb tissues at varying distances to PCa lesions have different metabolic profiles. Hb tissue enables differentiation between clinical parameters (Gleason Score, pathological stage, cancer-affected prostate %).
Introduction
The gold standard in the diagnosis of prostate cancer (PCa) is a pathological examination of biopsy cores. Still, false negative rates remain as high as 30-50%1. However, cancer studies have proposed the idea of cancer field effects which could enlarge the biopsy target region for biopsy without direct visualization of cancer cells1,2. Cancer field effects refer to the occurrence of genetic, epigenetic, and biochemical aberrations in histologically benign (Hb) tissues adjacent to cancerous lesions3. HRMAS MRS is compatible with histopathological analysis; it enables correlations between histopathological features and metabolomic profiles, and is ideal to study cancer field effects. Here, for the first time, we analyzed multiple tissue samples throughout entire human prostates removed with prostatectomy due to PCa, and evaluated metabolomic profiles of Hb tissue of different distances relative to PCa lesions.Methods
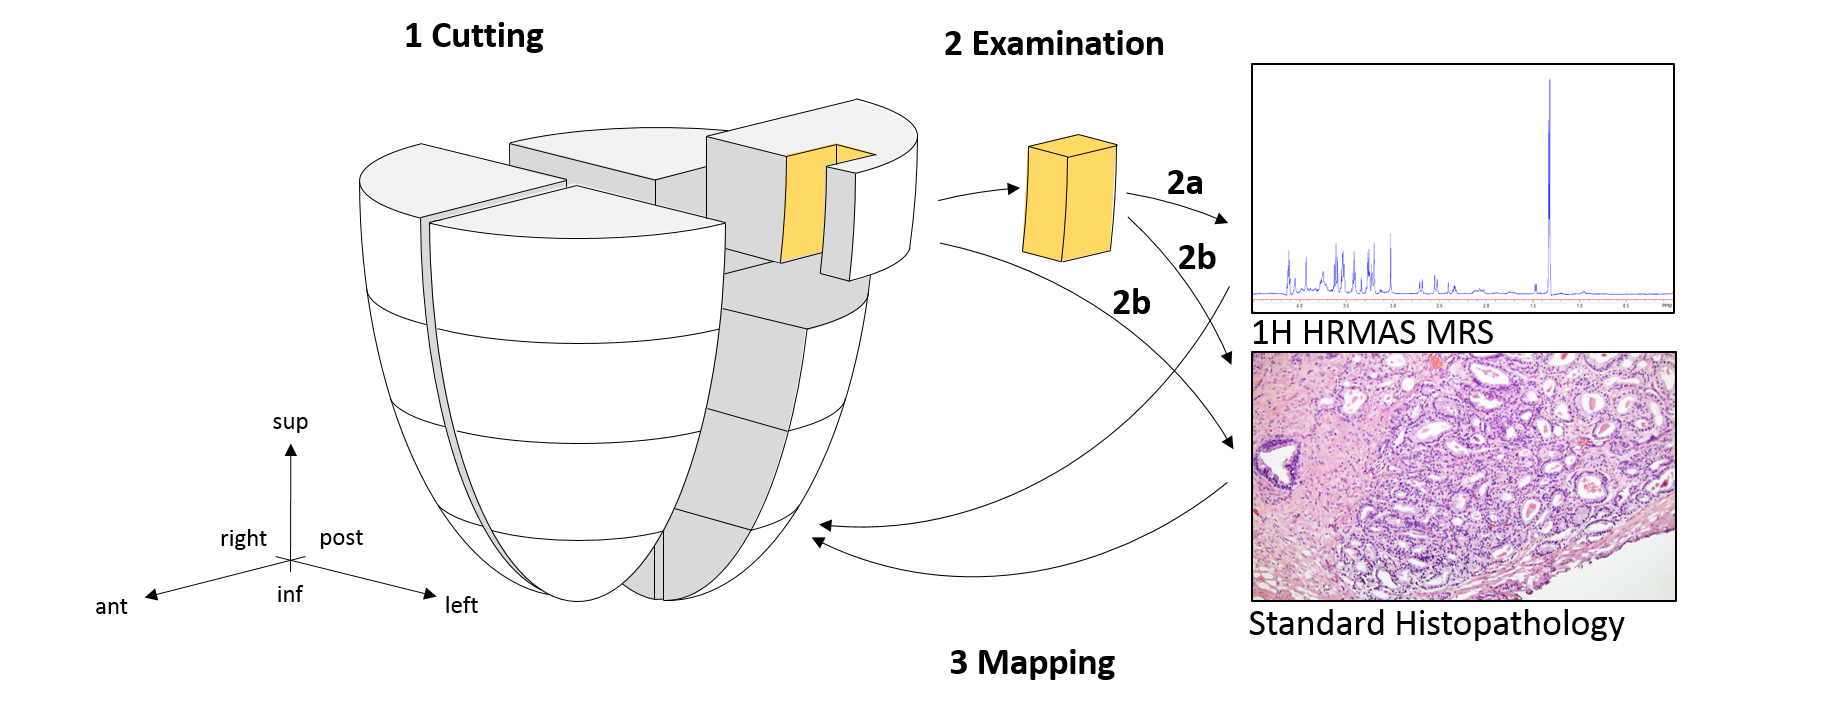
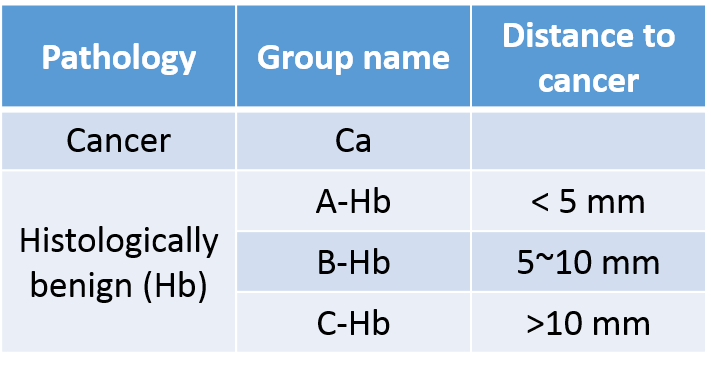
The study thus far involves 112 tissue samples from 7 cancerous prostates following radical prostatectomy. Sixteen samples (~0.5x0.5x0.5cm) from the peripheral zone of each prostate were collected (Figure 1). Samples were stored at -80oC until MRS analyses. Ten mg of tissue samples were measured with high-resolution magic angle spinning MRS on a Bruker AVANCE 600MHz spectrometer. Spectra were recorded at 4oC with spinning at both 600 and 700Hz4. Data were processed using an in-house developed MatLab program. Relative metabolite concentrations were calculated by normalizing each peak by the creatine region (3.03ppm). Spectral regions where >80% of samples had detectable values (n=54) were further analyzed. Principal component analysis (PCA) was conducted on all 54 regions. Following MRS, tissue samples underwent histopathology analysis and were read for volume percentage (vol%) of pathological features (stroma, glands, cancer) and the pattern of cancer lesions (extensive, many, moderate, small, focal). To identify relative distances between the analyzed tissue samples and the closest cancer lesions, a categorical system was introduced which reflects the three-dimensional distances (Figure 2). To account for heterogenous presentation of pathological features in each sample, the spectroscopic data were calibrated according to the vol% of pathologies using a least squares regression-overdetermined linear model.Results
Characterization of the field effect
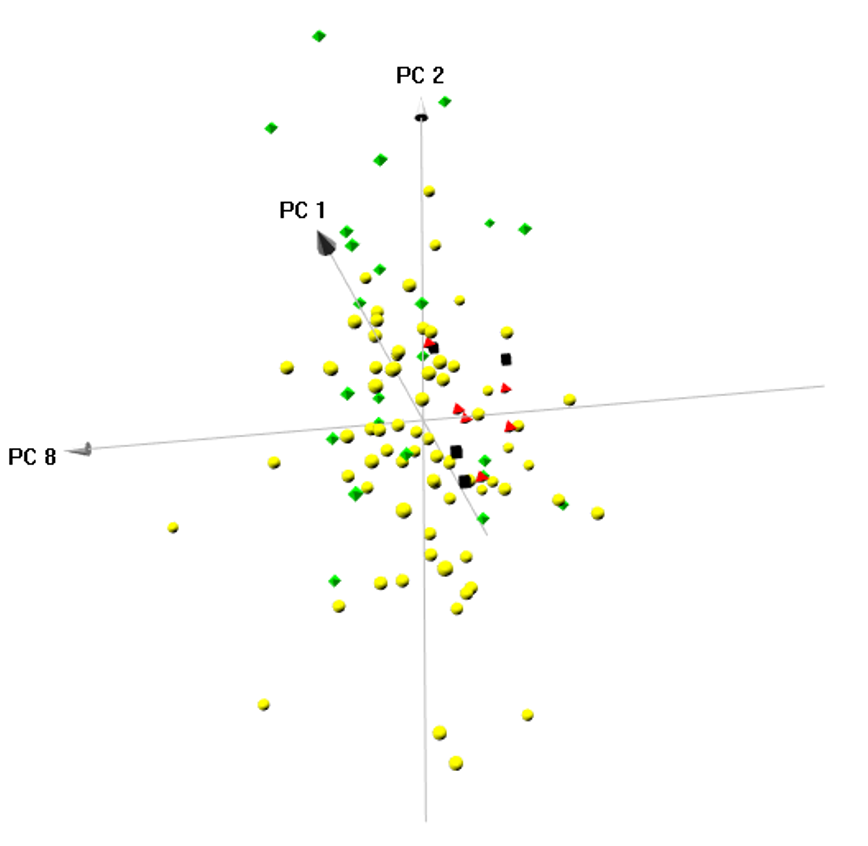
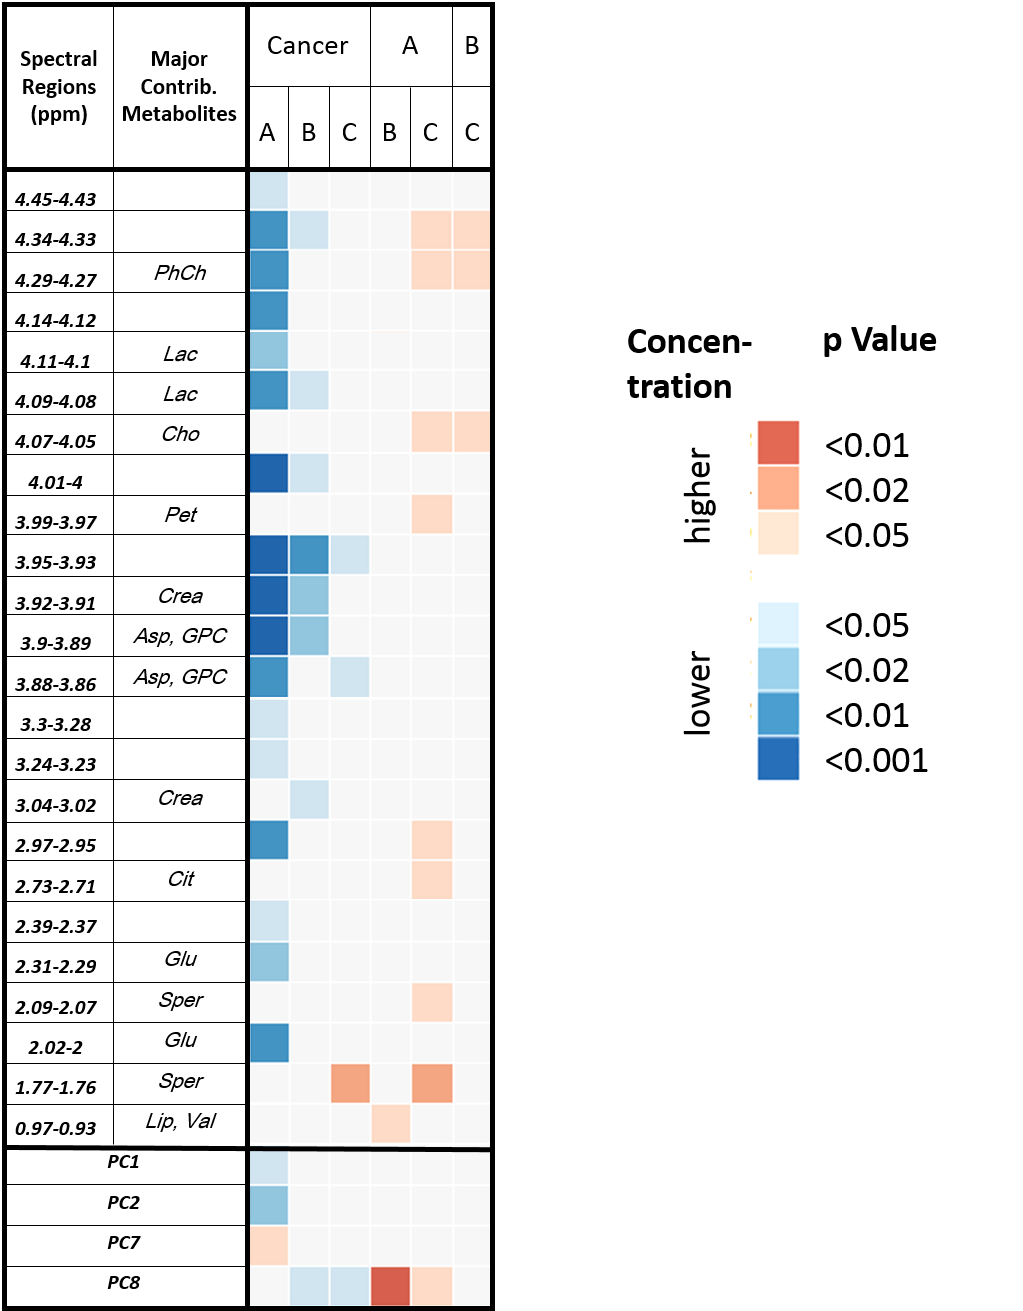
PCA on the MRS data revealed 10 components (PCs) with Eigenvalues > 1, which were selected for further analysis. A three-dimensional score plot of Components 1, 2, and 8 enabled visual differentiation between cancer and all Hb groups (Figure 3). Wilcoxon each-pair analysis based on PCs showed that cancer can be significantly differentiated from all Hb groups (Figure 4, first three columns). Among the Hb groups, Group A-Hb can be significantly differentiated from groups B-Hb and C-Hb, whereas group B-Hb and C-Hb cannot (last three columns).
Wilcoxon each-pair analysis based on spectral regions enabled differentiation of all groups. Interestingly, the concentration of all regions found to be significantly altered in the Hb groups decreased with increasing distance. This is shown in Figure 4 by the three comparisons between Hb groups (A, B, C) that show increased values (red squares) for the groups which are closer to cancer.
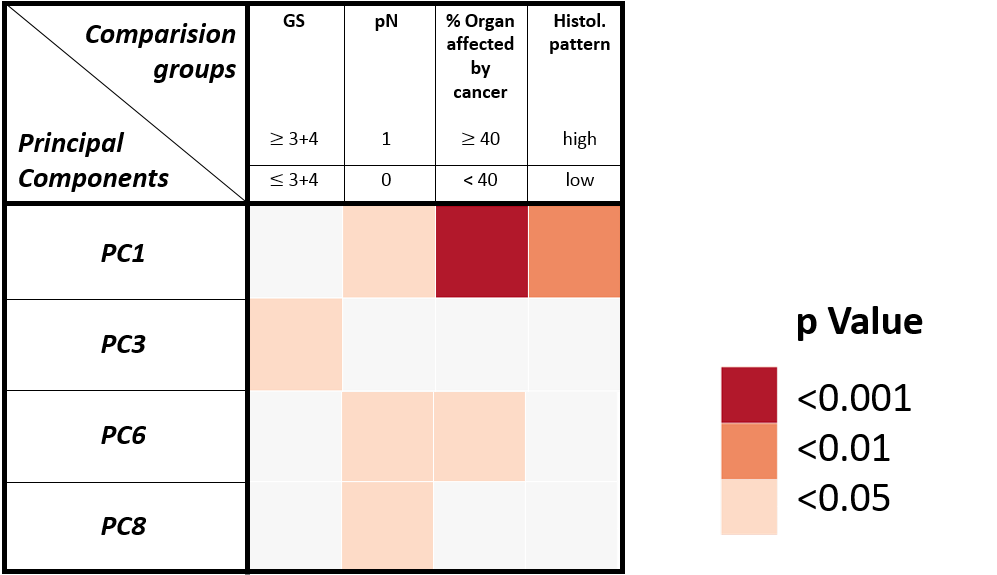
Correlation with clinical and pathological conditions in Hb tissue
Among the Hb samples, group A-Hb samples could differentiate significantly between different clinical and pathological conditions (Figure 5).
Discussion and Conclusions
Distinguishing GS and pN in histologically benign samples is of clinical importance for diagnosis and prognosis, as they enlarge the target region for biopsies and might reduce false negative results. Understanding metabolomic fields is also of great importance for study design, as many projects use Hb tissues from the same patient as controls. This usage might confound results since cancer-positive tissue is being compared to tissue which is likely to metabolically differ from healthy tissue from a cancer-free organ.
A biological interpretation of the metabolites that characterize field effects can contribute to a deeper understanding of the pathophysiology of cancer. Others reported that in PCa, reactive stroma was found to initiate during early PCa development and co-evolves with cancer progression5. The altered stroma is similar to that found in wound repair scenarios. Interestingly, valine and choline, two metabolites that could significantly distinguish Hb tissue at different distances in our study, were also described to characterize wound repair processes6.
By analyzing multiple samples per prostate, we were able to visualize the three-dimensional metabolomic field effects of PCa. Development is underway for an algorithm to evaluate field effects in the whole organ based on exact distance to the cancer and total prostate volume. Nevertheless, with a categorical system we described here for the first time a snapshot of cancer-related metabolism and mapping of metabolomic fields in a whole prostate.
Acknowledgements
We acknowledge NIH grant CA115746 and thank the A. A. Martinos Center for Biomedical Imaging.References
1. Trujillo KA, Jones AC, Griffith JK, Bisoffi M. Markers of field cancerization: proposed clinical applications in prostate biopsies. Prostate Cancer. 2012;2012:302894.
2. Tian Y, Xu T, Huang J, et al. Tissue Metabonomic Phenotyping for Diagnosis and Prognosis of Human Colorectal Cancer. Scientific reports. 2016;6:20790.
3. Slaughter DP, Southwick HW, Smejkal W. Field cancerization in oral stratified squamous epithelium; clinical implications of multicentric origin. Cancer. 1953;6(5):963-968.
4. Burns MA, Taylor JL, Wu CL, et al. Reduction of spinning sidebands in proton NMR of human prostate tissue with slow high-resolution magic angle spinning. Magnetic resonance in medicine. 2005;54(1):34-42.
5. Barron DA, Rowley DR. The reactive stroma microenvironment and prostate cancer progression. Endocrine-related cancer. 2012;19(6):R187-204.
6. Sood RF, Gu H, Djukovic D, et al. Targeted metabolic profiling of wounds in diabetic and nondiabetic mice. Wound Repair Regen. 2015;23(3):423-434.
Figures