4019
Effect of lactate administration on brain lactate concentrations during hypoglycemia in patients with type 1 diabetes1Radiology and Nuclear Medicine, Radboud university medical center, Nijmegen, Netherlands, 2Internal Medicine, Radboud university medical center, Nijmegen, Netherlands, 3Pediatrics, Radboud university medical center, Nijmegen, Netherlands
Synopsis
Lactate administration during hypoglycemia suppresses counterregulatory responses, which mimicks the condition of impaired awareness of hypoglycemia (IAH) seen in patients with type 1 diabetes. Lactate can act as an alternative cerebral fuel and/or lactate can drive other brain-protective processes. We examined whether lactate administration affects brain lactate concentrations, as measured with J-difference editing 1H-MRS, during hypoglycemia in patients with normal awareness of hypoglycemia (NAH) and in patients with IAH. Brain lactate concentrations increased modestly upon lactate infusion in both groups. These results suggest that the excess lactate entering the brain is immediately oxidized, which may suppress the hypoglycemic counterregulatory response.
Introduction
The administration of lactate during hypoglycemia considerably diminishes symptomatic and hormonal responses to hypoglycemia.1,2 This effect can be explained by lactate substituting glucose as a cerebral fuel and/or that lactate drives other brain-protective processes. Clinically, lactate administration mimics the situation seen in patients with type 1 diabetes (T1DM) and impaired awareness of hypoglycemia (IAH). In IAH, the threshold for the onset of hypoglycemic symptoms and counterregulation is shifted to lower glucose values. Altered brain lactate handling, such as an increased lactate transport capacity across the blood-brain barrier3, has been implicated in the pathogenesis of IAH.
Whether or not high plasma lactate levels lead to accumulation of lactate in the brain is subject of debate.4-7 This is important since accumulation of lactate in the brain could mean that its brain-protective effect during hypoglycemia is not derived from lactate oxidation.
To investigate this, we examined to what extent lactate administration, in a dose sufficient to impair awareness of hypoglycemia, affects brain lactate concentrations in T1DM with normal awareness of hypoglycemia (NAH) and compared the results obtained in patients with IAH.
Methods
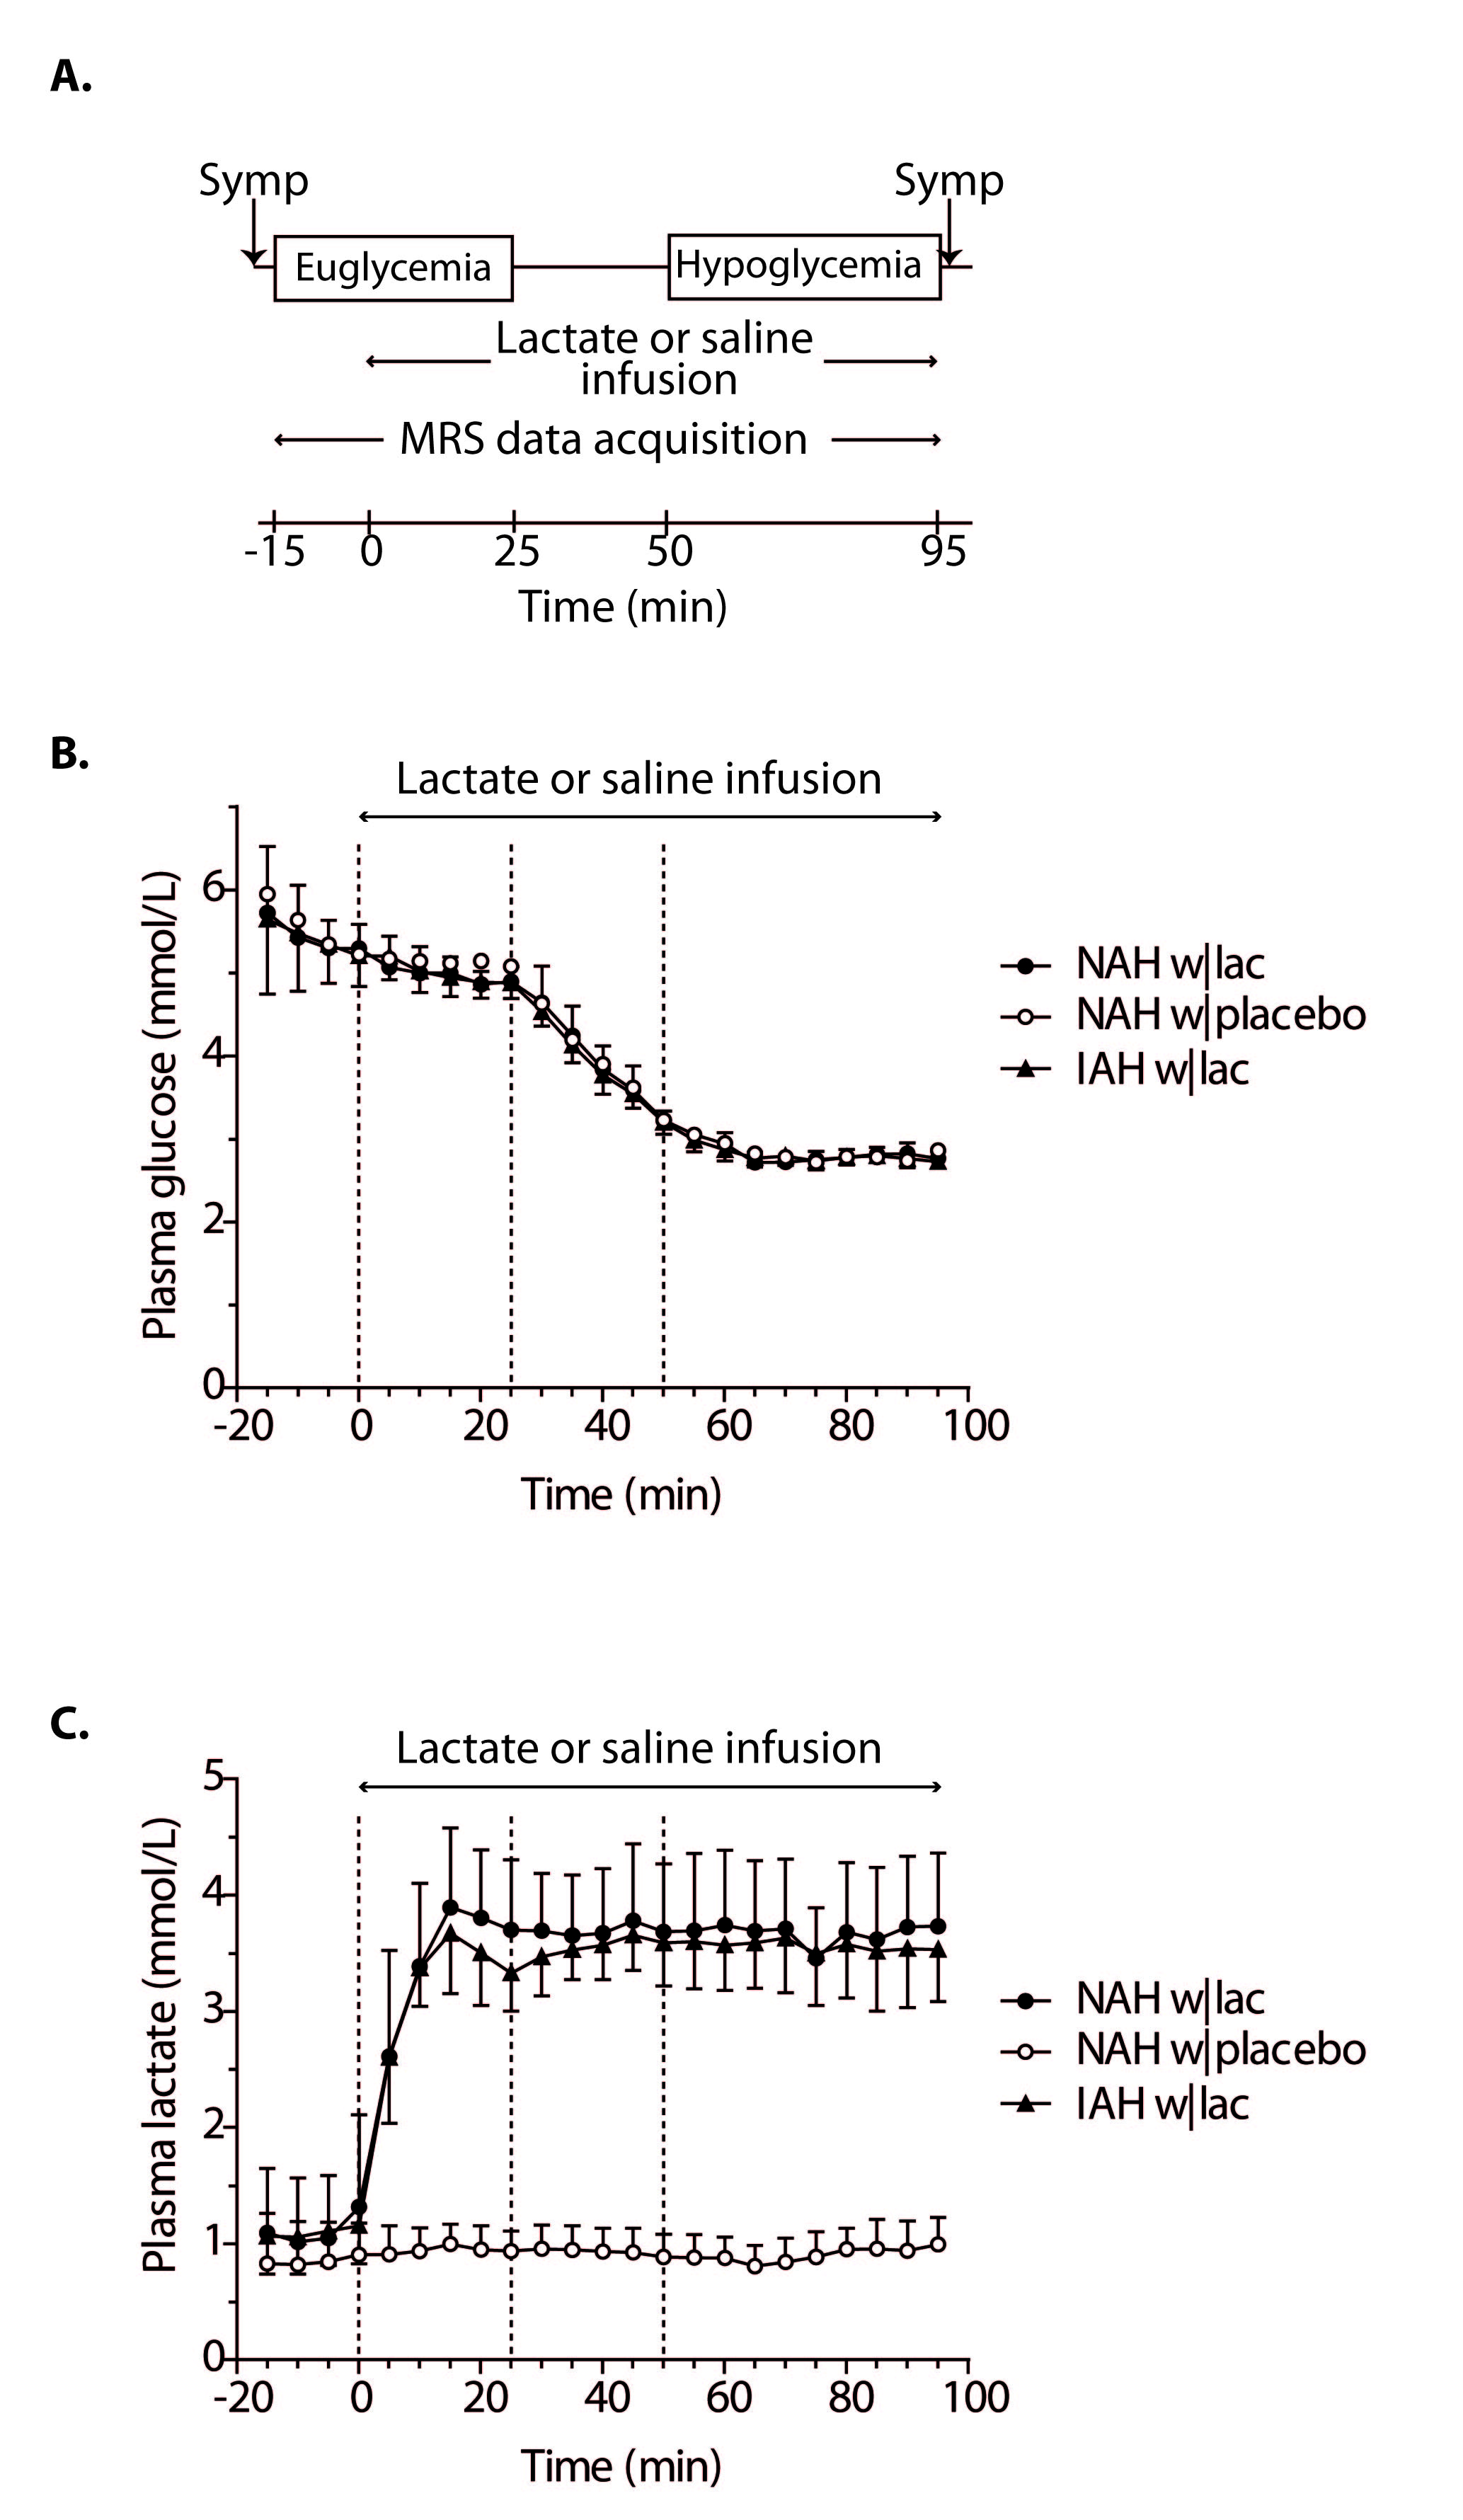
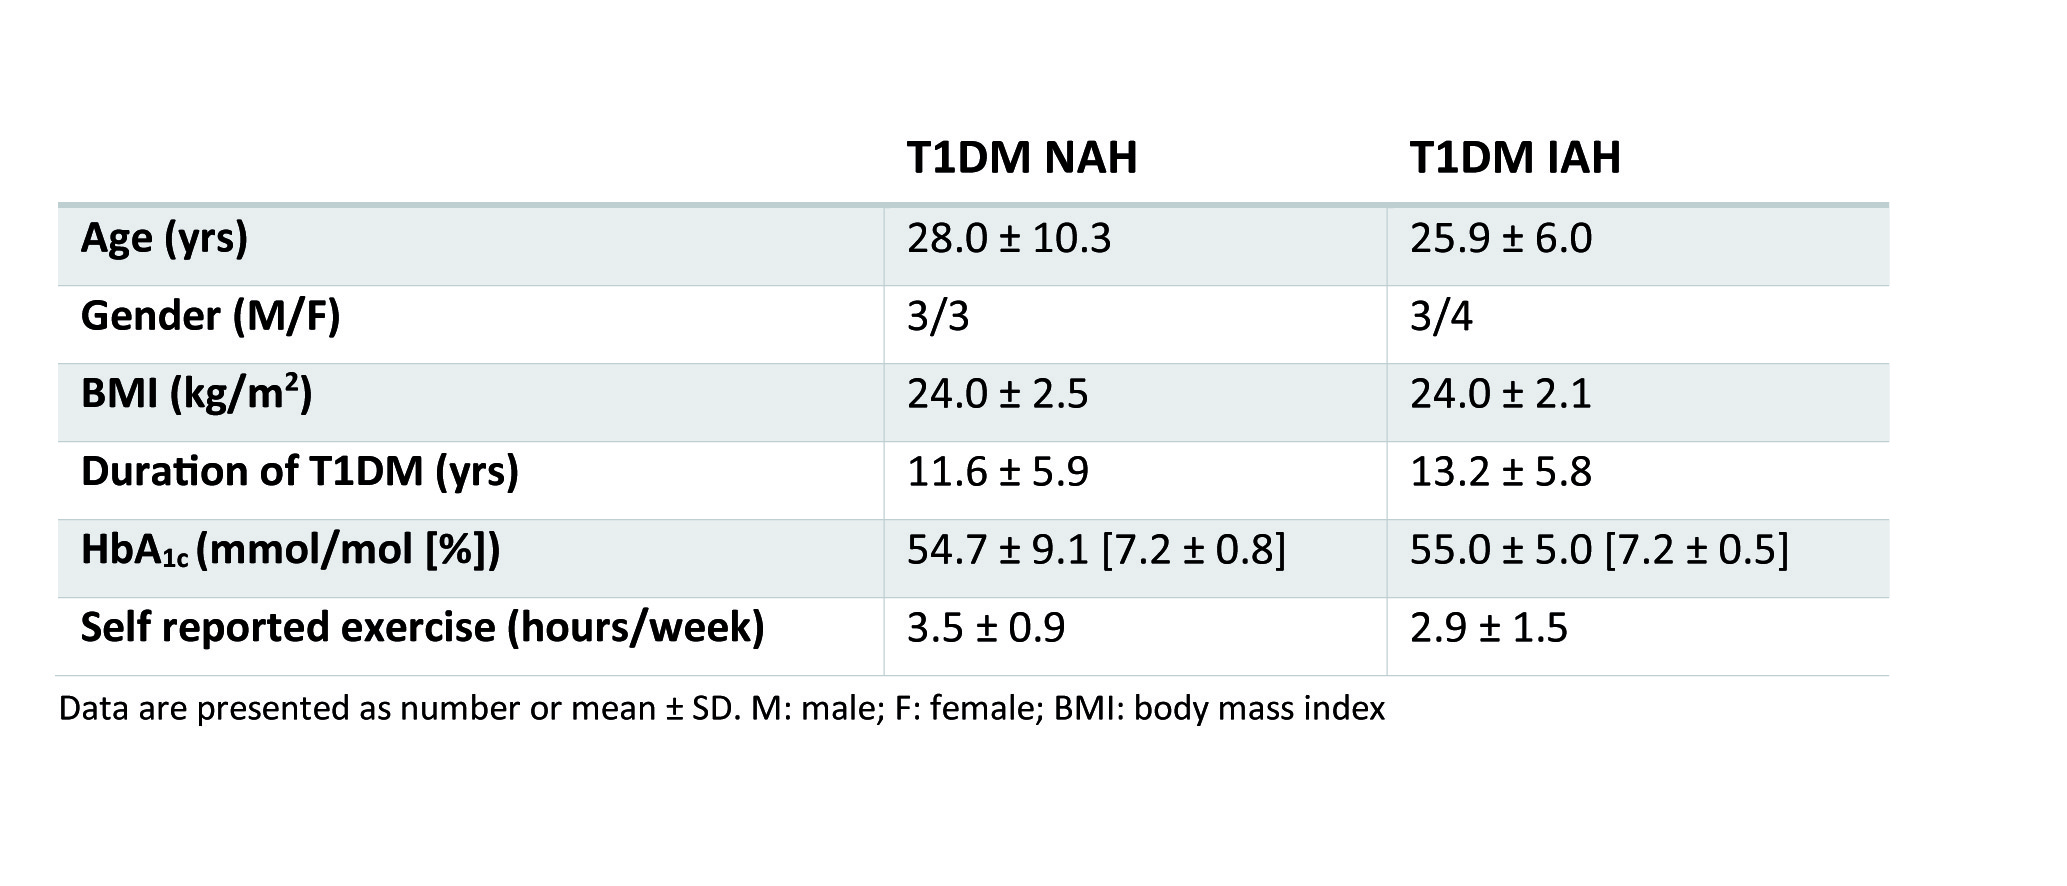
Experimental protocol: Six T1DM NAH and seven T1DM IAH subjects were enrolled (table 1). Patients with NAH underwent two euglycemic-hypoglycemic clamps, once with sodium lactate infusion (NAH w|lac) and once with saline infusion (NAH w|placebo), in a single-blind fashion and in a random order, at least two weeks apart. Patient with IAH participated only in the sodium lactate infusion study arm (IAH w|lac). Brain lactate levels were determined continuously with 1H-MRS at 3T (MAGNETOM Prisma, Siemens) from a 22.5 cm3 voxel in the periventricular brain, using a J-difference editing semi-LASER8 sequence (TE 144 ms, TR 3000 ms, 8 averages). Frequency selective inversion pulses (MEGA, bandwidth of 75 Hz) were centered on the lactate quartet at 4.1 ppm and subsequently at -3 ppm. Additionally, spectra without water suppression (TE 30 ms, TR 5000 ms, 8 averages) were acquired. Arterial plasma glucose and lactate levels were determined every 5 minutes. Symptom responses were assessed during euglycemia and hypoglycemia (Fig. 1A).
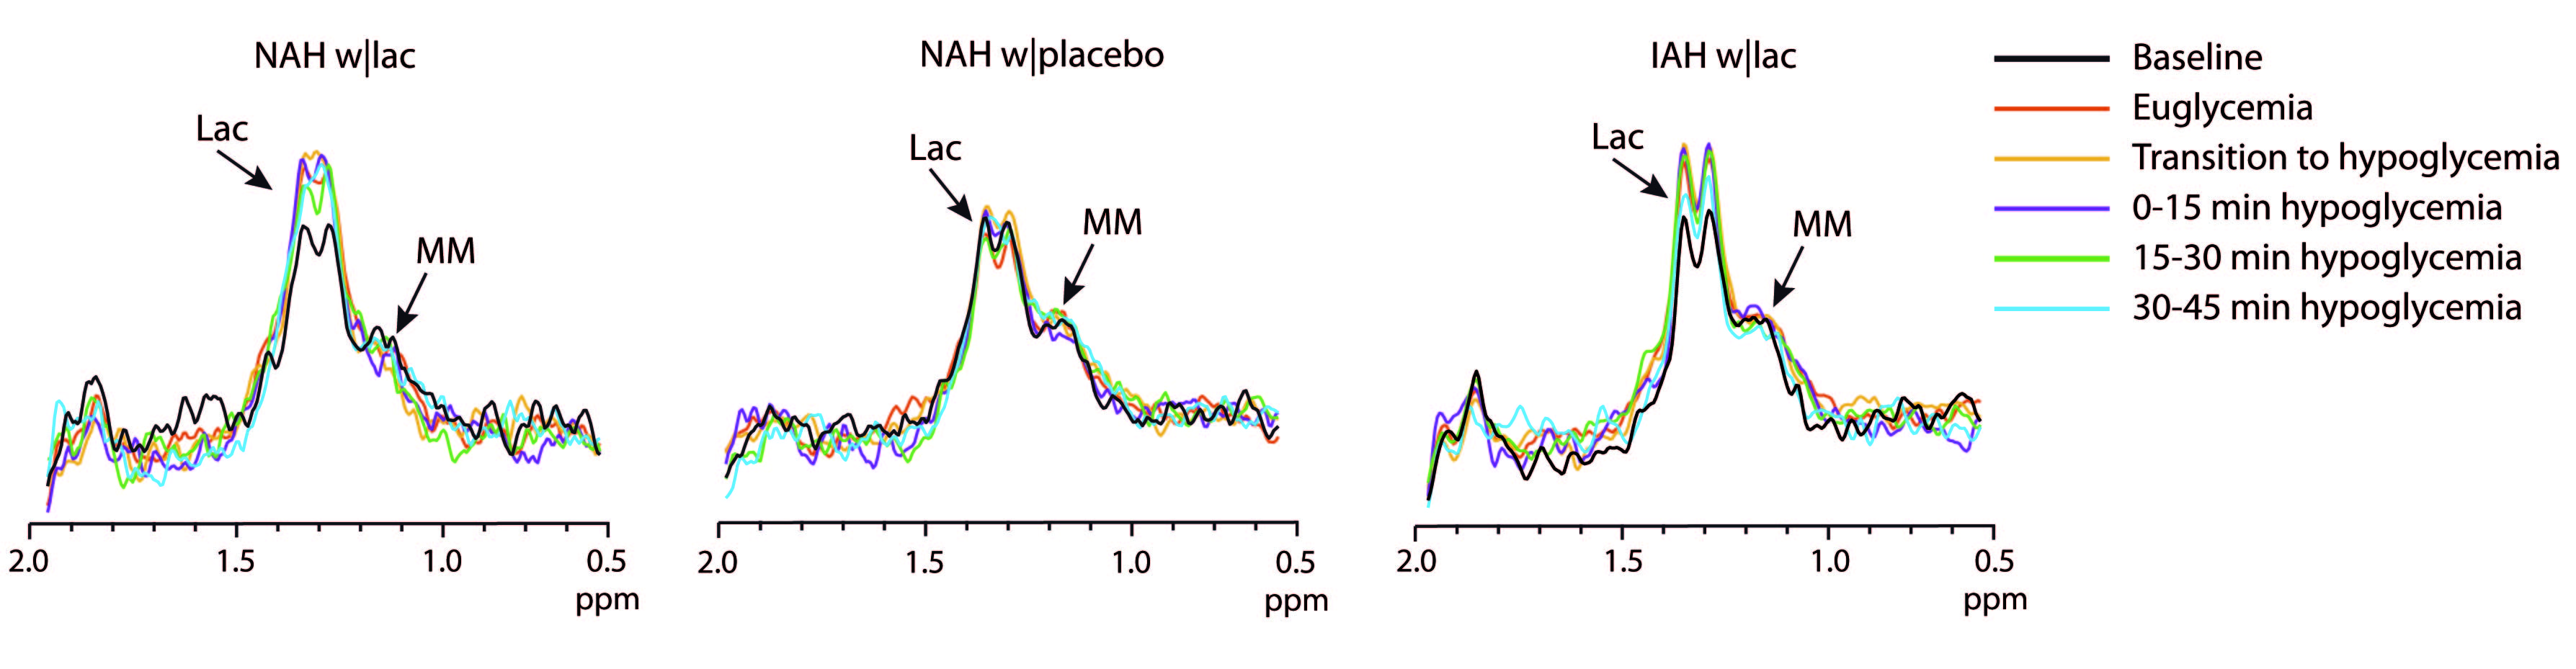
Post-processing: Spectra were zerofilled, phase and frequency aligned9 and motion-corrupted spectra were discarded. Subsequently, spectra were subtracted pairwise. The difference spectra were averaged within participants across six different phases: baseline, euglycemia, transition to hypoglycemia, and each 15-minute block of hypoglycemia. From these final difference spectra, the lactate doublet at 1.3 ppm was fitted with AMARES in jMRUI.10 Lactate was quantified using the unsuppressed water signal as a reference, taking voxel composition, T2-relaxation and the contamination of blood vessels into account.
Statistics: Serial data were compared between NAH w|lac and NAH w|placebo with a two-way repeated measures ANOVA and within IAH|lac with a one-way repeated measures ANOVA. The area under the curve (AUC) of the baseline-corrected brain lactate levels was calculated in IAH w|lac to determine the effect of lactate infusion.
Results
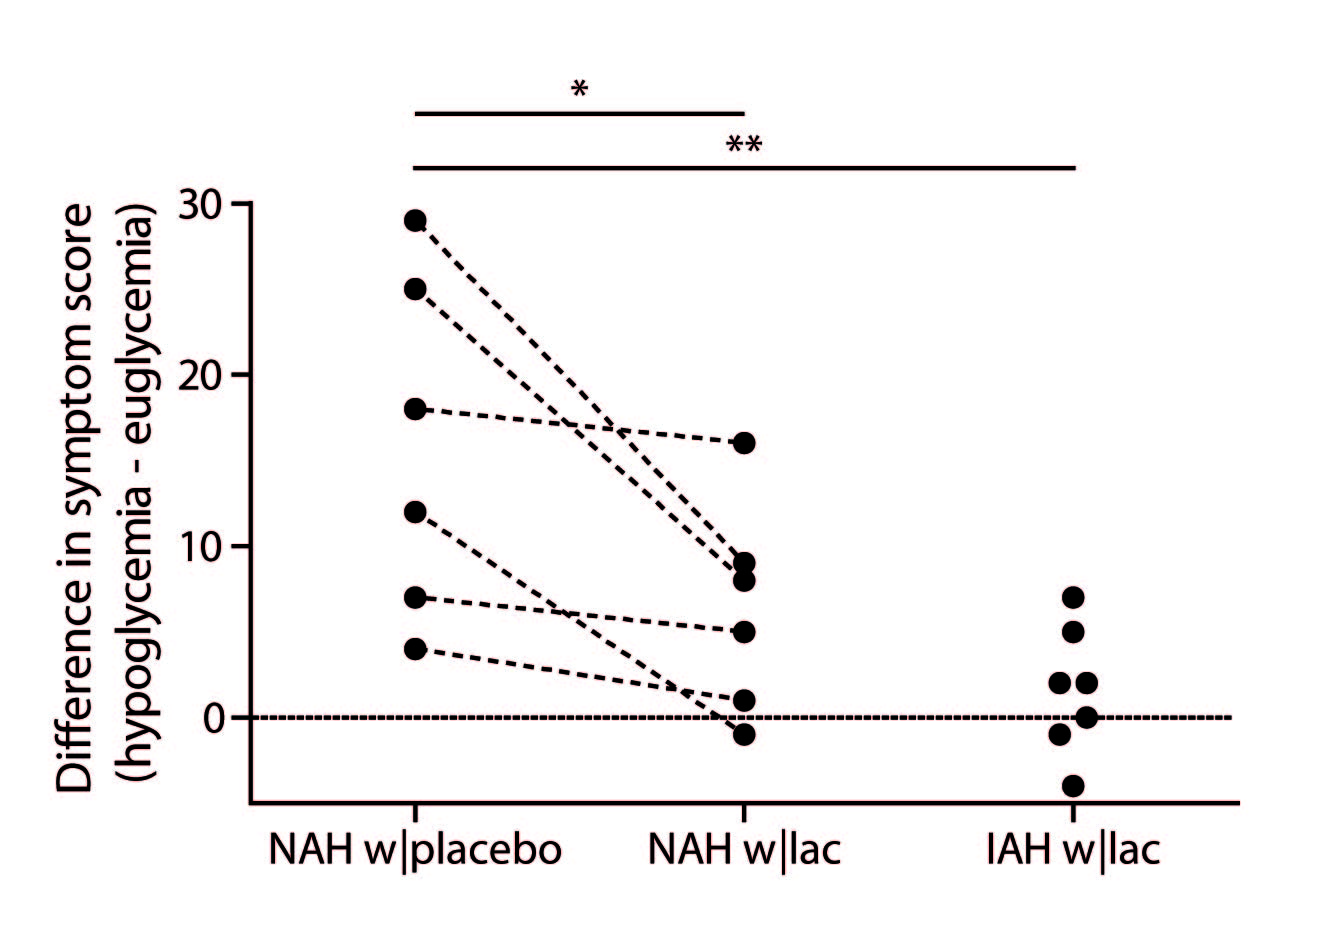
Figure 1B illustrates the achievement of stable euglycemia (5.1±0.2 mmol/l) and hypoglycemia (2.8±0.1 mmol/l) in all groups. Plasma lactate levels increased similarly in patients with NAH w|lac and IAH w|lac (Fig. 1C). Lactate infusion clearly suppressed symptom responses to hypoglycemia in patients with NAH (Fig. 2).
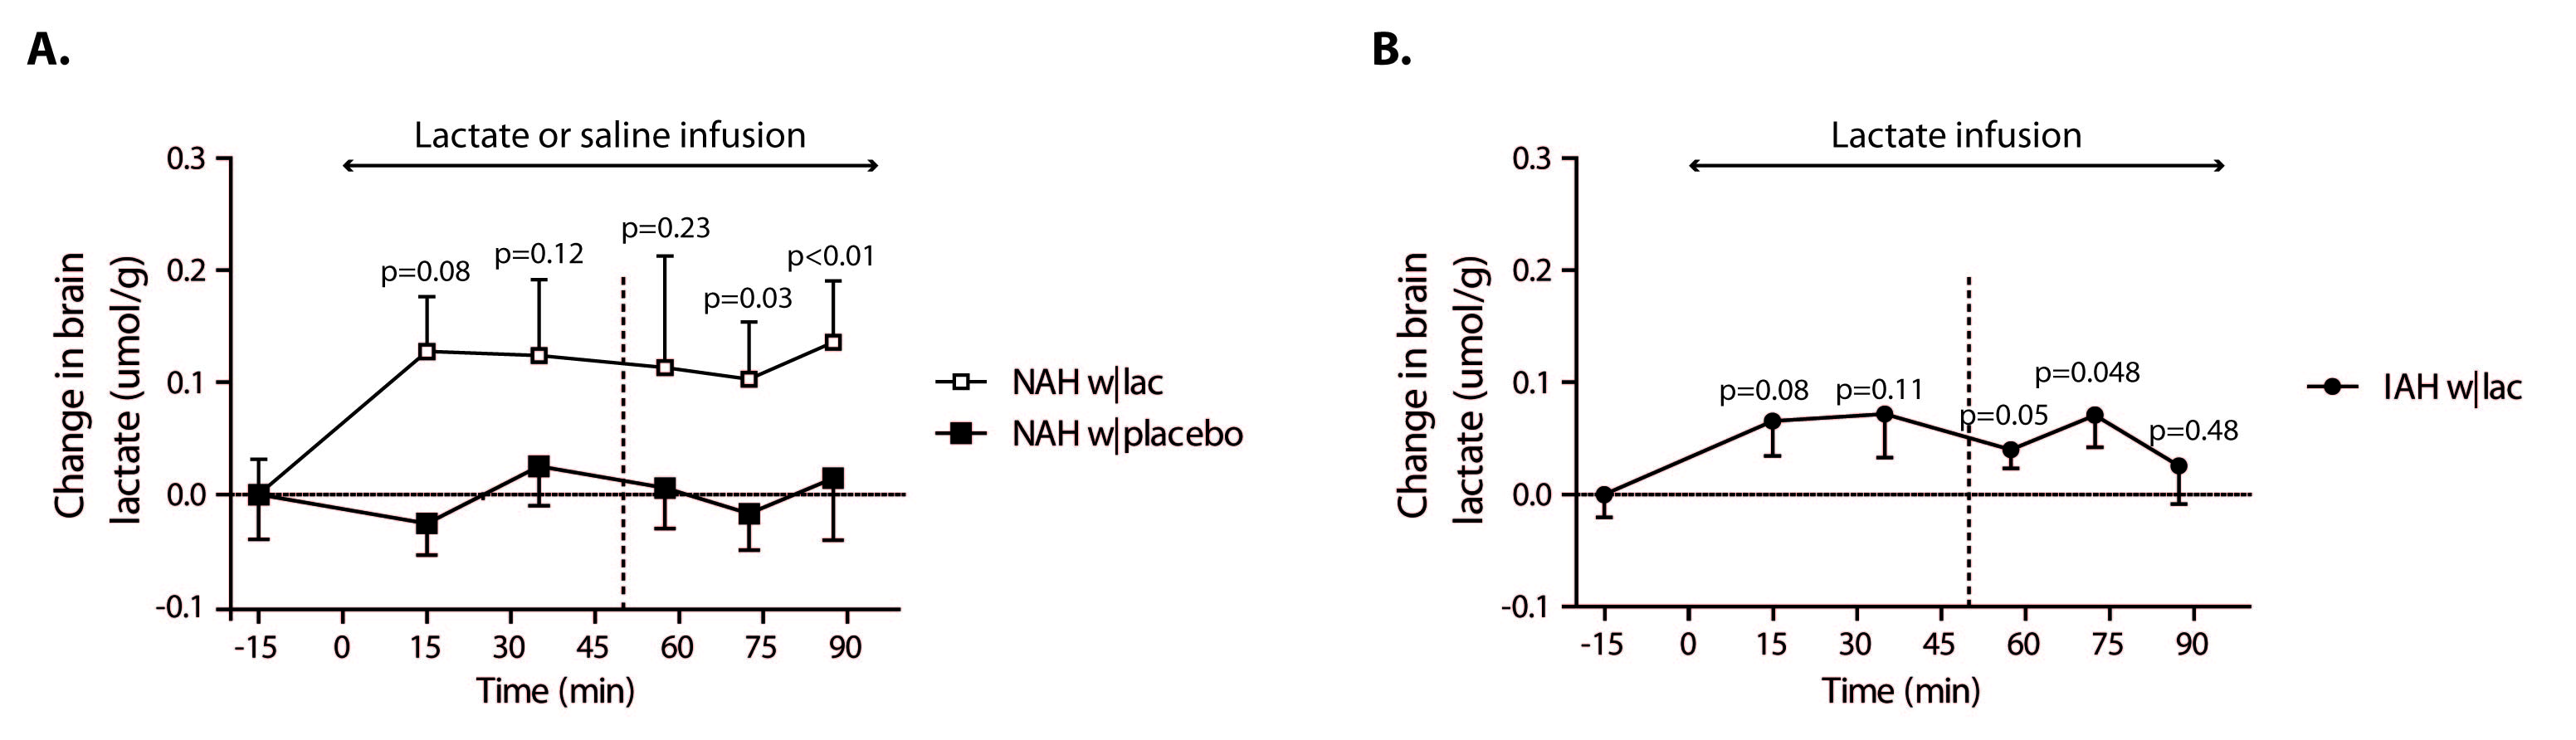
Baseline brain lactate levels were similar across groups and intervention (0.58±0.08, 0.64±0.1 and 0.59±0.05 µmol/g in NAH w|lac, NAH w|placebo and IAH w|lac, respectively; p=0.42). J-edited difference spectra, recorded during infusion of lactate, showed an increase of the lactate signal in the brain (Fig. 3). Infusion of lactate increased brain lactate levels in patients with NAH by 0.12±0.05 µmol/g (mean difference compared to placebo, p=0.048; Fig. 4A) and in patients with IAH by 0.06±0.04 µmol/g (mean increase p=0.03; Fig. 4B). Although the increase in brain lactate levels in IAH w|lac was numerically less pronounced compared to NAH w|lac, this difference was not statistically significant (p=0.36).
Brain lactate levels did not change in patients with NAH in response to hypoglycemia when saline was infused.
Discussion and conclusion
Our results confirm that lactate infusion reduces counterregulatory responses to hypoglycemia. The administration of lactate resulted in a modest increase in brain lactate concentrations in patients with NAH and patients with IAH.
Since cerebral lactate uptake is driven by a concentration gradient from blood to brain, it is likely that elevated plasma lactate levels result in an increased cerebral lactate uptake.5 As we found no substantial accumulation of lactate in the brain in response to lactate infusion, we hypothesize that lactate taken up by the brain is almost completely oxidized. An increase in brain lactate oxidation during hypoglycemia can indeed explain the suppressive effects of lactate on awareness of hypoglycemia observed in patients with NAH.
Acknowledgements
No acknowledgement found.References
1. Veneman et al. Diabetes, 1994 2. Maran et al. Diabetologia 2000 3. Gulanski, J Clin Endocrinol Metab, 2013 4. De Feyter et al. Diabetes, 2003 5. Van Hall et al. J Cereb Blood Flow Metab, 2009 6. Boumezbeur et al. J Neurosci, 2010 7. Wiegers et al. Diabetes, 2017 8. Scheenen et al. Mang Reson Med, 2008 9. Wiegers et al. MAGMA, 2017 10. Vanhamme et al. J Magn Reson, 1997Figures