4018
The effect of a 12-week aerobic exercise intervention on neurometabolites in young healthy adults using 7T 1H-MRS1Department of Radiology and Nuclear Medicine, Academic Medical Center, University of Amsterdam, Amsterdam, Netherlands, 2Spinoza Centre for Neuroimaging, Royal Netherlands Academy of Arts and Sciences (KNAW), Amsterdam, Netherlands, 3Swammerdam Institute for Life Sciences, Center for Neurosciences, University of Amsterdam, Amsterdam, Netherlands, 4Department of Radiology, University Medical Center Utrecht, Utrecht, Netherlands, 5Department of Experimental Psychology, Helmholtz Institute, Utrecht University, Utrecht, Netherlands
Synopsis
Prolonged exercise has beneficial effects on cognition, which could be mediated by changes in neuronal metabolism. We present the first 7T MRS exercise study investigating neurometabolite concentrations before and after randomization to aerobic exercise or toning exercise in a large sample of healthy volunteers. We found that change in cardiovascular fitness was positively associated with changes in hippocampus glutamine, and negatively associated with change in glutamate in the anterior cingulate cortex; regardless of exercise group. This suggests that exercise-induced metabolic changes might not specific to the hippocampus, and that exercise likely has widespread effects on brain metabolism.
Introduction
Prolonged aerobic exercise has beneficial effects on cognition, but the underlying mechanisms are still unclear. Recent studies have pointed to an important role for neuronal metabolism. For example, high-intensity exercise has been associated with decreased Glx (glutamate+glutamine (Glu+Gln)) in the hippocampus1,2, a brain area characterized by prominent plasticity which plays an important role in cognition. So far, it is unknown whether these changes are limited to the hippocampus and whether only aerobic exercise can induce such changes. In this work, we present the first 7T MRS exercise study investigating neurometabolite concentrations before and after randomization to an aerobic exercise or resistance training in a large sample of healthy volunteers. We focused on Glu, Gln, glutathione (GSH) and N-acetyl aspartate (NAA) as metabolites of interest due to their role in neuronal activity and viability3.Methods
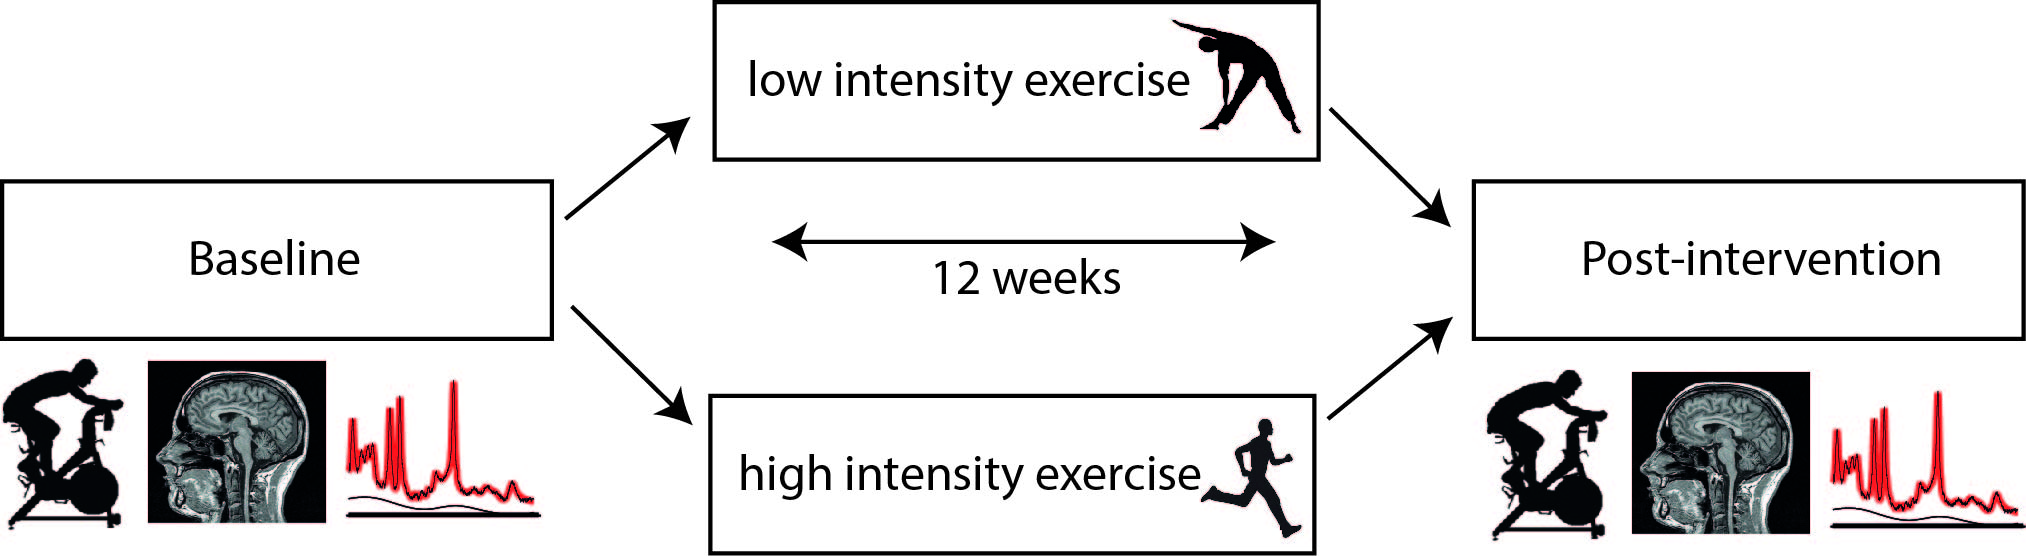
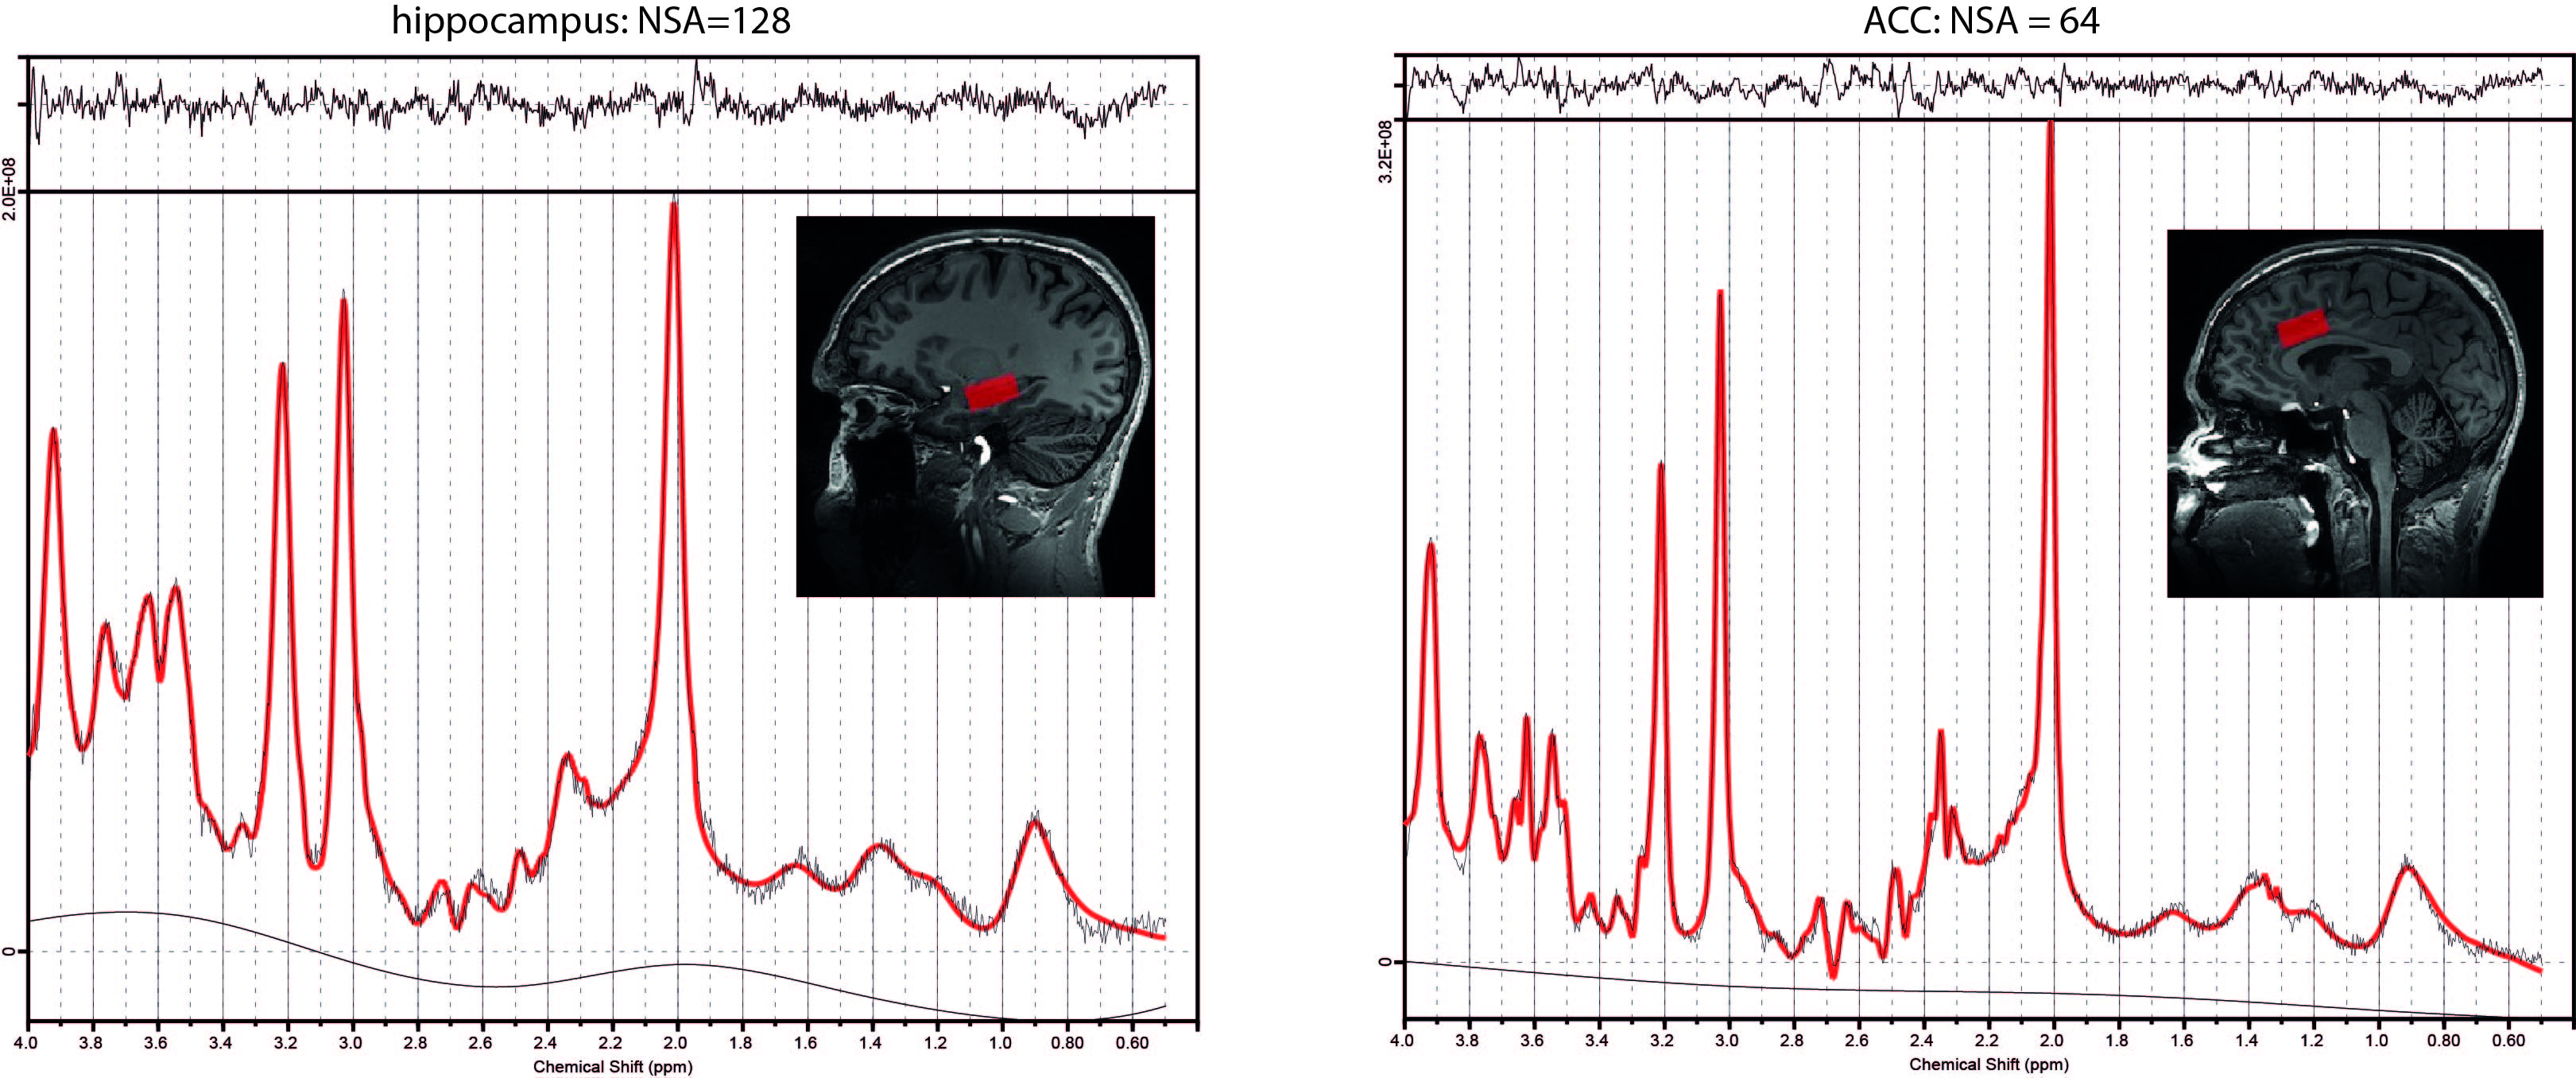
Fifty-two sedentary volunteers were randomized to 12 weeks of high or low intensity exercise (Figure 1)4. Before and after the intervention, subjects performed a maximal exercise test to obtain VO2max (reflecting cardiovascular fitness), and underwent MR and cognitive measurements. Single-voxel spectra were collected from the left hippocampus and dorsal anterior cingulate cortex (dACC) (Figure 2). Subjects were scanned on a 7T whole-body MR system (Philips) using a dual-channel transmit coil in combination with a 32-channel receive coil (Nova Medical) with a sLASER sequence using FOCI pulses5. Other sequence parameters were: TR/TE=5000/36ms; bandwidth=4kHz; 2048 data-points; voxel-size=30x15x15mm, NSAdACC=64 NSAhippocampus=128, B1>17µT. Non-water suppressed spectra were obtained for quantification and eddy-current correction. T1-weighted scans (0.83x0.83x0.9mm) were acquired and segmented using SPM to determine the contribution of gray matter, white matter and CSF to each voxel. Spectral fitting was performed using LCModel6. Metabolite concentrations were calculated using water-scaling and were corrected for partial volume effects using the tissue volume fractions7: $$[metabolite]=\frac{\frac{signal_{metabolite}}{signal_{H_{2}O}}*(volGM*[{H_{2}O}_{GM}]+volWM*[{H_{2}O}_{WM}]+volCSF*[{H_{2}O}_{CSF}])}{volGM+volWM}$$ Spectral quality measures, i.e. signal-to-noise ratio (SNRhippocampus>15; SNRACC>30) and Cramér–Rao lower bounds (CRLBGln≤40, CRLBGlu≤15, CRLBGSH≤15, CRLBNAA≤5) were used to exclude poor quality spectra. Repeated-measures ANOVA was used to test the interaction of exercise group and time. Pearson’s correlation coefficient was used to assess the association between VO2max and neurometabolite changes.Results
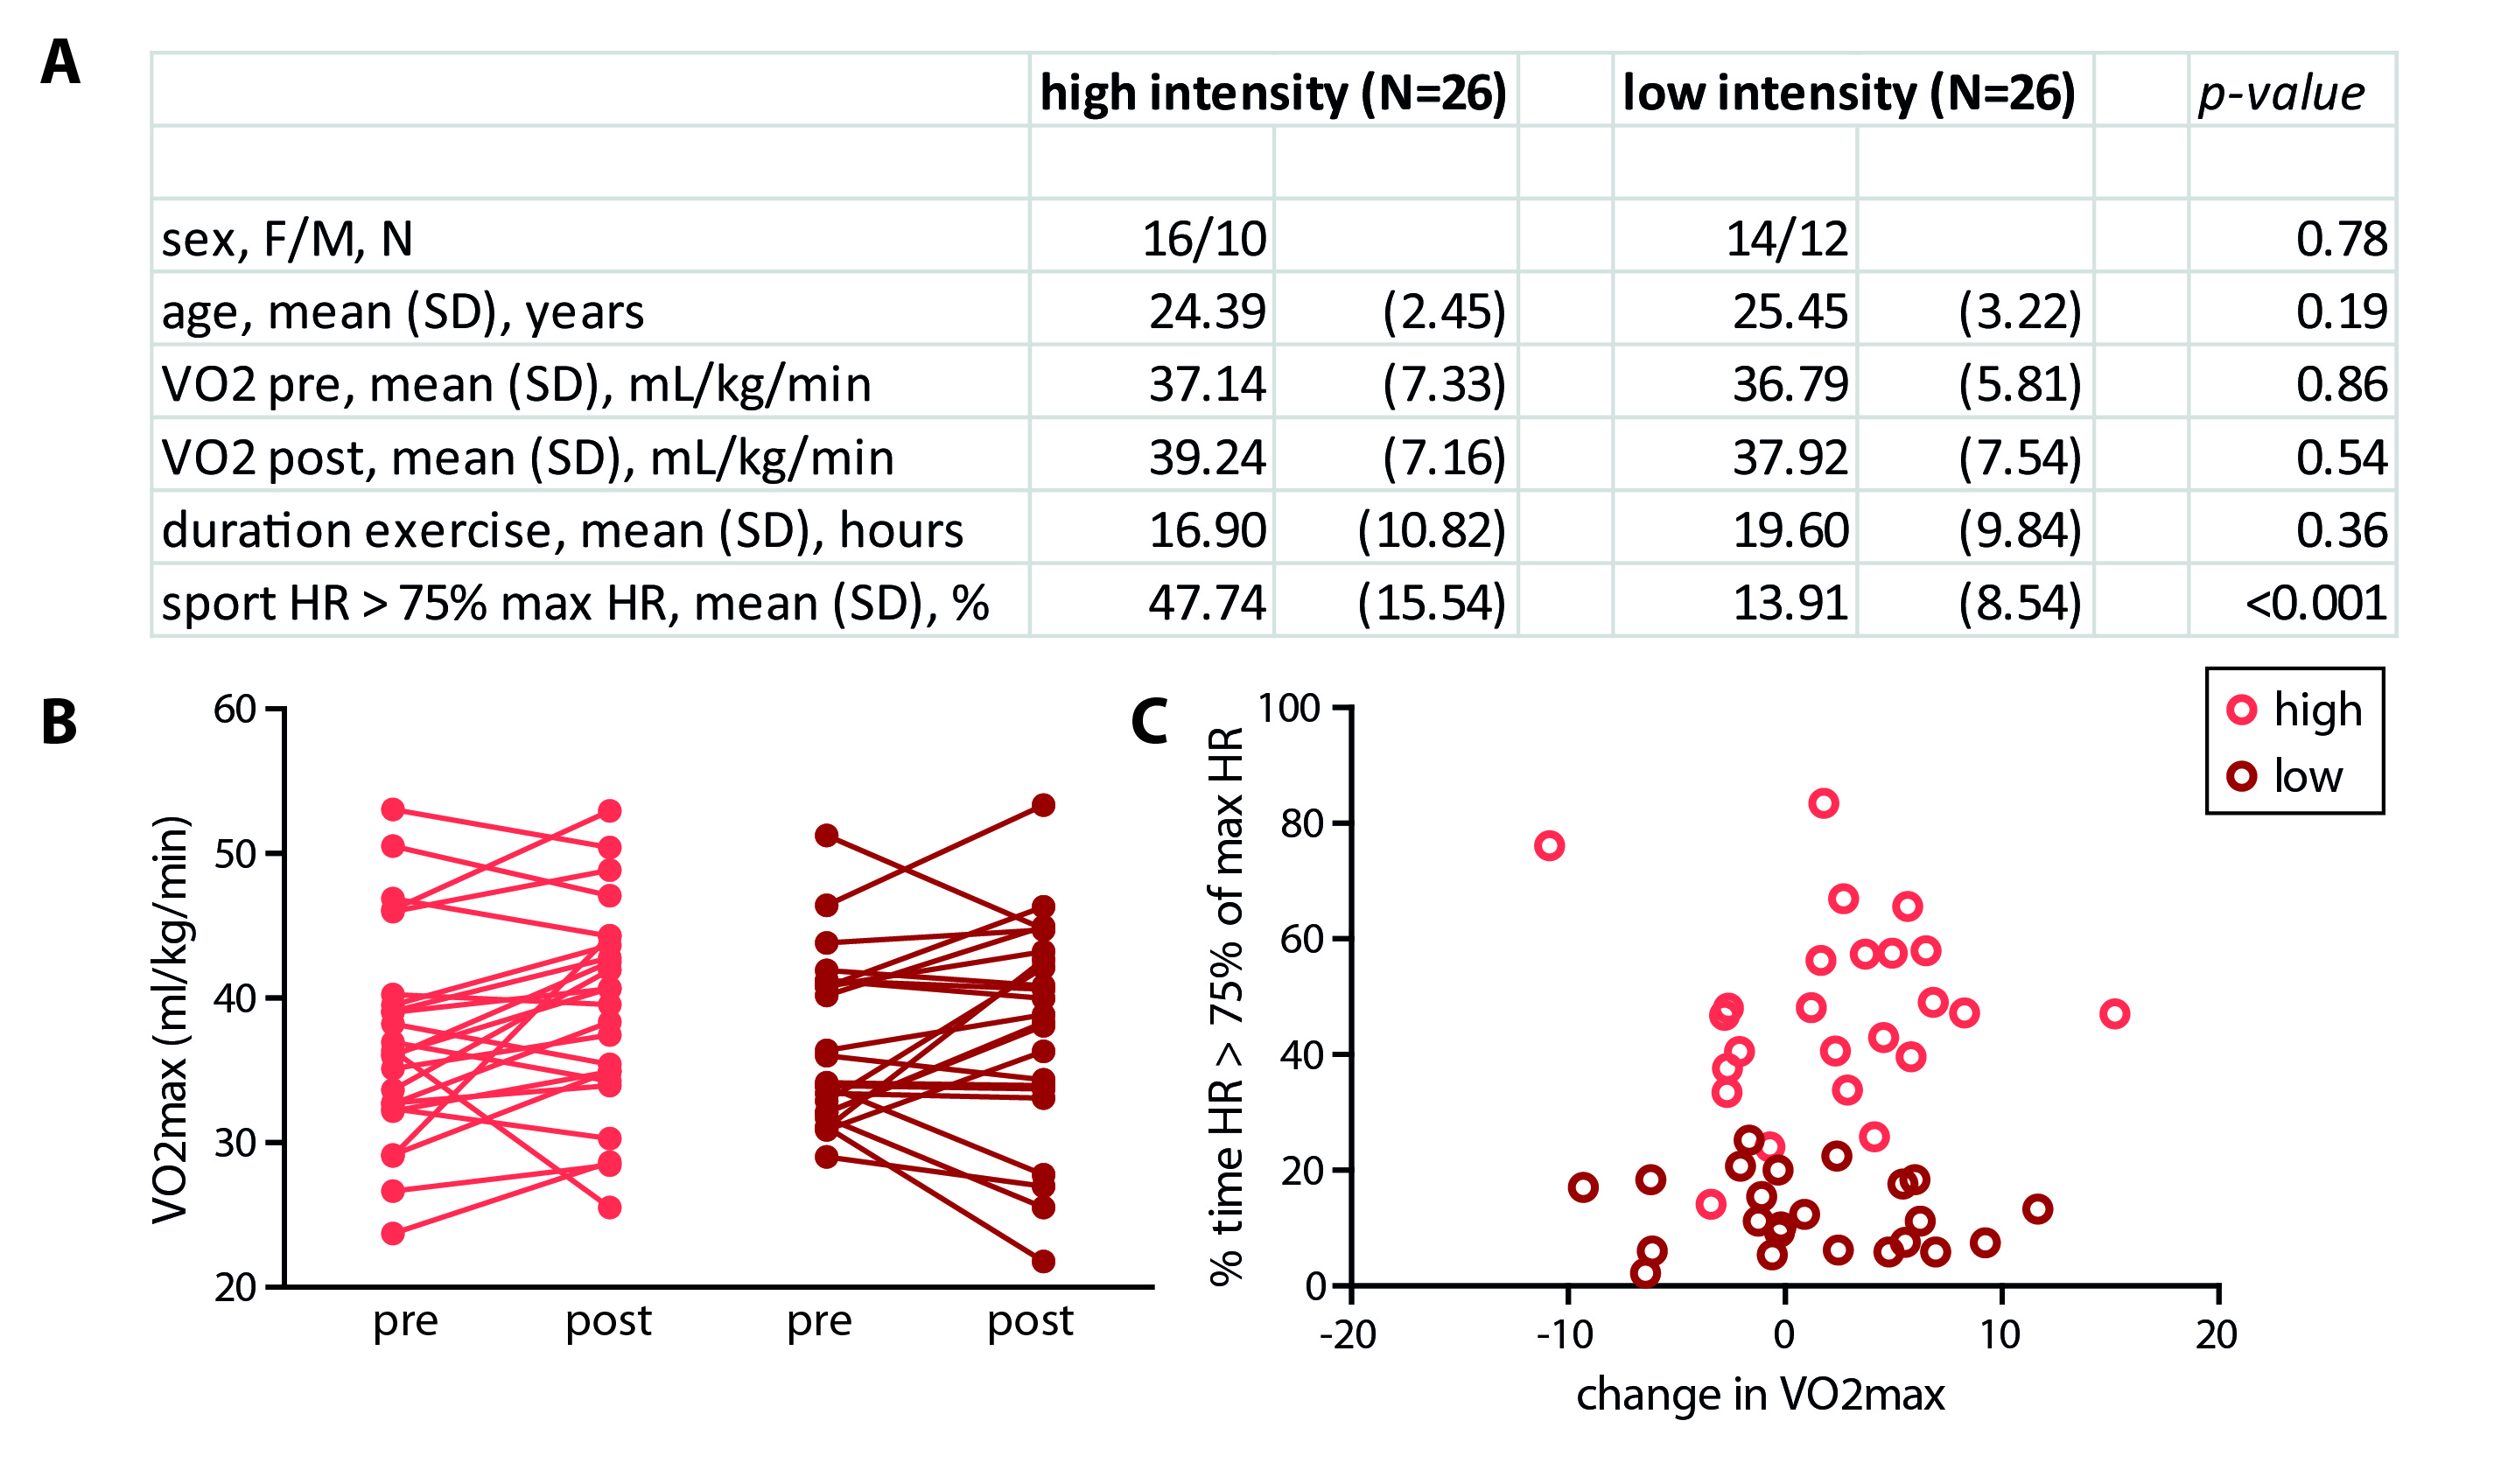
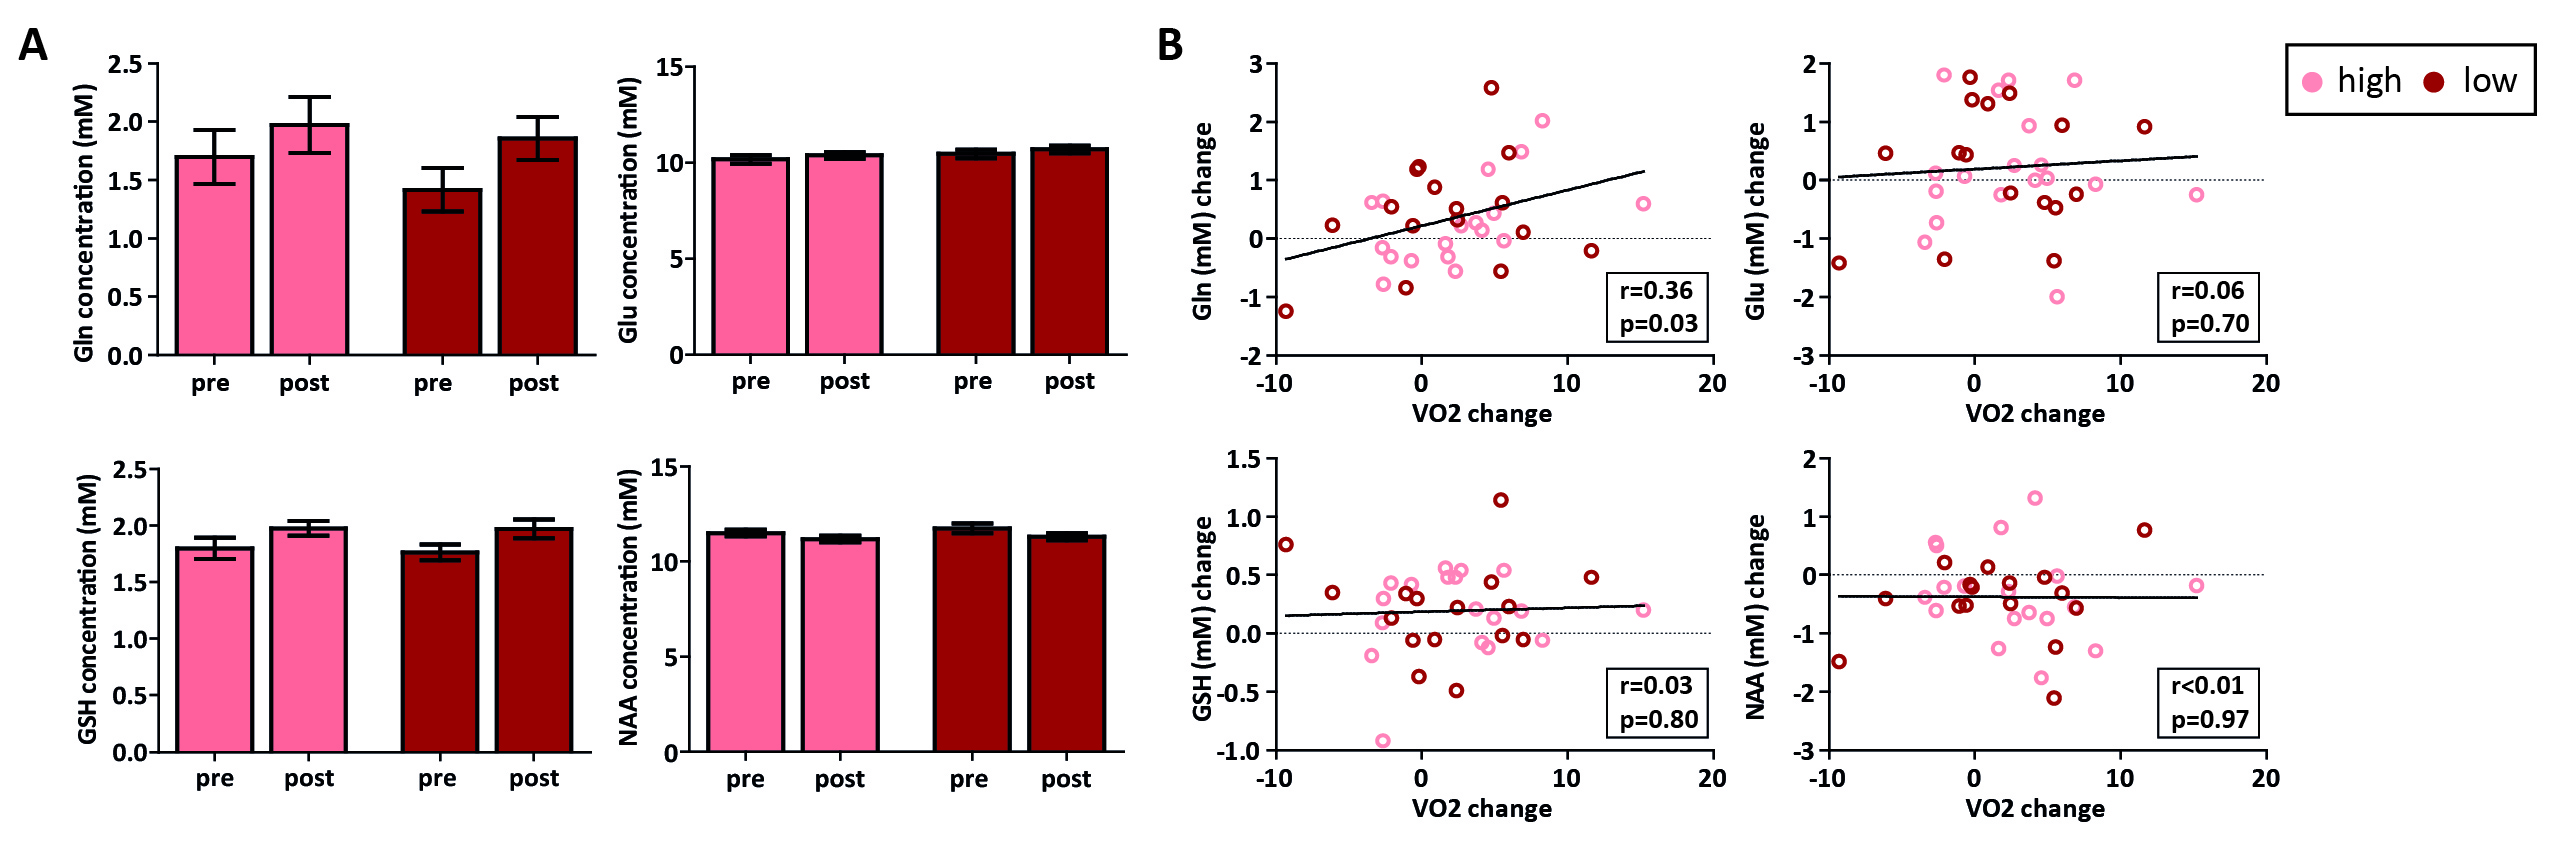
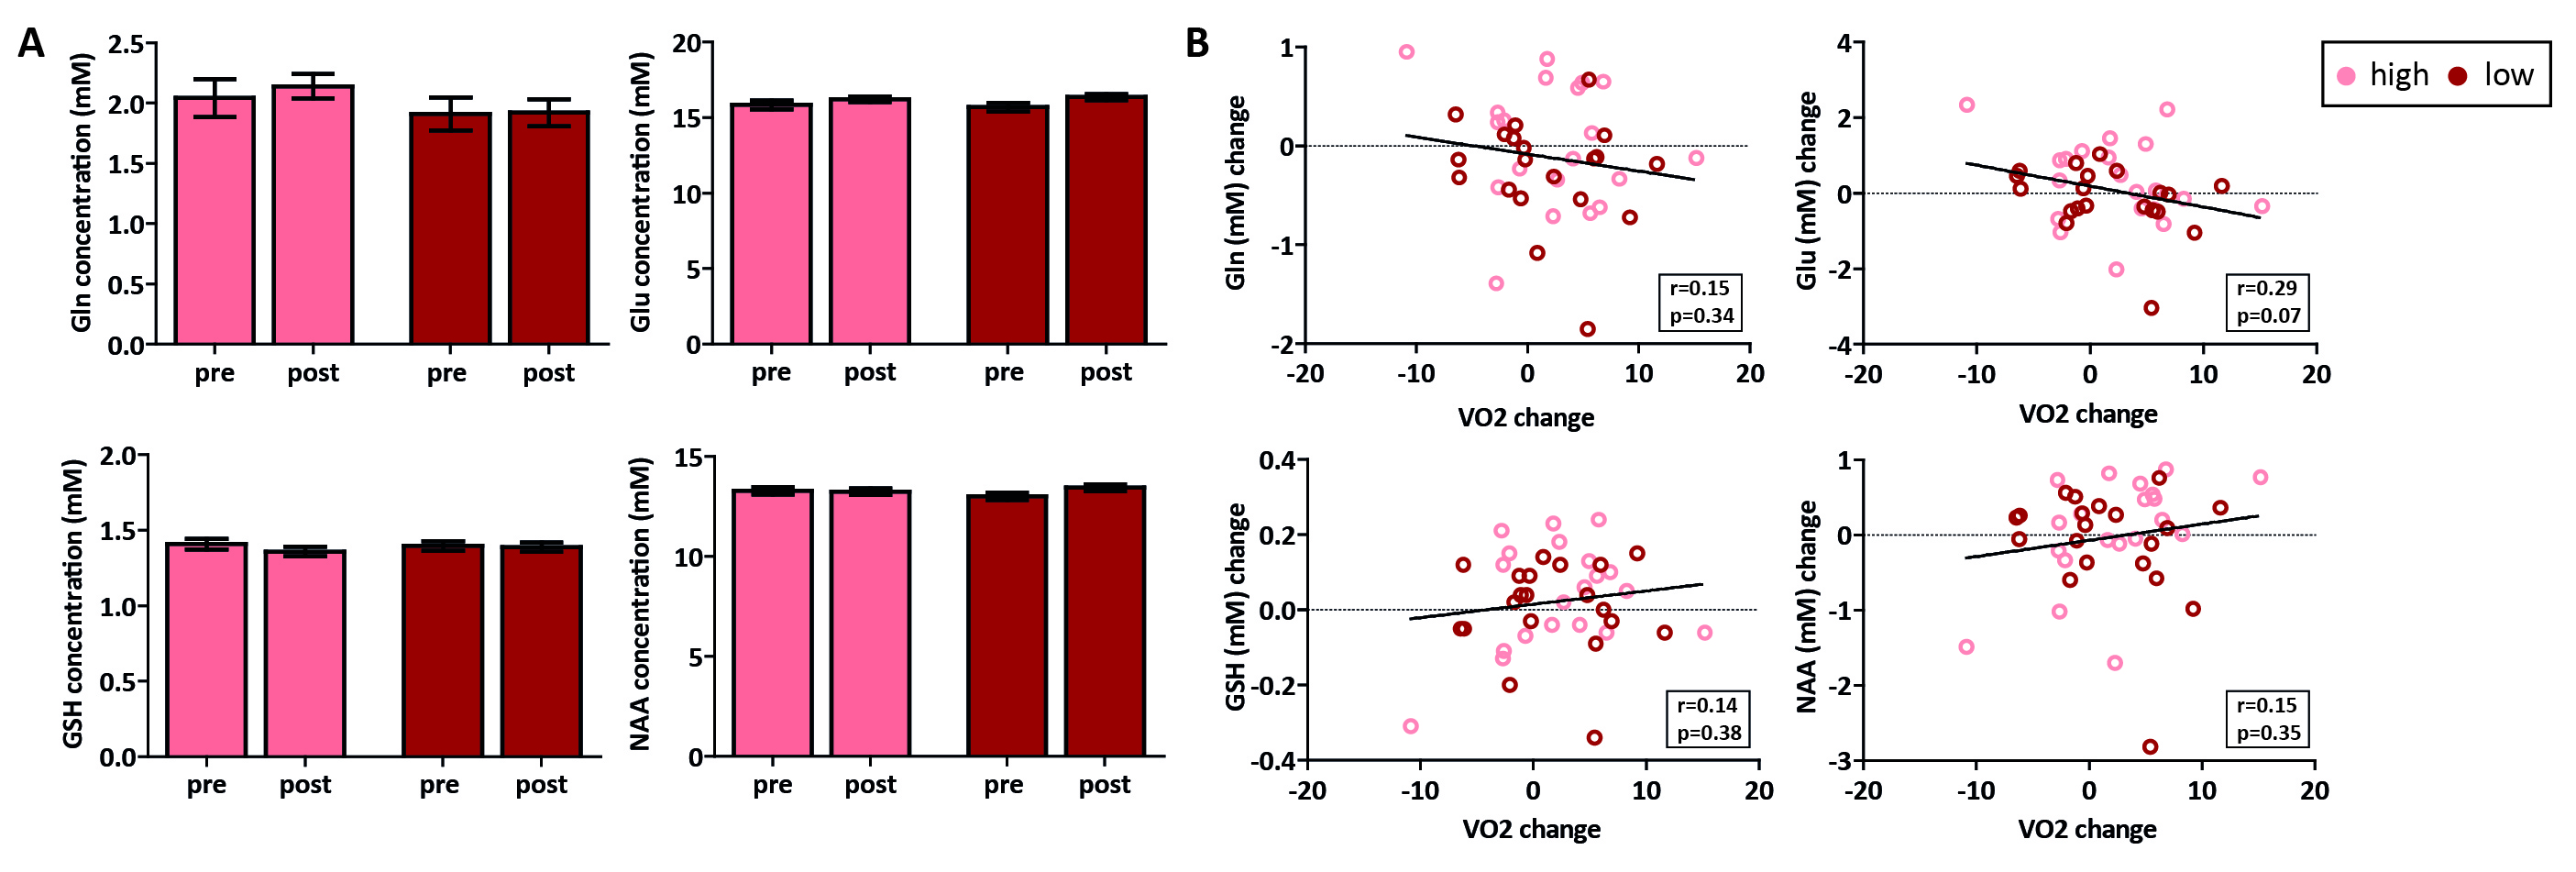
In total, 47 subjects (90%) successfully completed the intervention. We found a main effect of time on VO2max (p=0.04), but the high-intensity group did not show a larger increase than the low-intensity group (p=0.53) (despite having spent significantly more time in the target heart-rate zone (p<0.001)) (Figure 3). For the hippocampus (mean SNR=28) and ACC (mean SNR=44), respectively, 13 and 6 subjects had to be removed from the analysis due to 1 or 2 sessions having poor quality spectra. No significant interaction effect was found between time and group for any of the metabolites in the hippocampus. A main effect of time was found for Gln (p=0.02), GSH (p<0.01) and NAA (p<0.01), but not for Glu (p=0.22) (Figure 4). Additionally, when combining both exercise groups, the change in VO2max correlated with Gln change (r=0.36, p=0.03). For the ACC, we did not find an interaction or main effect (Figure 5). However, when combining both exercise groups, the VO2max change showed a trend-significant association with Glu (r=-0.29, p=0.07).Discussion
In contrast to some prior studies8, aerobic exercise did not induce significantly higher changes in VO2max than toning exercise. This might be due to the general fitness of young healthy volunteers compared to previously studied elderly populations. This might partially explain the lack of effect of exercise group on neurometabolites. When combining both groups, we showed a significant positive association between changes in cardiovascular fitness (VO2max) and Gln levels in the hippocampus, but a trend towards a negative association between changes in cardiovascular fitness and Glu in the ACC. Total Glu and Gln tend to be strongly coupled in healthy tissue3, and this correlation was stronger in the ACC (r=0.65, p<0.01) than the hippocampus (r=0.20, p=0.25) (Figure 4 and 5). This could either be due to true biological differences between the hippocampus and ACC, or this discrepancy could be due to lower SNR and higher CRLB’s in hippocampus than ACC. However, the exact meaning of increased Gln and decreased Glx in relation to exercise is difficult to interpret. In conclusion, we here presented the largest human exercise MRS study so far, showing the possibility to resolve both Glu and Gln using 7T MRS. Our results suggest that exercise-induced metabolic changes might not specific to the hippocampus, and that exercise likely has a widespread effect on brain metabolism.Acknowledgements
No acknowledgement found.References
1 Wagner, G., et al. (2015) Hippocampal structure, metabolism, and inflammatory response after a 6-week intense aerobic exercise in healthy young adults: a controlled trial. JCBFM, 35(10): 1570-1578
2 Biedermann, S.V., et al. (2012) In vivo voxel based morphometry: Detection of increased hippocampal volume and decreased glutamate levels in exercising mice. NeuroImage 61:1206–1212
3 Rae C.D. (2014). Guide to the metabolic pathways and function of metabolites observed in human brain 1H magnetic resonance spectra. Neurochem Res, 39(1):1-36
4 Bacon, A., et al. (2013) VO2max Trainability and High Intensity Interval Training in Humans: A Meta-Analysis. PlosOne, 8(9): e73182
5 Arteaga de Castro, C.S., et al. (2013). Improved efficiency on editing MRS of lactate and gamma-aminobutyric acid by inclusion of frequency offset corrected inversion pulses at high fields. NMR Biomed, 26(10):1213-1219.
6 Bhogal, A.A., et al. (2017) 1 H-MRS processing parameters affect metabolite quantification: The urgent need for uniform and transparent standardization. NMR Biomed, 30(11): e3804
7 Gasparovic, C., et al. (2009) Quantitative spectroscopic imaging with in situ measurements of tissue water T1, T2, and density. Magn Reson Med, 62:583-590
8 Brickman, A., et al. (2014). Enhancing dentate gyrus function with dietary flavanols improves cognition in older adults. Nat Neurosci, 17(12):1798-803.
Figures