4017
Oxidative Stress and Neurotransmitters Imbalance in Amyotrophic Lateral SclerosisMona Adel Mohamed1, Muhammad Saleh1, Mark Mikkelsen 1, Kristen Riley2, Jeffrey Rothstein2, Lora Clawson2, Peter B Barker1, and Richard AE Edden1
1Radiology, Johns Hopkins Medical Institutions, Baltimore, MD, United States, 2Neurology, Johns Hopkins Medical Institutions, Baltimore, MD, United States
Synopsis
Amyotrophic lateral sclerosis (ALS) is a rapidly progressive and invariably fatal motor neuron disease. The objective of the study was to use the newly developed HERMES (Hadamard Encoding and Reconstruction of MEGA-Edited Spectroscopy) spectral editing methodology to simultaneously measure key compounds related to oxidative stress and glutamatergic metabolism (GSH, GABA, and Glx) in patients with ALS and control subjects. Using HERMES, we were able to look at different metabolic pathways in ALS in one MRS session. Improved understanding of the various metabolic pathways in ALS will lead to the development of new diagnostic surrogate markers and therapeutic approaches.
INTRODUCTION:
Amyotrophic lateral sclerosis (ALS) is a rapidly progressive and invariably fatal motor neuron disease that affects the nerve cells along the descending corticospinal tract responsible for controlling voluntary muscles. There is no definite cause or diagnostic test for ALS. 5–10% of cases are familial or hereditary. 90–95% of sporadic cases have an unclear etiology. More than 5000 people are diagnosed with ALS each year in the USA. It has a markedly heterogeneous clinical presentation and progression. Prior animal models, in vitro, post mortem 1-6 and MRS studies 7-12 suggest that oxidative stress and imbalance of the glutamatergic system (glutamate neurotoxicity) play major roles in ALS pathogenesis. Furthermore, apart from riluzole’s modest benefit, there is no effective drug to treat ALS. The objective of the study was to use the newly developed HERMES (Hadamard Encoding and Reconstruction of MEGA-Edited Spectroscopy) 13 spectral editing methodology to simultaneously measure key compounds related to oxidative stress and glutamatergic metabolism (GSH, GABA, and Glx) in patients with ALS and control subjects.Methods
Nine patients with ALS (61 ± 8 years; 5 males) and 5 healthy controls (55 ± 9 years; 2 males) underwent MRI and HERMES MRS at 3T (Philips Achieva, 32-channel head coil). 3 brain regions of interest along the descending motor pathway tract were evaluated: (a) the motor area (M1), (b) corticospinal white matter (WM) and (3) the midbrain (MB) covering the cerebral peduncles (Figure 1). HERMES was used to edit the antioxidant glutathione (GSH), the excitatory neurotransmitter glutamate (Glu), and the inhibitory neurotransmitter γ-aminobutyric acid (GABA+). The editing pulse frequencies are 1.9 and 4.56 ppm for editing GABA and GSH, respectively. Scan parameters were 320 averages (~13 minutes) per voxel, ~18 cm3 voxel size, 20 ms editing pulse duration, TE = 80 ms, TR = 2.5 s. Total scan time ~60 minutes. The Gannet program 14 was modified to incorporate post-processing and quantitative analysis of HERMES data (Figure 2, 3, 4). The metabolites concentrations were quantified relative to water.RESULTS:
In M1, ALS patients showed higher mean GABA+, GSH and Glx as compared to controls (Figure 5). When comparing controls vs. patients, the mean (± SD) for GABA+ was 1.03 ± 0.23 vs. 1.05 ± 0.37 I.U.; GSH was 0.42 ± 0.17 vs. 0.63 ± 0.27; Glx was 0.52 ± 0.11 vs. 0.56 ± 0.12 I.U. respectively. None of the metabolites reached statistical significance. In WM, ALS patients showed lower mean GABA+ and Glx but higher GSH than controls (Figure 5). When comparing controls vs. patients, GABA+ was 1.29 ± 0.50 vs. 0.9 ± 0.3; GSH was 0.69 ± 0.28 vs. 0.75 ± 0.32; Glx was 0.51 ± 0.07 vs. 0.48 ± 0.08 I.U. respectively. None of the metabolites reached statistical significance. MB was unquantifiable.Discussion:
Simultaneous measurements of GSH, GABA+, and Glx, in vivo were feasible in ALS patients in 3 brain regions in a total scan time of 1 hour. Good signal intensities of the 3 metabolites in M1 and WM were observed. In agreement with other studies 10, 11, we found increased Glx in M1 in ALS patients; however, unlike prior MRS studies 7, 12, we found increased Glu and GSH in M1 of ALS compared to controls. None of our comparisons showed statistical significance owing to our small sample size. Without HERMES, this study would have required multiple scanning sessions for the same subject. Using HERMES, we were able to look at different metabolic pathways in ALS in one MRS session. Being close to bone and pulsations, the midbrain’s (MB) data was not quantifiable and needs future protocol optimization.Conclusion:
Numerous brain metabolites participate in interdependent metabolic pathways, which should be explored simultaneously at the same time point. Improved understanding of the various metabolic pathways in ALS will lead to the development of new diagnostic surrogate markers and therapeutic approaches.Acknowledgements
This work supported in part by the Gatewood award, Yousem award, NIH grants: R21MH087799 (MAM), P41EB015909 (PBB/RAEE) and RO1EB016089 (RAEE).References
1. Rosen DR, Siddique T, Patterson D, et al. Mutations in Cu/Zn superoxide dismutase gene are associated with familial amyotrophic lateral sclerosis. Nature. 1993; 362(6415):59-62. 2. Howland DS, Liu J, She Y, et al. Focal loss of the glutamate transporter EAAT2 in a transgenic rat model of SOD1 mutant-mediated amyotrophic lateral sclerosis (ALS). Proceedings of the National Academy of Sciences of the United States of America. 2002; 99(3):1604-9. 3. Pardo AC, Wong V, Benson LM, et al. Loss of the astrocyte glutamate transporter GLT1 modifies disease in SOD1 (G93A) mice. Experimental neurology. 2006; 201(1):120-30. 4. Tanaka K, Kanno T, Yanagisawa Y, et al. Bromocriptine methylate suppresses glial inflammation and moderates disease progression in a mouse model of amyotrophic lateral sclerosis. Experimental neurology. 2011; 232(1):41-52. 5. Rothstein JD, Martin LJ, Kuncl RW. Decreased glutamate transport by the brain and spinal cord in amyotrophic lateral sclerosis. The New England journal of medicine. 1992; 326(22):1464-8. 6. Maragakis NJ, Dykes-Hoberg M, Rothstein JD. Altered expression of the glutamate transporter EAAT2b in neurological disease. Annals of neurology. 2004; 55(4):469-77. 7. Atassi N, Xu M, Triantafyllou C, et al. Ultra high-field (7 tesla) magnetic resonance spectroscopy in Amyotrophic Lateral Sclerosis. PloS one. 2017; 12(5):e0177680. 8. Wang H, Yi J, Li X, et al. ALS-associated mutation SOD1G93A leads to abnormal mitochondrial dynamics in osteocytes. Bone. 2017; 106:126-38. 9. Foerster BR, Callaghan BC, Petrou M, et al. Decreased motor cortex gamma-aminobutyric acid in amyotrophic lateral sclerosis. Neurology. 2012; 78(20):1596-600. 10. Turner MR, Agosta F, Bede P, et al. Neuroimaging in amyotrophic lateral sclerosis. Biomarkers in medicine. 2012; 6(3):319-37. 11. Foerster BR, Carlos RC, Dwamena BA, et al. Multimodal MRI as a diagnostic biomarker for amyotrophic lateral sclerosis. Annals of clinical and translational neurology. 2014; 1(2):107-14. 12. Weiduschat N, Mao X, Hupf J, et al. Motor cortex glutathione deficit in ALS measured in vivo with the J-editing technique. Neuroscience letters. 2014; 570:102-7. 13. Saleh MG, Oeltzschner G, Chan KL, et al. Simultaneous edited MRS of GABA and glutathione. NeuroImage. 2016; 142:576-82. 14. Edden RA, Puts NA, Harris AD, et al. Gannet: A batch-processing tool for the quantitative analysis of gamma-aminobutyric acid-edited MR spectroscopy spectra. Journal of magnetic resonance imaging: JMRI. 2014; 40(6):1445-52.Figures
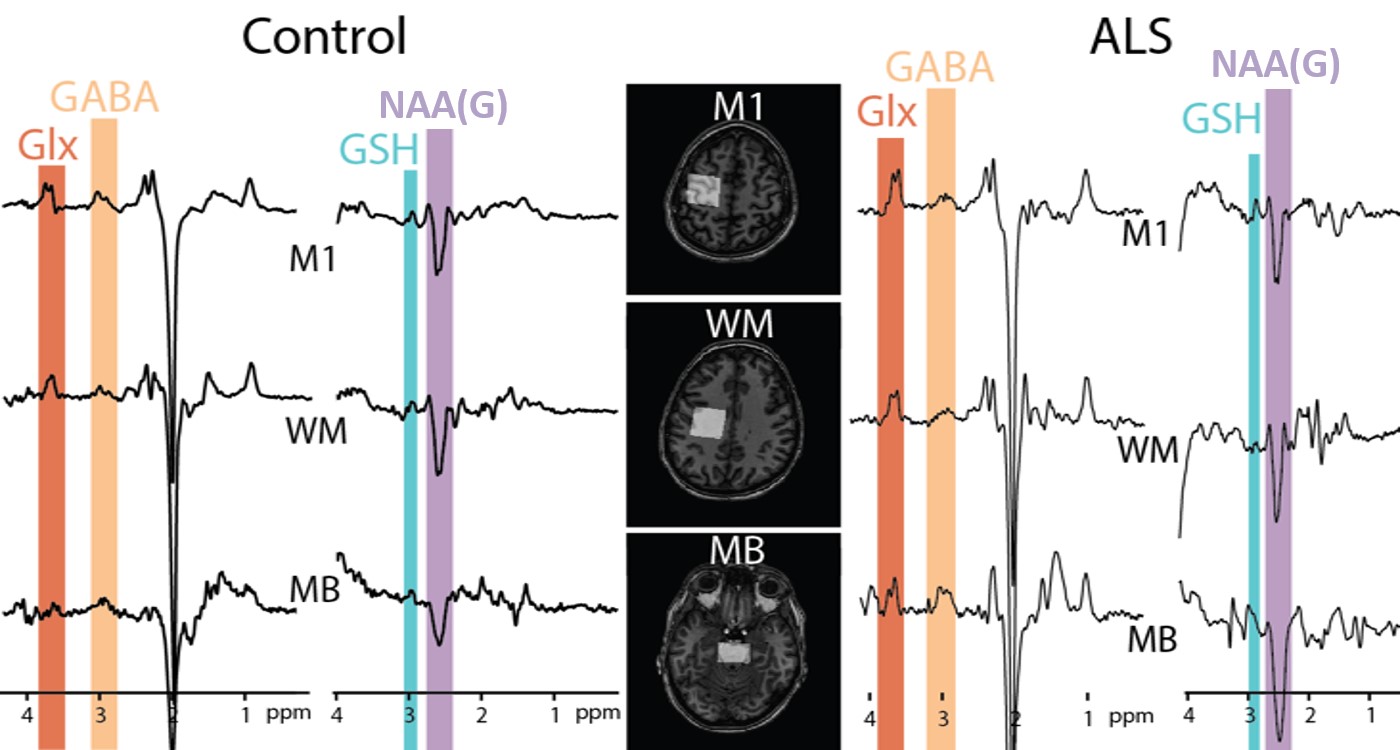
Figure
1: Example HERMES data acquired in motor
cortex (M1), corticospinal white matter (WM) and mid-brain (MB) of a 40-year-old healthy control (left) and
69-year-old ALS patient (right).
Edited signals from Glx, GABA+, GSH and N acetyl aspartate glutamate (NAAG)
are highlighted.
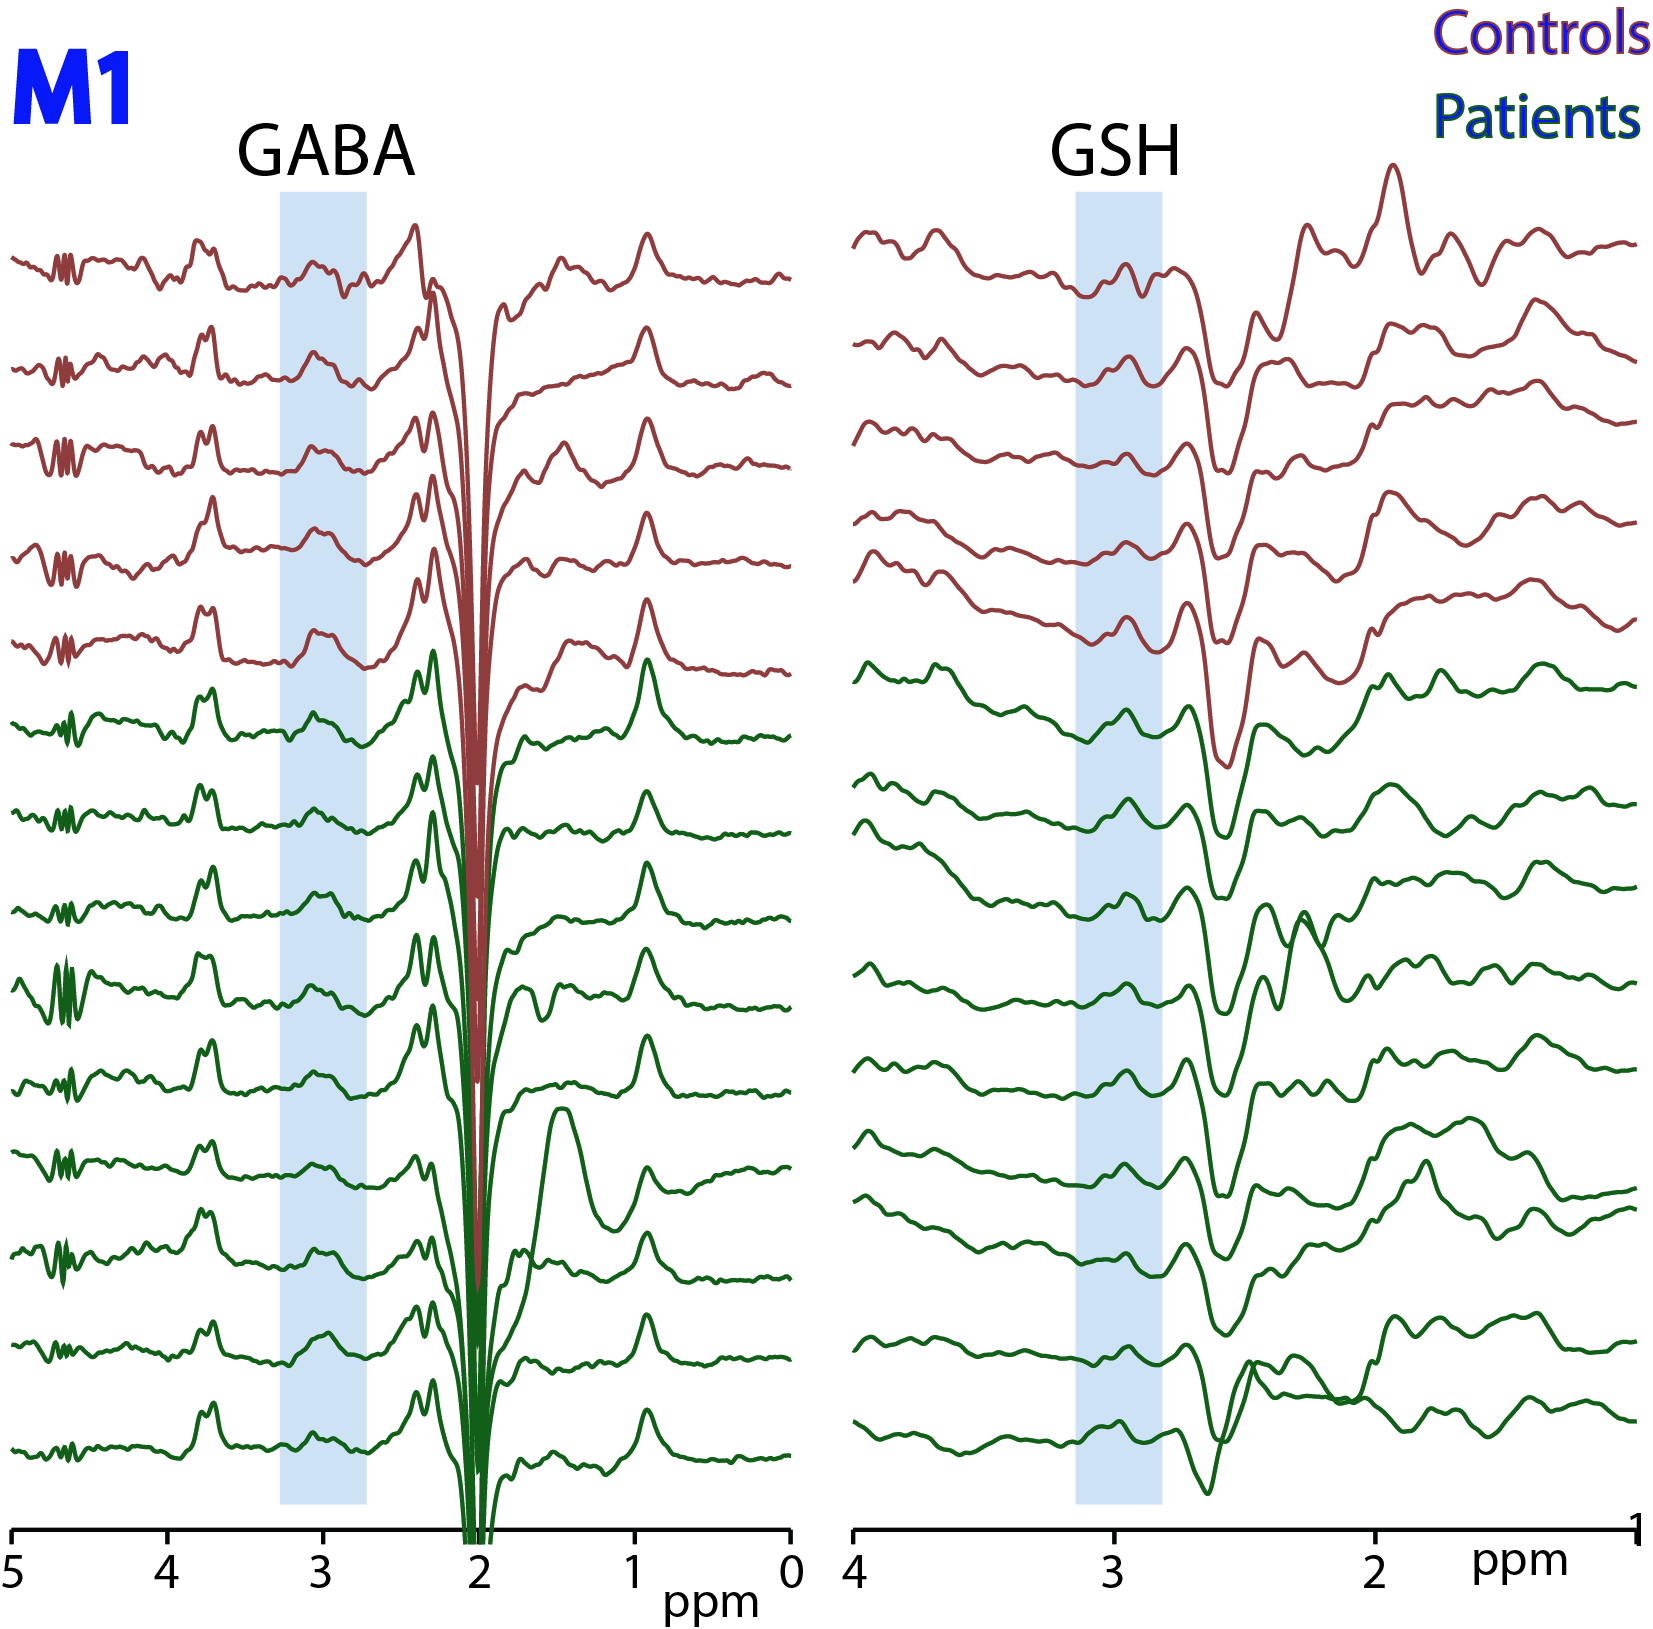
Figure
2: HERMES
data acquired in motor cortex (M1) in 5 controls and 9 ALS subjects. Edited
signals from GABA+ and GSH are highlighted.

Figure
3: HERMES data acquired in white matter
(WM) in 5 controls and 9 ALS subjects. Edited signals from GABA+ and GSH are
highlighted.
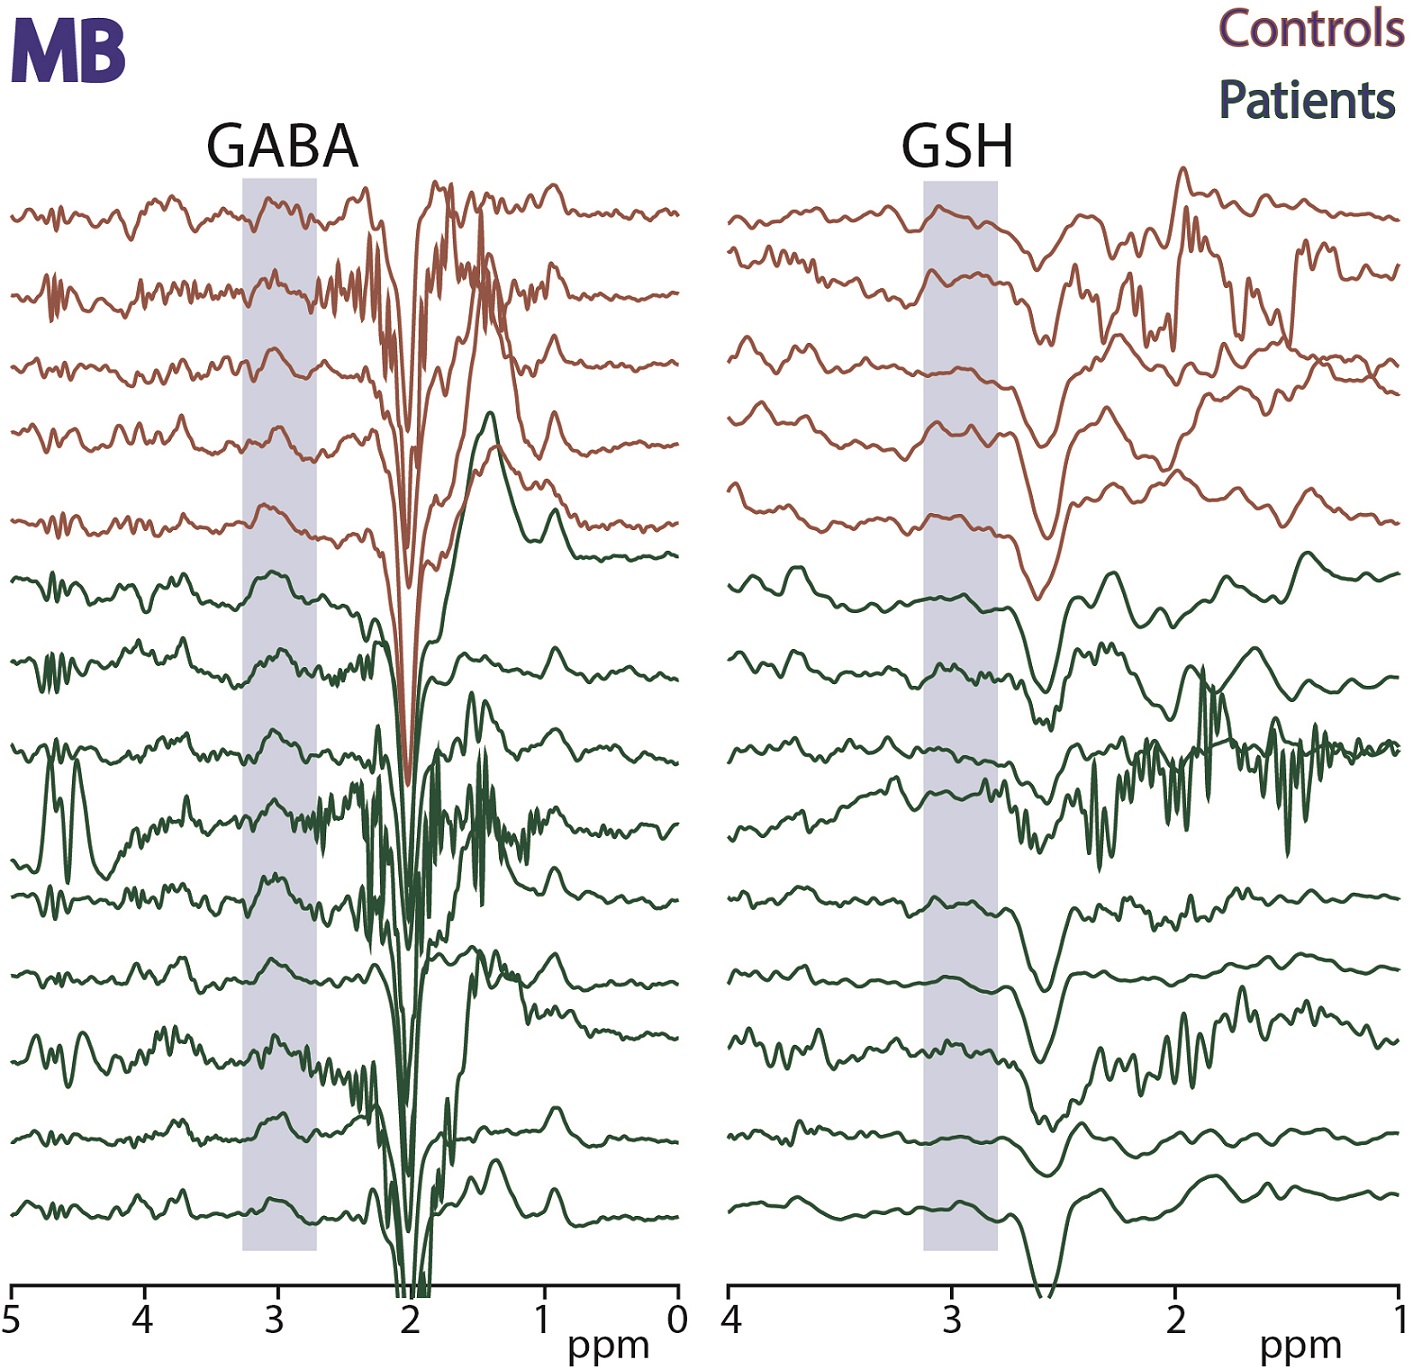
Figure
4: HERMES data acquired in midbrain
(MB) in 5 controls and 9 ALS subjects. Edited signals from GABA+ and GSH are
highlighted.
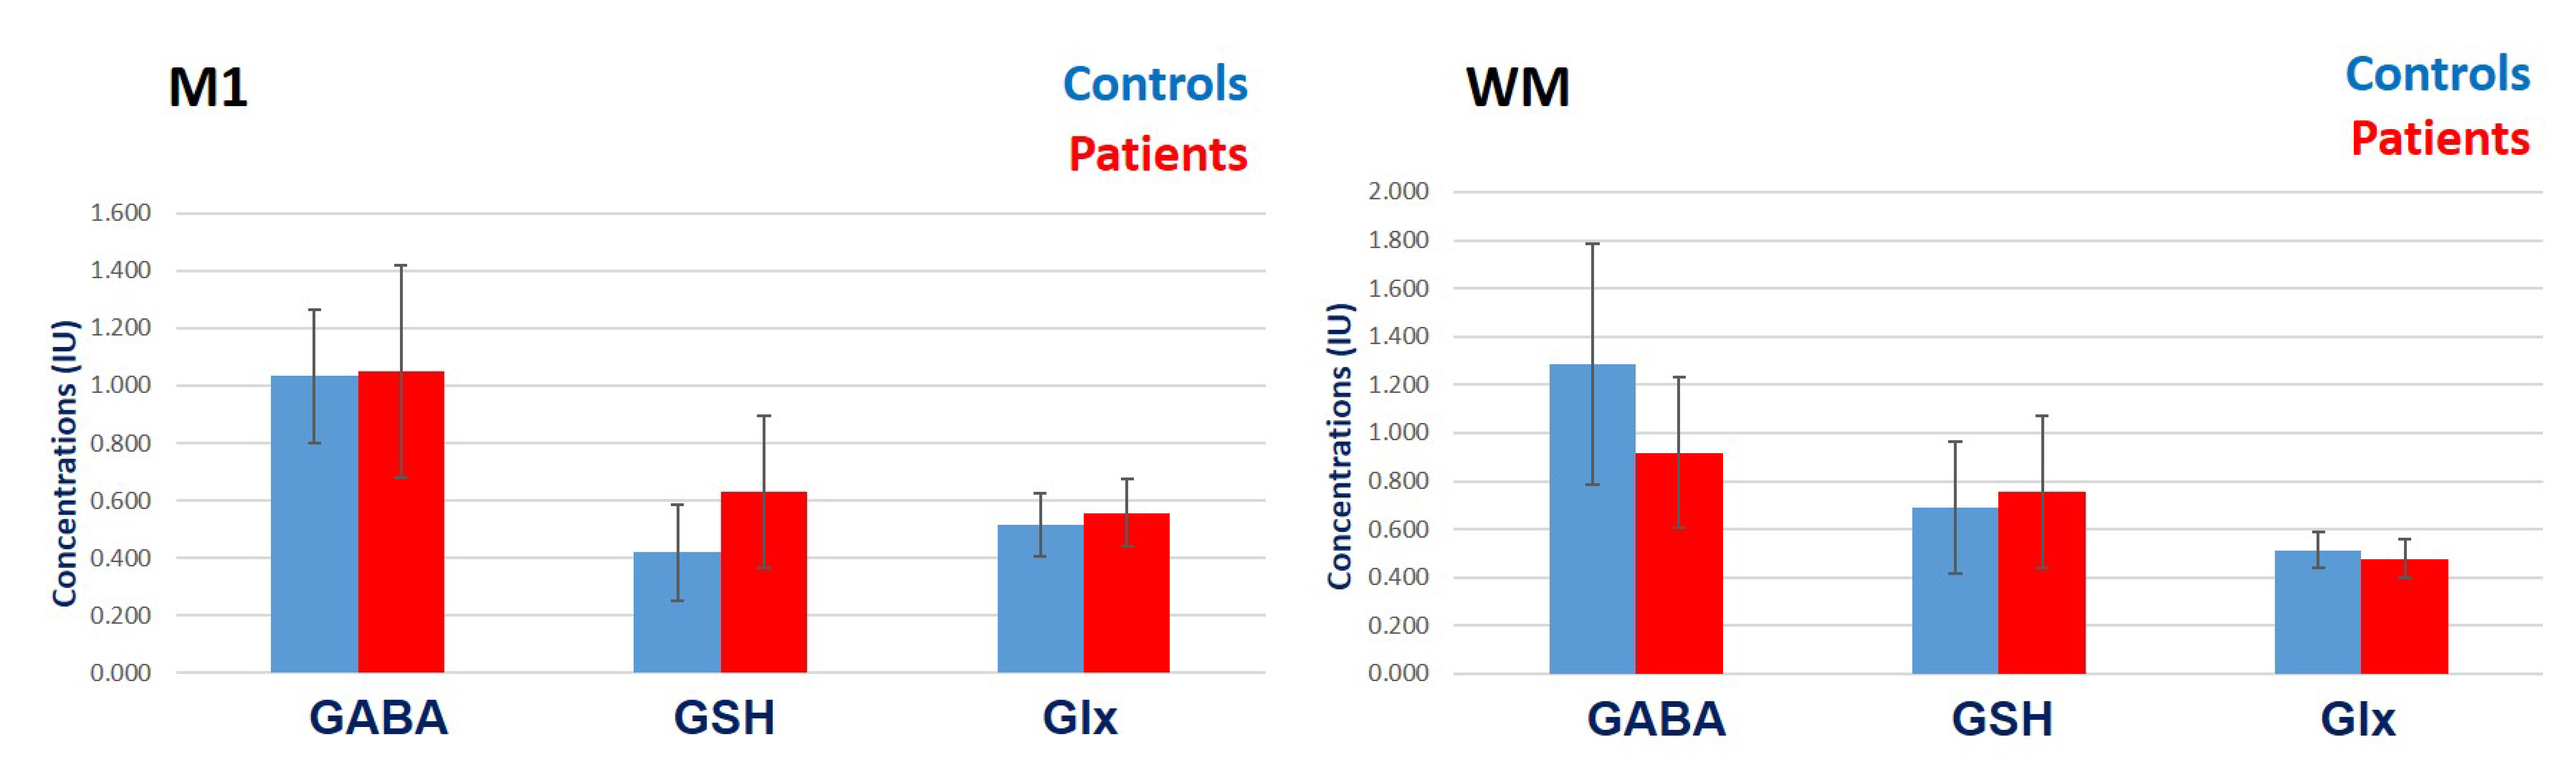
Figure 5: Mean (± 1 SD) GABA+, GSH
and Glx concentrations in M1 and WM of ALS patients and controls.