4015
Determination of the metabolome of Giardia lamblia by 1H Magic Angle Spinning NMR1Department of Chemistry and Biochemistry, University of Bern, Bern, Switzerland, 2Institute of Parasitology, University of Bern, Bern, Switzerland, 3epartments for BioMedical Research and Radiology, University of Bern, Bern, Switzerland
Synopsis
The intestinal protozoan parasite Giardia lamblia is a major cause of persistent diarrhea in humans and animals worldwide. Details concerning underlying metabolic pathways in Giardia are scarce and a methodology to study giardial intermediary and energy metabolism is required. Here, a high resolution magic angle spinning (HR-MAS) NMR study is presented determining the metabolic profile of G. lamblia trophozoites. This study builds the basis of following investigations on Giardia that are resistant against Metronidazole and other nitro compounds, which have been used since decades as therapy of choice against giardiasis.
Introduction
The intestinal protozoan parasite Giardia lamblia is a major cause of persistent diarrhea in humans and animals worldwide. Sequencing of the genome revealed prokaryote-like features such as short promoter sequences, a nearly complete absence of introns and high similarities of some key enzymes of energy and intermediate metabolisms with prokaryotic enzymes (1) suggesting an acquisition by lateral transfer (2). The energy metabolism is chemoheterotrophic and – due to the absence of mitochondria – fully anaerobic yielding ethanol, acetic acid and alanine as fermentation end products, as determined by 1H-NMR (3). Details concerning underlying metabolic pathways are scarce and a methodology to study giardial intermediary and energy metabolism is required.
Here, we present a HR-MAS NMR study in order to study the metabolic profile of G. lamblia trophozoites.
METHODS
Preparation of cell samples:
G. lamblia trophozoites were grown to confluence in modified TYI-S33 medium and harvested by chilling on ice. After centrifugation, trophozoites were washed with ice-cold D2O-based PBS and shock frozen in liquid nitrogen. All samples were stored at -70 °C until further analysis.
NMR Spectroscopy:
Each sample was thawed immediately before HR-MAS. Cell sample suspensions were filled into ZrO-HR-MAS rotors. 1H HR-MAS NMR experiments were performed on a 500MHz Bruker Avance II spectrometer at 3kHz and 279K using a 1D-PROJECT pulse sequence (4) with water presaturation. To support resonance assignments, 2D 1H1H-TOCSY spectra were recorded. Spectral processing included exponential multiplication (1Hz line broadening), FFT, phasing, and baseline correction. All spectra were calibrated to the g-CH3 resonance of threonine at 1.326 ppm.
RESULTS
The 1H HR-MAS NMR spectrum of a suspension of Giardia trophozoites is shown in Fig.1 with resonance assignments based on 2D 1H1H TOCSY and comparison with reference spectral data bases. Most intense NMR resonances appear in the aliphatic spectral region between 0 ppm and 5 ppm (Figs. 1 B – D). In this region, various amino acids are the main contributors such as valine (Val), leucine (Leu), threonine (Thr), lysine (Lys), alanine (Ala), methionine (Met) glutamate (Glu), and glycine (Gly). Alanine gives rise to the most intense resonance with its doublet at 1.48 ppm assigned to the b-methyl group of Ala. Other intense TOCSY cross peaks could be attributed to the non-proteinogenic amino acid ornithine (Orn) with its 4 correlated proton resonances (Fig. 2). Another amino acid of this group, pipecolic acid, could be identified by its typical proton resonances and TOCSY correlations of the piperidine ring (Fig. 2) and was previously described to be produced by Giardia. Glucose-1-phosphate (G1P) was observed as very prominent component with its anomeric proton giving rise to a characteristic multiplet (doublet of doublet, dd) resonance at 5.45 ppm (5). However, this metabolite was found to be formed secondarily in the thawed samples before the first NMR measurement, i.e. within 10 to 15 minutes. G1P is most likely formed by enzymatic degradation of glycogen during sample preparation.
Concerning dinucleotides, only NAD could be detected suggesting very low levels of NADH and NADP(H). We determined these levels in confluent trophozoites using commercial kit systems and confirmed the results obtained with HR-MAS.
Ten independent shock-frozen samples of trophozoites harvested from confluent cultures were analyzed to determine reproducibility (quantile plots are shown in Figure 3). A very low variability was found for the whole spectral range.
DISCUSSION
In the current study, HR-MAS NMR spectroscopy was applied to directly analyse the profile of small metabolites from Giardia lamblia trophozoites in detail. A total of 31 components could be identified. In contrast to mammalian cells, lipids are completely lacking in Giardia. An intriguing fact is the presence of glucose-1-phosphate (G1P) in shock-frozen cells (but not in additionally heated cells, results not shown) and the increase during the time of incubation. Since Giardia trophozoites contain glycogen, the presence of G1P reflects glycogen degradation by glycogen phosphorylase during processing and subsequent analysis of the sample. Another compound potentially affecting the host identified in confluent trophozoites is trimethylamine (TMA). TMA released by decaying trophozoites may be absorbed and systemically distributed. Increased levels of TMA are associated with various chronical diseases. Moreover, TMA may be transformed into TMA-N-oxide which is associated with atherosclerosis via the activation of inflammatory pathways and the stimulation of foam cell formation.
CONCLUSION
In conclusion the metabolic profile of G. lamblia trophozoites was measured by HR-MAS NMR study and numerous metabolites could be assigned. This study builds the basis of following investigations on giardia that are resistant against Metronidazole and other nitro compounds, which have been used since decades as therapy of choice against giardiasis.
Acknowledgements
No acknowledgement found.References
1. Brown, D. M., Upcroft, J. A., Edwards, M. R., and Upcroft, P. Int J Parasitol 28, 149 (1998)
2. Morrison, H. G., McArthur, A. G., Gillin, et al. Science 317, 1921 (2007)
3. Edwards, M. R., Gilroy, F. V., Jimenez, B. M., and O'Sullivan, W. J. Mol Biochem Parasitol 37, 19 (1989)
4. Aguilar JA, Nilsson M, Bodenhausen G, et al. Chemical Communications 48, 811 (2012).
5. Diserens G, Vermathen M, Gjuroski I, Eggimann S, Precht C, Boesch C, Vermathen P. Anal Bioanal Chem. 408, 5651 (2016)
Figures
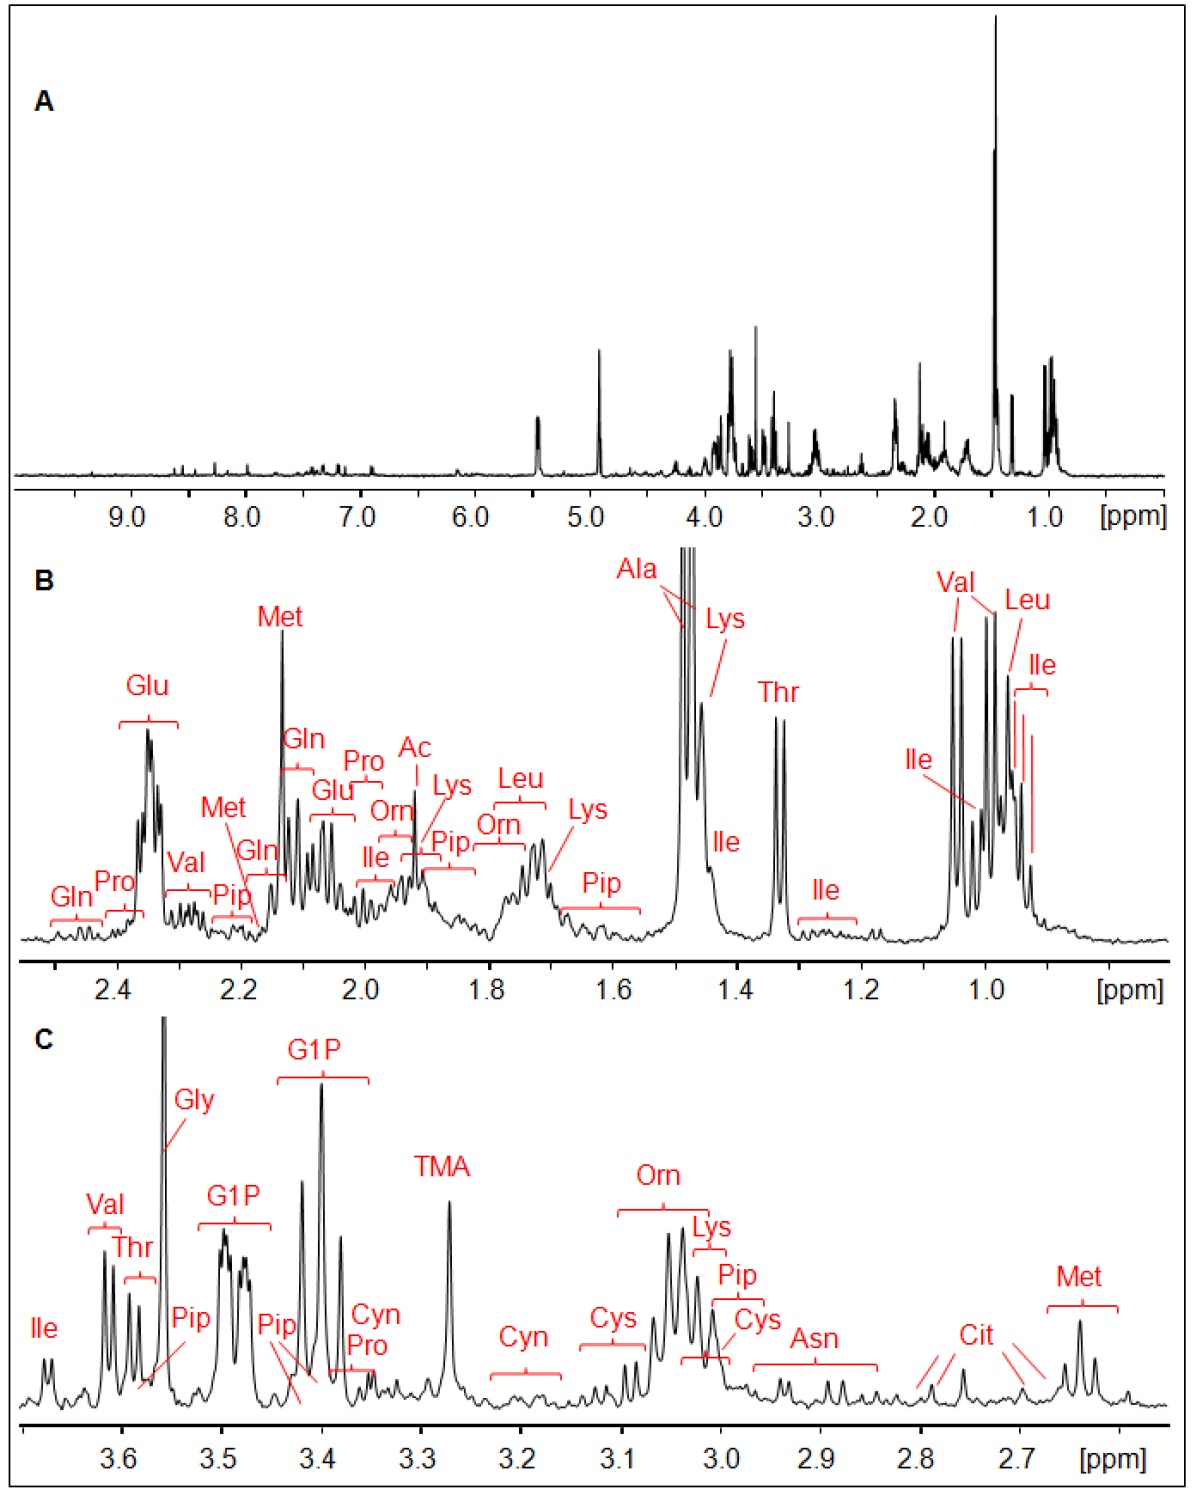
FIGURE 1.
1H HR-MAS NMR spectrum of Giardia cell suspension
in PBS (D2O, pH 7, T = 6°C). A, overview of whole spectral
range, B, 0.7 ppm –
2.55 ppm, C, 2.55 ppm – 3.7 ppm, D,
spectral range 3.7 ppm – 5.6 ppm, E, 6.0 ppm – 9.6 ppm.
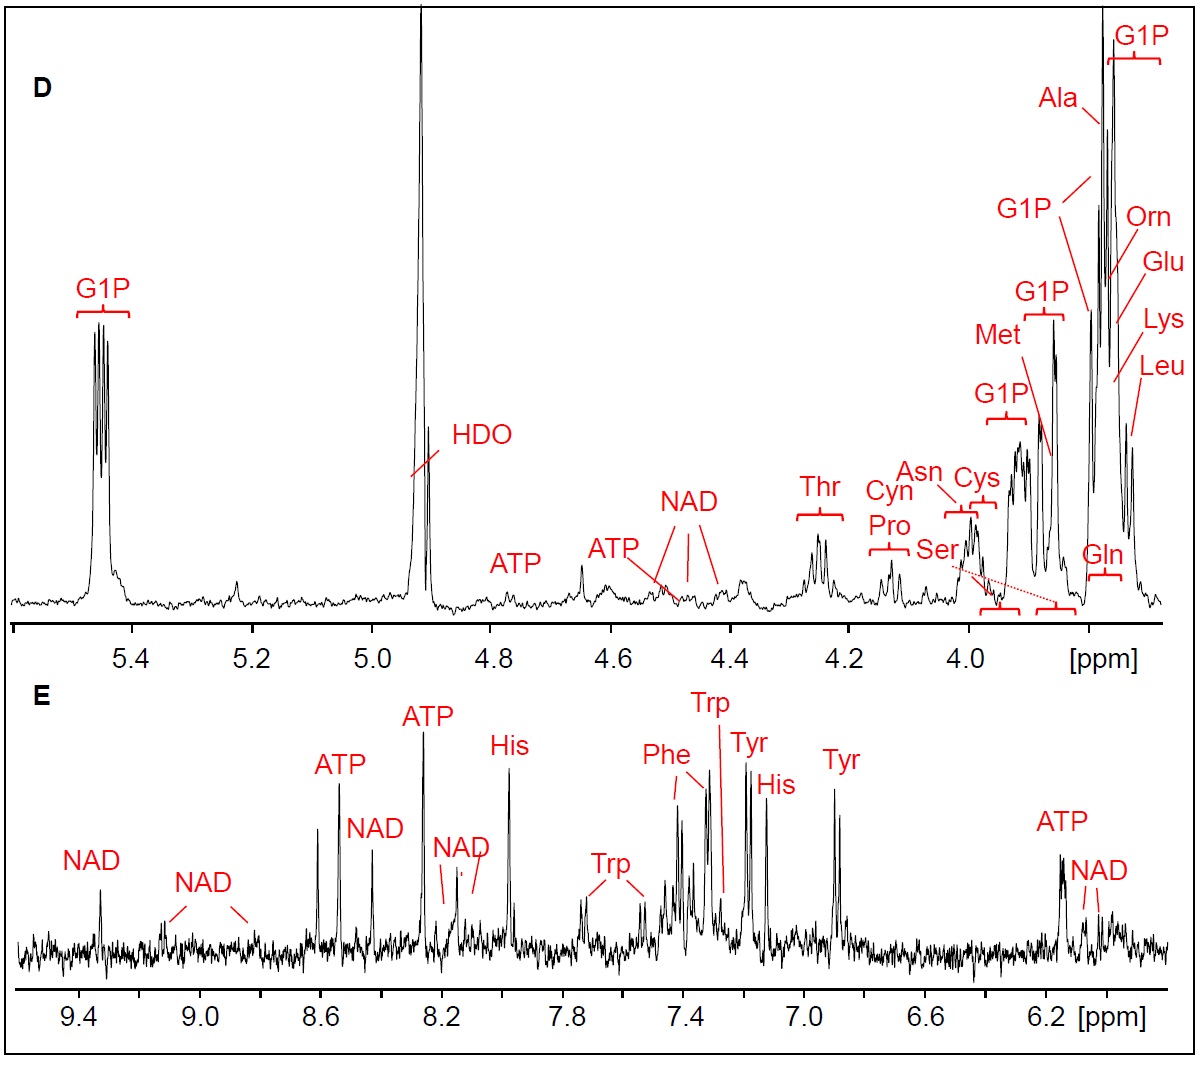
FIGURE 1.
(continued)
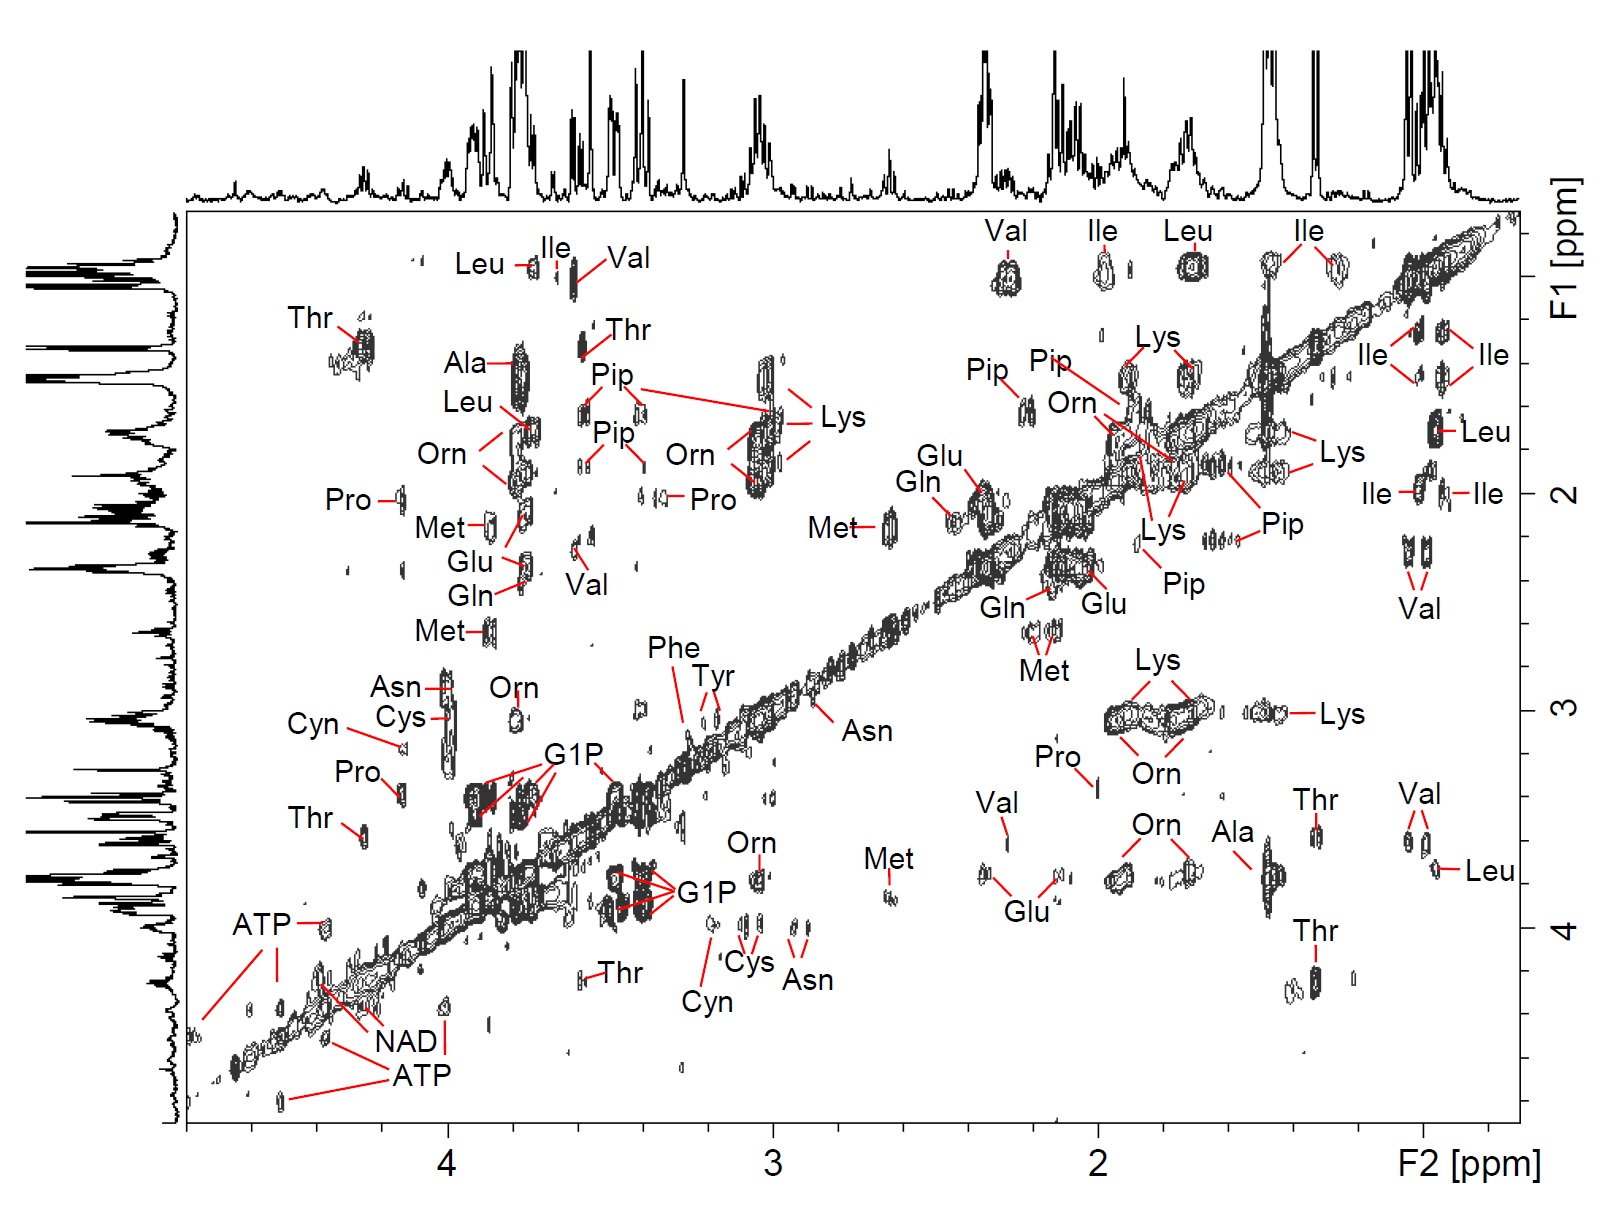
FIGURE 2.
1H1H-TOCSY HR-MAS spectrum of Giardia cell suspension in PBS (D2O, pH 7, T = 6°C). Spectral region from 0.2 ppm – 4.8 ppm.
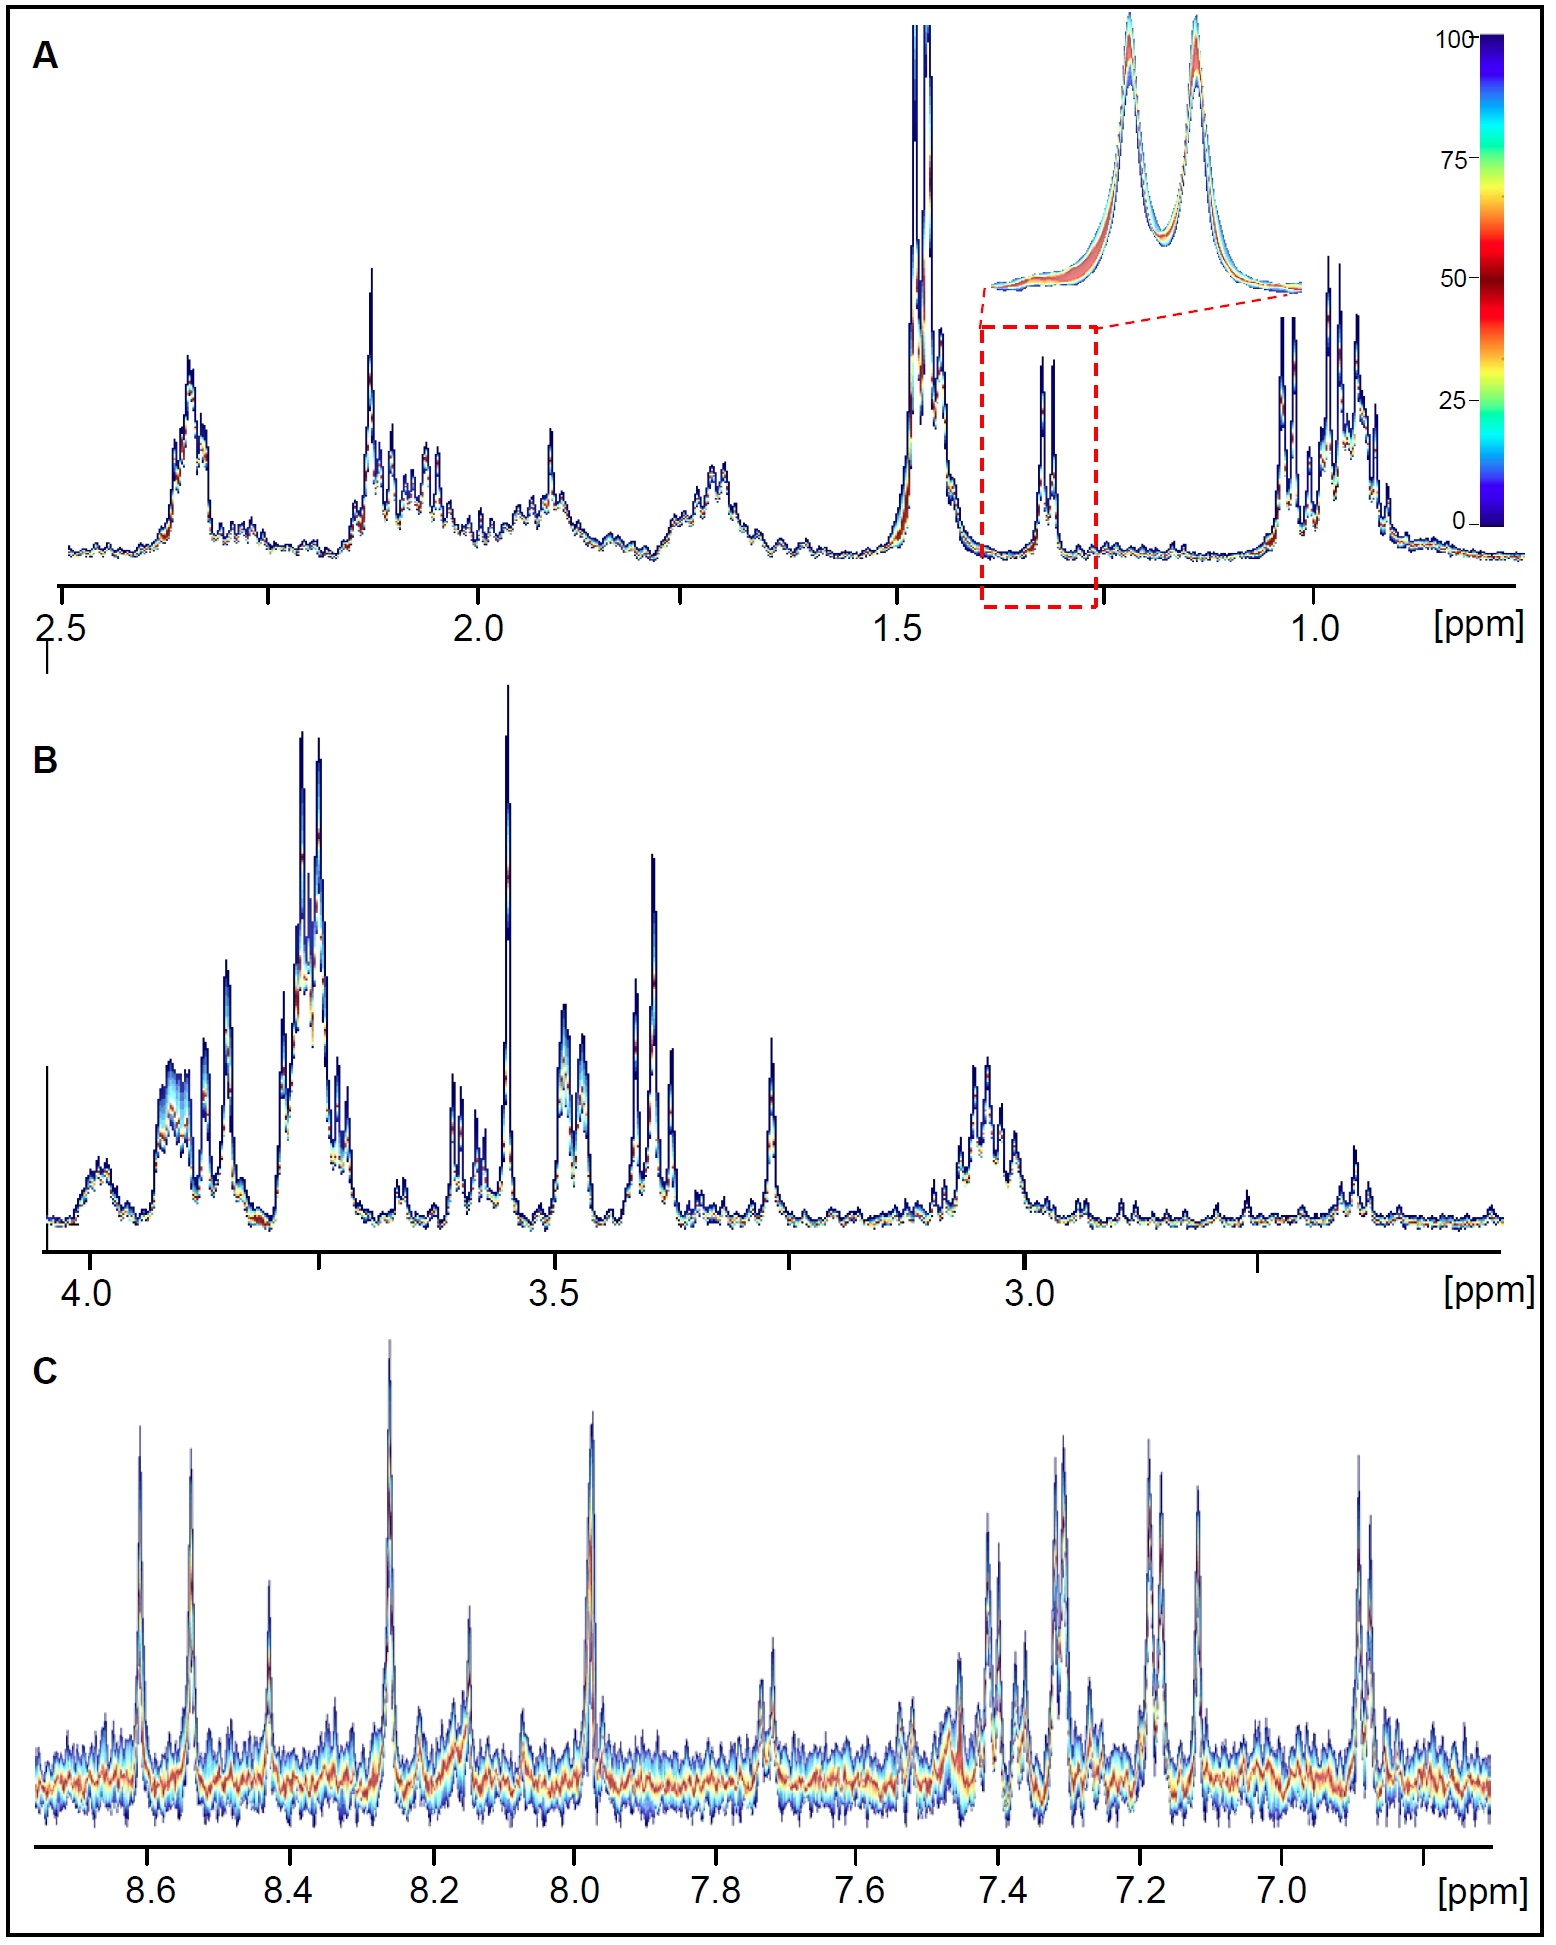
FIGURE 3.
Quantile plots calculated for 1H HR-MAS NMR spectra obtained from 10 independent Giardia cell suspension samples (PBS/(D2O, pH 7, T = 6°C). A: 0.7 ppm – 2.5 ppm, B: 2.5 ppm – 4 ppm, C: 6.7 ppm – 8.8 ppm.