4014
Targeted and untargeted NMR phytometabolomics for polar chemosensory markers and signatures1Department of NMR, All India Institute of Medical Sciences, New Delhi, India
Synopsis
The potential of proton NMR metabolomics to classify medicinal and nutraceutical plants based on their chemosensory property such as taste has been explored in this study. Polar fractions obtained by dual phase (chloroform-methanol/water) extraction of select plants (n=48) from four chemosensory groups were studied using water suppressed 1D proton NMR spectroscopy. Untargeted metabolomics showed distinct chemosensory based clustering using Partial Least Square Discriminant Analysis. Using targeted metabolomics, chemosensory phytomarkers like α- and β- glucose (sweet), swertiamarin (bitter), trigonelline (pungent) and quercetin (astringent) were identified. The study has shown that NMR can play an important role in sensory science.
Introduction
Chemosensory property such as taste plays an important role not only in nutrition science but also in pharmacology and clinical medicine.1-3 Such applications along with increasing importance of nutrition in healthcare have necessitated objective evaluation of taste. Since polar compounds play an important role in sensory perception of taste, this study based on proton NMR phytometabolomics has explored polar compounds as markers for chemosensory classification.Materials and methods
Extraction of polar phytochemicals: Forty eight plants from four major chemosensory categories (sweet, bitter, pungent and astringent) were studied. For example, sweet - Vitis vinifera, Prunus amygdalus; bitter - Swertia chirata, Centella asiatica; pungent - Trigonella foenum-graceum, Piper longum; astringent - Ficus bengalensis, Ficus religiosa. Dual phase (chloroform-methanol/water) extraction was carried out to separate the polar from the non-polar compounds. The polar extracts were dried using rotary vacuum concentrator to remove the solvent.
NMR studies: The polar extracts were dissolved in D2O. 1D Proton NMR spectra were acquired at 700 MHz (Agilent, USA): relaxation delay - 14 sec, scans - 64, spectral width - 12 ppm, data points - 32 K. Deuterated TSP in a coaxial insert served as a reference.
Data analysis: Both targeted and untargeted metabolomics were carried out. For the latter, NMR spectra were binned and bucketed at intervals of 0.04 ppm (Mnova 10.0, Mestrelab Research) for Partial Least Squares Discriminant Analysis (PLS-DA) (Metaboanalyst 3.0). For targeted studies, peak assignments were carried out using NMR data libraries.4,5
Results
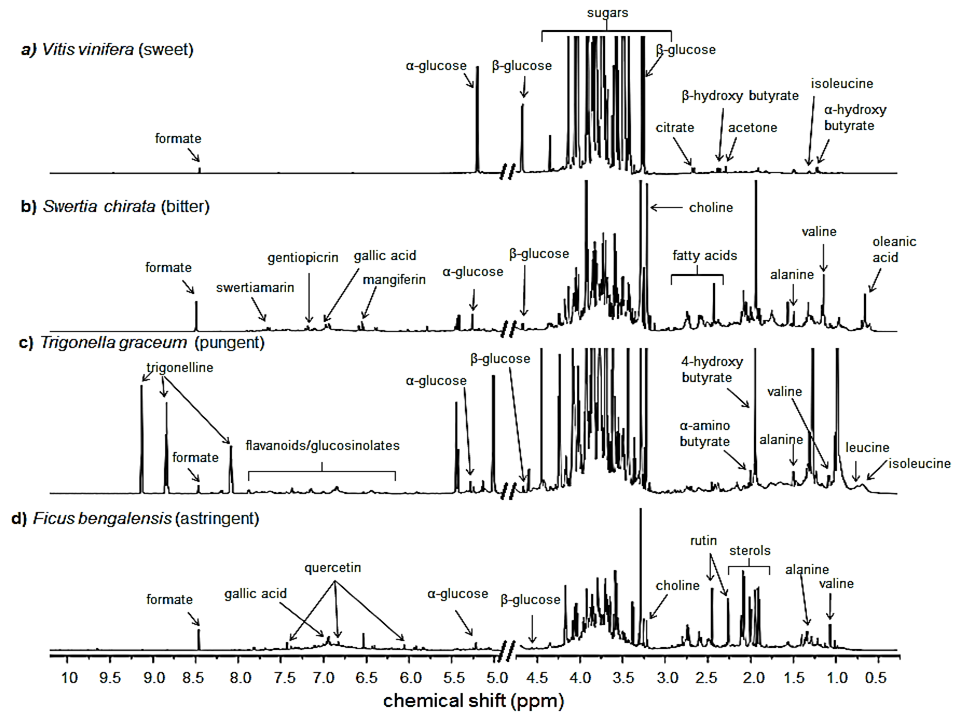
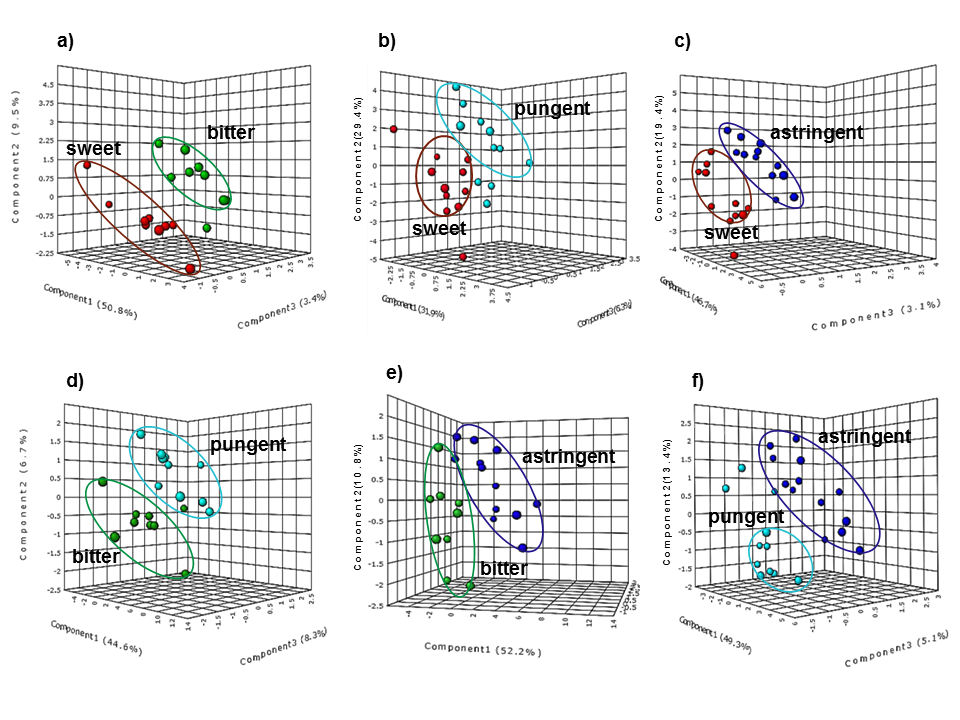
Figures 1a-1d show representative spectra from the polar fraction of plants from different chemosensory categories. Although a wide range of metabolites from amino acids (0.9-3.5 ppm), sugars (3.5-5.5 ppm) to secondary metabolites (6-9 ppm) were observed, each chemosensory group had characteristic peaks as well. For example, the following taste associated phytochemicals were observed in the spectra: sweet - α- and β- glucose; bitter - swertiamarin, gentiopicrin; pungent - trigonelline; astringent - phenols like quercetin and gallic acid. PLS-DA plots (Figs. 2a-2f) showed discrimination between the following chemosensory plant groups: sweet and other groups (Figs. 2a-2c), bitter and pungent (Fig. 2d), bitter and astringent (Fig. 2e), pungent and astringent (Fig. 2f).Conclusion
Research in chemosensory sciences has witnessed growth in recent times with expanding applications in a number of fields such as nutrition science and pharmacology.1-3 This study has shown that NMR metabolomics of polar phytocompounds can be used to fingerprint and identify chemosensory phytomarkers. In addition, NMR can also provide fundamental information about the phytochemicals contributing to the chemosensory properties.Acknowledgements
This work was supported by National Medicinal Plants Board, Ministry of AYUSH, Government of India.References
1. Beauchamp GK, Keast RS, Morel D, et al. Phytochemistry: ibuprofen-like activity in extra-virgin olive oil. Nature. 2005; 437: 45-46.
2. van Dongen MV, van den Berg MC, Vink N, et al. Taste-nutrient relationships in commonly consumed foods. Br J Nutr. 2012; 108: 140-147.
3.Tucker RM, Edlinger C, Craig BA, et al. Associations between BMI and fat taste sensitivity in humans. Chem Senses. 2014; 39: 349-357
4. Wishart DS, Jewison T, Guo AC, et al. HMDB 3.0 - The Human Metabolome Database in 2013. Nucleic Acids Res. 2013; 41: D801-D807.
5. Deborde C, Jacob D. MeRy-B, a metabolomic database and knowledge base for exploring plant primary metabolism. Methods Mol Biol. 2014; 1083: 3-16.
Figures