4012
NMR based Metabonomics study of Chronic Cold Stress induced metabolic alterations in rat model1NMR RESEARCH CENTRE, INMAS, DRDO, DELHI, India
Synopsis
Primary hypothermia/cold stress is due to environmental exposure, with no underlying medical condition causing disruption of temperature regulation. The exposure of human to such conditions often leads to decremented physical and mental performance. Metabonomics can provide a quick snapshot of exogenous/endogenous stressors induced metabolic perturbations. The metabolic pathways analysis showed that Taurine and TCA metabolism have maximum contribution to the altered urine metabolic phenotype. Metabolic markers related to liver dysfunction, gut microflora & muscle bioenergetics were altered due to cold exposure. These changes in combination with genomics and proteomics studies would further reveal potential drug targets contributing to cold exposure medicine.
Introduction:
Primary hypothermia/cold stress is due to environmental exposure, with no underlying medical condition causing disruption of temperature regulation.1 The exposure of human to such conditions often leads to decremented physical and mental performance, which also exacerbates pre-existing medical conditions.2 The body-fluids such as blood, urine or cerebrospinal fluid, etc provide an exploratory window to determine the patho-physiological state of an organism.3 1H-NMR along with the use of pattern recognition (PR) techniques can provide a quick snapshot of exogenous/endogenous stressors induced metabolic perturbations.4 To the best of our knowledge, the present study is first of its kind, aimed at exploring metabolic responses due to the cold exposure.Aim & Objective:
To study perturbations in metabolic pathways due to cold stress.Materials & Methods:
Pre-exposure followed by exposure of rats (n=7) to cold in a simulated climatic hypoxia chamber for 14 days, with temperature and humidity regulated at 4±1ºC and 55±1%, respectively, urine samples were collected in metabolic cages. The urine samples were collected at various time points of Day 1, Day 4, Day 7, and Day 14 & stored at -80ºC until NMR spectroscopy. For NMR analysis, samples (300μL) were prepared by mixing 300μL of D2O as a field frequency lock with 1mM TSP as an external reference for spectral acquisition. 1H NMR spectra were acquired on each sample at 600 MHz on a Bruker Avance III spectrometer at 298K. Water suppression was achieved using 1D NOESYPR pulse sequence. For each sample, 64 transients were collected into 32K data points with a relaxation delay of 2s, flip angle of 90° and a mixing period of 100 ms. Matlab based icoshift (Interval Correlation Optimized Shifting) algorithm was used to correct pH-dependent peak shifts. The binning of spectral data was performed over the range of δ 0.2-10 ppm using Amix software. Principal component analysis (PCA) and partial least squares discriminant analysis (PLS-DA) using online tool Metaboanalyst 3.0 were used to study similarities/dissimilarities of metabolic profiles of samples.Results & Discussion:
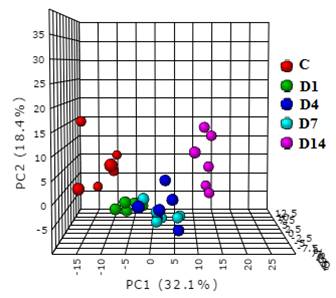
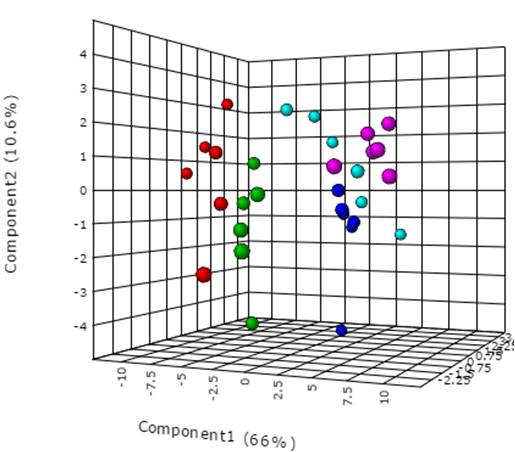
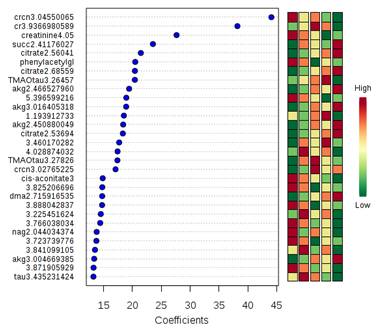
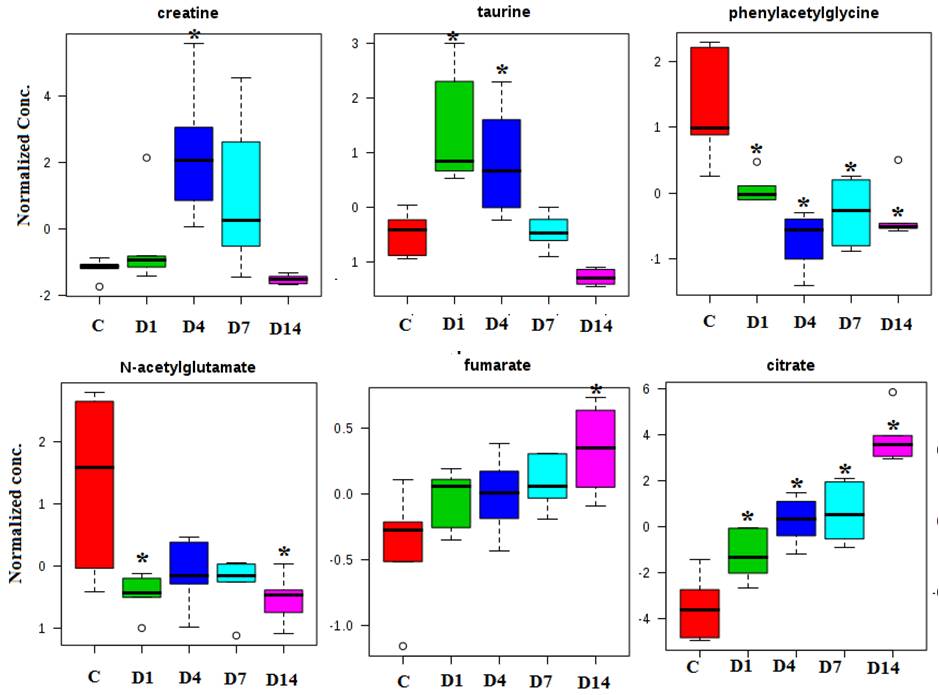
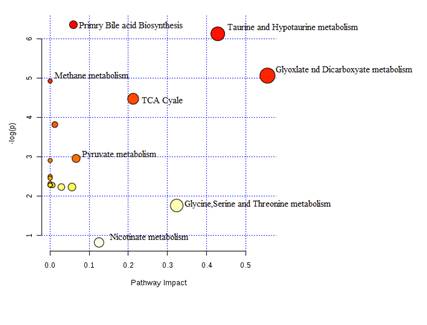
The alteration in urine metabolic phenotype under cold stress conditions was examined using 1H-NMR based metabolomics. PCA (Figure 1) & PLS-DA (Figure 2) showed clear separation of cold exposed groups from controls. PLS-DA model quality parameters; R2 and Q2 for first three parameters were 0.93 and 0.78, respectively suggesting that the first three components were the most efficient cluster classifier. The weighted sum of PLS-regression coefficients showed top 30 important buckets which resulted in clusters separation in PLS-DA (Figure 3). The metabolites related to the top 30 buckets were integrated and the concentration of metabolites were plotted and compared with respect to controls (Figure 4). The phenylacetylglycine and NAG were significantly decreased after D1 cold exposure, while taurine were significantly elevated after D1, D4 of cold exposure. The α - ketoglutarate (α-KG), citrate, and cis-aconitate levels were increased after D1, D7 and D14 of cold exposure, respectively. Succinate and fumarate were increased after D14. The metabolic pathway analysis shows that two most affected pathways were TCA cycle and taurine metabolism (Figure 5). The concentration of taurine after 4 days of cold exposure was elevated, which is an important biomarker for altered liver functioning. The incremented α-ketoglutarate (α-KG), after 7-and 14-days of cold exposure, gives insights of the TCA revival to meet high energy demand. It might have resulted from the adaptive responses such as blood vessel proliferation and erythropoiesis, leading to tissue re-oxygenation.5 Phenylacetylglycine (PAG) was decremented which further confirmed the alteration in gut microflora metabolism.6 The changes in gut flora metabolism may further induce the loss of appetite at cold conditions. The urinary creatine levels were elevated after 4-days of exposure indicating creatinuria which may have probably resulted due to skeletal muscle atrophy or altered muscle bioenergetics due to cold exposure.7Conclusion:
Cold stress biology is an emerging field of life sciences, which is rapidly gaining importance due to escalated human activity at mountain terrains and population surviving in cold conditions. By studying the metabolic phenotype changes due to cold exposure, it would help to foretell the progression of diseased condition. These changes in combination with genomics and proteomics studies would further reveal potential drug targets contributing to cold exposure medicine.Acknowledgements
No acknowledgement found.References
1. Long WB et al (2005) Cold Injuries 15(1) 67, 2. Holmer et al (2012) Patty’s Toxicology Ch 12, 3. Kosmides et al (2014) Metabolomics 41(3) 205, 4. Larive et al (2015) Anal Chem 87(1) 133, 5. Brugniaux et al (2007) Respir Physiol Neurobiol 158 212, 6. Wikoff et al (2009) Proc Natl Acad Sci U S A. 106(10) 3698, 7. Roksana et al (2017) Appl Physiol Nutr Metab. 42(3) 319.Figures