4009
Magnetic resonance spectroscopy-based metabolic biomarkers of IDH1 mutant glioma in response to temozolomide therapyElavarasan Subramani1, Lydia M Le Page1, Russell O. Pieper2,3, and Sabrina M Ronen1,3
1Department of Radiology and Biomedical Imaging, University of California, San Francisco, San Francisco, CA, United States, 2Department of Neurological Surgery, Helen Diller Research Center, University of California, San Francisco, San Francisco, CA, United States, 3Brain Tumor Research Center, University of California, San Francisco, San Francisco, CA, United States
Synopsis
The alkylating agent temozolomide (TMZ), previously used only in the treatment of high-grade glioblastoma, is now being considered for the treatment of low-grade glioma that are driven by mutations in the cytosolic isocitrate dehydrogenase 1 (IDH1) gene. However, early detection of response remains a challenge. 1H magnetic resonance spectroscopy-based metabolic profiling of cells genetically engineered to express mutant IDH1 and treated with TMZ showed significant alterations in metabolites majorly related to the tricarboxylic acid cycle, pyruvate metabolism and the pentose phosphate pathway. These findings hold potential for assessing response of IDH1 mutant cells to TMZ therapy.
Introduction
Gliomas are the most common type of brain tumor in adults, representing 80% of primary malignant tumors. While several genetic and epigenetic alterations have been identified in glioma in the past few years, the most clinically relevant finding has been the discovery of mutations in the cytosolic isocitrate dehydrogenase 1 (IDH1) enzyme, which is present in up to 90% of primarily low-grade gliomas.1,2 IDH1 mutations lead to a neomorphic activity of the enzyme that results in conversion of α-ketoglutarate to the oncometabolite 2-hydroxyglutarate (2-HG).1,2 Mutant IDH1 tumors are less aggressive than primary glioblastoma (GBM), but nonetheless always recur and ultimately lead to patient death. To improve patient survival, one therapeutic strategy is treatment with the alkylating chemotherapeutic agent Temozolomide (TMZ), previously reserved for the treatment of the more aggressive primary GBM.3 Clinical trials suggest that treatment of IDH1 mutant patients with TMZ improves survival.4,5 However, assessment of early response to therapy remains challenging. The goal of this study was therefore to determine the value of 1H magnetic resonance spectroscopy (MRS)-based biomarkers for detection of response to treatment. To this end, we examined the global metabolic alterations that occurred following TMZ treatment in a genetically engineered IDH1 mutant immortalized Normal Human Astrocyte (NHA)-based cell model using 1H MRS combined with chemometrics.Methods
NHAs were genetically engineered to express mutant IDH1 (NHAIDHmut) and maintained in culture as previously described.6,7 Cells were treated either with the IC50 value of TMZ (100 μM; N=6), or with DMSO (1%; N=5) for 72 hours. Then, metabolites were extracted from cells using the dual-phase extraction method.8 The lyophilized aqueous phase was resuspended in 400 μL of deuterium oxide, and 5 mM sodium 3-(trimethylsilyl)propionate-2,2,3,3-d4 (TSP) was added as an internal reference. 1H spectra were acquired using a 500 MHz Bruker Avance spectrometer. Data was analysed using MetaboAnalyst as previously described,9 first using a multivariate principal component analysis (PCA), followed by partial least squares discriminant analysis (PLS-DA). The significance of findings was assessed using goodness of fit (R2) and goodness of prediction (Q2). Variable Importance in Projection (VIP) scores were used to identify metabolites altered with treatment. Specific metabolites were also manually integrated for metabolic quantification using Mnova7, integrals normalized to TSP and to cell number and statistical significance of differences determined using unpaired Student’s t-test (Graphpad). Pathway enrichment and topology analysis of dysregulated metabolites was performed using MetPA as described earlier.9Results and Discussion
As expected, treatment of NHAIDHmut cells with the IC50 of TMZ resulted in a 47.73±3.99% reduction in cell number. When inspecting the 1H MRS spectra of the control and treated cells, twenty-nine metabolites could be identified using Human Metabolome DataBase and literature values (Fig.1). First, MRS spectra of both groups were subjected to PCA to visualize the inherent clustering of groups. The PCA score plot showed separation of TMZ-treated from DMSO-treated control cells (Fig.2A). Further, improved separation between the groups was obtained by PLS-DA (Fig.2B; R2= 0.907 and Q2=0.777). We then used this model, and the VIP plot with threshold of ≥1 (Fig.2C), to identify the most significant metabolites contributing to class separation. A univariate analysis was then applied to the integral values of the metabolites identified in this manner. Glutamine, glutamate, pyruvate, succinate, glucose, phosphocholine, isoleucine, valine, lysine, phenylalanine, NAD+/NADP+ and ATP/ADP/AMP were observed to be significantly higher in TMZ-treated NHAIDHmut cells as compared to controls (Fig.3). TMZ did not affect 2-HG levels; in spite of the fact that the precursors of 2-HG, namely glutamine and glutamate, were significantly altered in treated cells. Pathway enrichment and topology analysis of these metabolites showed 41 altered pathways in TMZ-treated cells. Based on their significance and impact score, majorly altered pathways were identified (Fig.4). Most notably, the tricarboxylic acid (TCA) cycle was identified as a pathway that was altered following treatment, consistent with the significant increases in glutamate, glutamine, succinate as well as TCA cycle-derived branched chain amino acids (isoleucine and valine). Another significantly altered pathway was the pentose phosphate pathway, consistent with the observed increases in NADP+ levels and ATP/ADP/AMP, which could all be derived from this pathway. Pyruvate metabolism and glycerophospholipid metabolism were also identified as altered.Conclusion
Our findings demonstrate that IDH1 mutant glioma show a clear metabolomic fingerprint in response to TMZ therapy. Further studies are needed to confirm the generality of our findings in other mutant IDH1 models. Nonetheless, these findings as well as complementary hyperpolarized 13C MRS approaches may help assess early response to TMZ therapy in mutant IDH1 glioma.Acknowledgements
This work is supported by NIH R01CA197254 and NIH center grant P41EB013598.References
- Yan H, Parsons DW, Jin G, et al. IDH1and IDH2Mutations in Gliomas. New Engl J Med. 2009;360:765-773.
- Dang L, White DW, Gross S, et al. Cancer-associated IDH1 mutations produce 2-hydroxyglutarate. Nature. 2009;462:739-744.
- Park I, Mukherjee J, Ito M, et al. Changes in pyruvate metabolism detected by magnetic resonance imaging are linked to DNA damage and serve as a sensor of temozolomide response in glioblastoma cells. Cancer Res. 2014;74(23):7115-7124.
- Cairncross JG, Wang M, Jenkins RB, et al. Benefit from procarbazine, lomustine, and vincristine in oligodendroglial tumors is associated with mutation of IDH. J Clin Oncol. 2014;32:783-790.
- Buckner JC, Shaw EG, Pugh SL, et al. Radiation plus procarbazine, CCNU, and vincristine in low-grade glioma. N Engl J Med. 2016;374:1344-1355.
- Sonoda Y, Ozawa T, Hirose Y, et al. Formation of intracranial tumors by genetically modified human astrocytes defines four pathways critical in the development of human anaplastic astrocytoma. Cancer Res. 2001;61:4956-4960.
- Chaumeil MM, Larson PEZ, Yoshihara HAI, et al. Non-invasive in vivo assessment of IDH1 mutational status in glioma. Nat Commun. 2013;4:2429.
- Ronen SM, Jackson LE, Beloueche M, et al. Magnetic resonance detects changes in phosphocholine associated with Ras activation and inhibition in NIH 3T3 cells. Br J Cancer. 2001;84:691-696.
- Subramani E, Rameshbabu AP, Jothiramajayam M, et al. Mycobacterial heat shock protein 65 mediated metabolic shift in decidualization of human endometrial stromal cells. Sci Rep. 2017;7(1):3942.
Figures
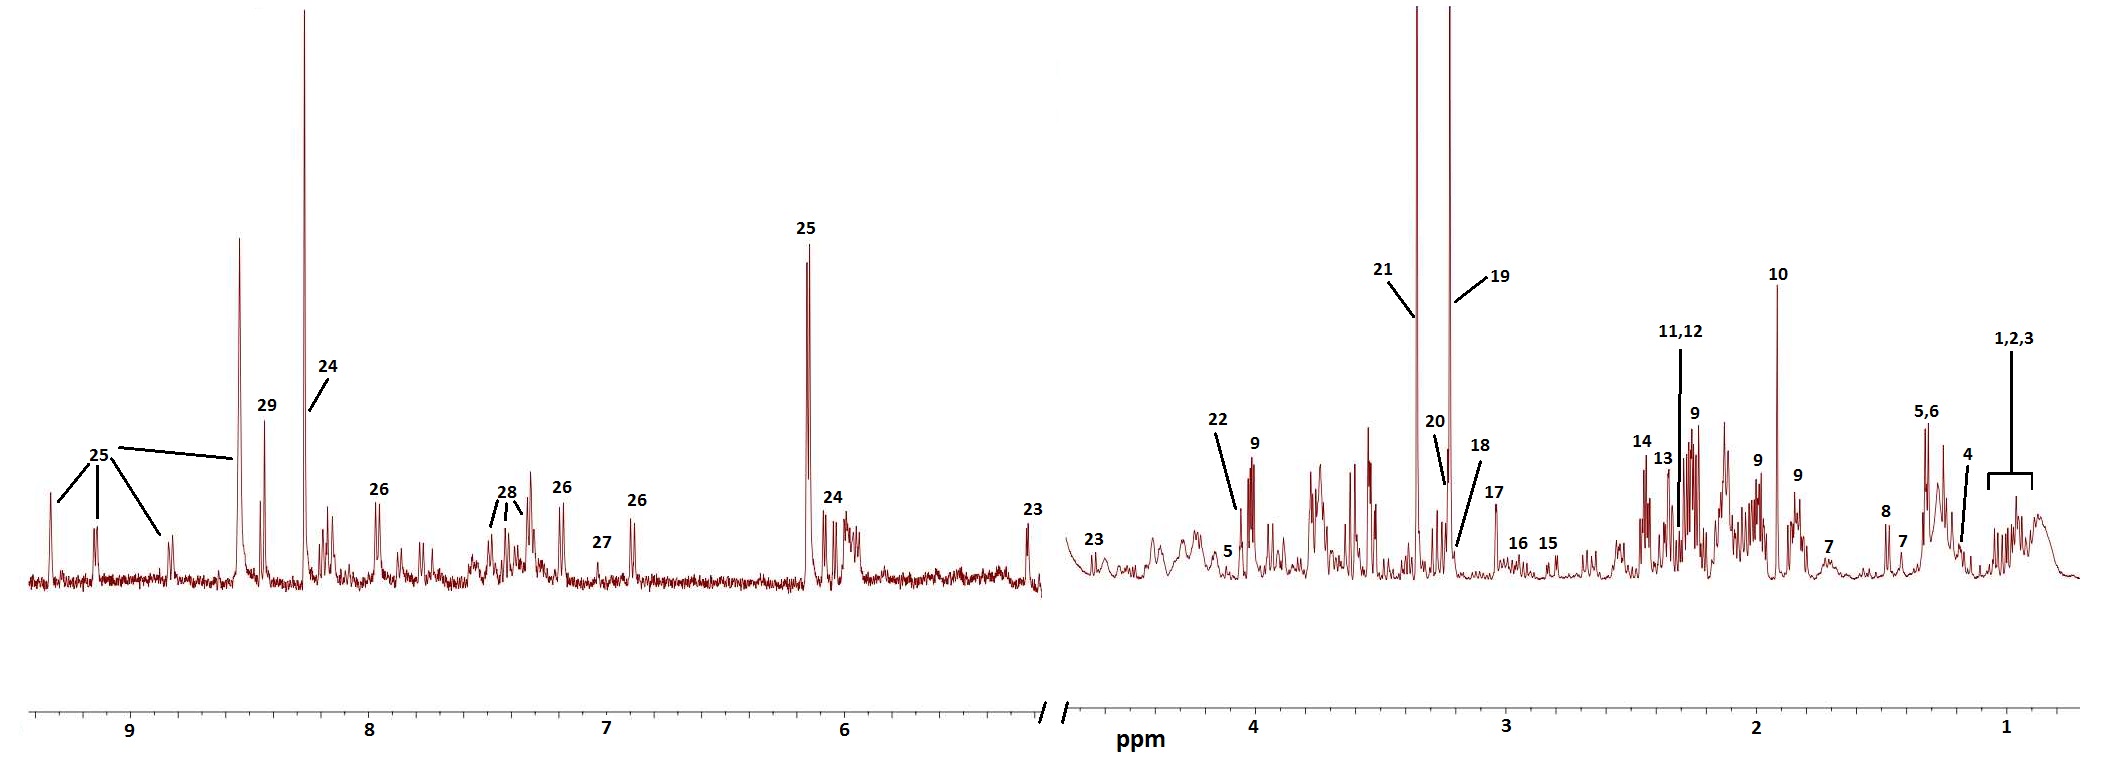
Figure 1: A typical 500 MHz MRS spectrum (δ 0.0−10.0) of NHAIDHmut cells. Metabolite
assignments are as follows: 1.Isoleucine, 2.Leucine, 3.Valine,
4.3-hydroxybutyrate, 5.Lactate, 6.Threonine, 7.Lysine, 8.Alanine,
9.2-hydroxyglutarate, 10.Acetate, 11.Pyruvate, 12.Succinate, 13.L-Glutamine,
14.D-Glutamate, 15.Aspartate, 16.Glutathione, 17.Creatine, 18.Choline,
19.Phosphocholine, 20.Glycerophosphocholine, 21.Phosphatidylcholine,
22.Myoinositol, 23.D-Glucose, 23.L-Histidine, 24.ATP/ADP/AMP, 25, NAD+/NADP+,
26-L-Tyrosine, 27.1-methylhistidine, 28.L-Phenylalanine, 29. Formate.
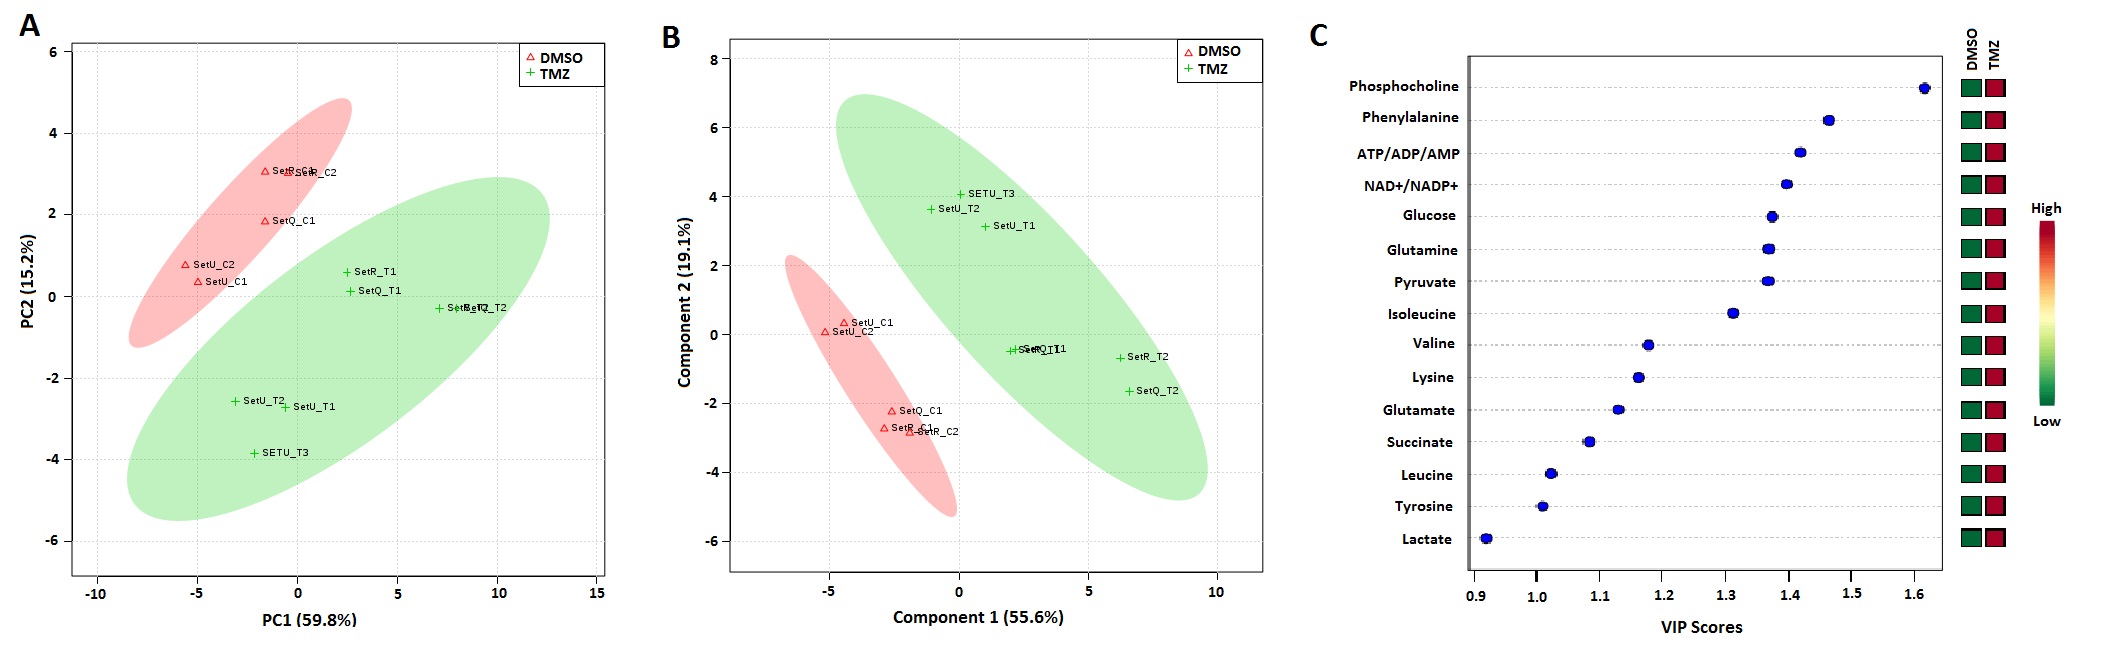
Figure 2: Two-dimensional scatter score plot of PCA (A)
and PLS-DA (B) showing good discrimination between NHAIDHmut control and
TMZ-treated cells. Variable important for projection (VIP) plot identifying
metabolites with VIP score >1 responsible for discriminating TMZ-treated and
control cells. Green – down-regulated, Red – up-regulated.
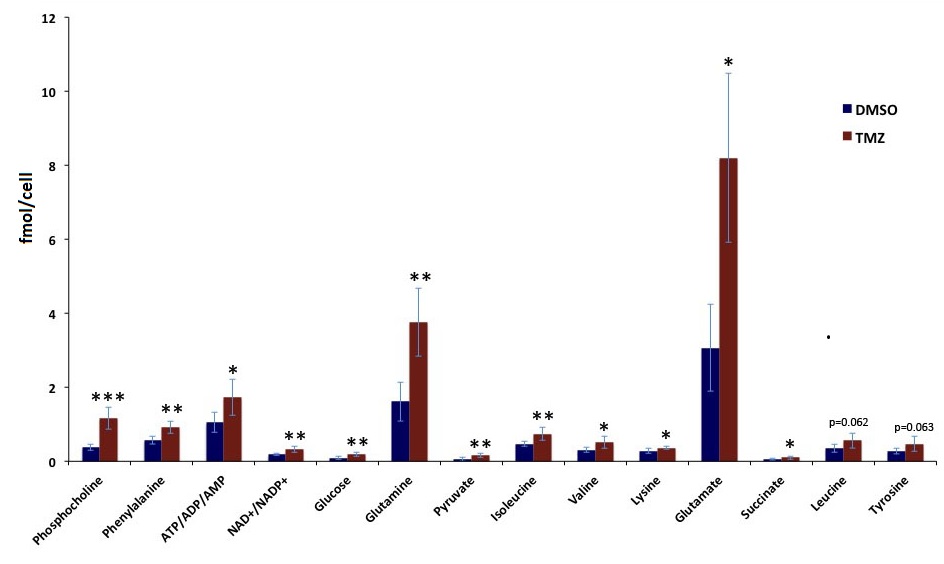
Figure 3: Quantification of 1H MRS-detected
metabolites identified from the VIP analysis. *p<0.05; **p<0.01;
***p<0.001
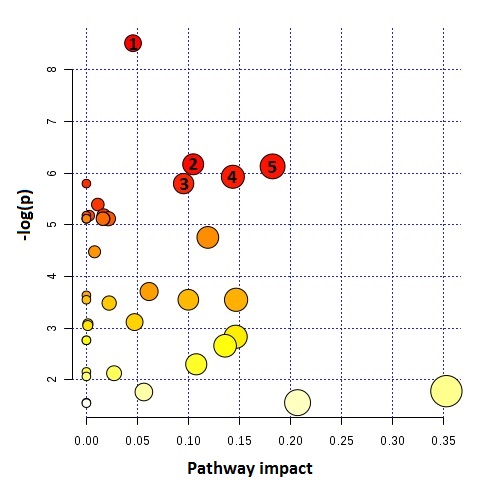
Figure 4: Metabolic pathway and topology analysis showing
the main pathways altered in TMZ-treated NHAIDHmut cells. Node size indicates
the degree of importance i.e. pathway impact score. Color indicates the level
of significance. Large red node represents the highest level of changes in TMZ
treated cells. Orange, yellow and white nodes are indicating moderate, slight
and zero importance pathways, respectively. The most important pathways with
statistical significance are indicates as follows: 1. Glycerophospholipid
metabolism, 2. TCA cycle, 3. Pyruvate metabolism, 4. Pentose phosphate pathway
metabolism, 5. Glycolysis or Gluconeogenesis. –log(p) indicates level of
significance.