4008
Study of Altered Urinary Metabolism in Prostate Cancer Patients using NMR Metabolomics1Department of NMR & MRI Facility, All India Institute of Medical Sciences, New Delhi, India, New Delhi, India, 2Department of Urology, All India Institute of Medical Sciences, New Delhi, India, New Delhi, India, 3Department of NMR and MRI Facility, All India Institute of Medical Sciences, New Delhi, India, New Delhi, India, 4Department of Radiology, All India Institute of Medical Sciences, New Delhi, India, New Delhi, India, 5Department of Pathology, All India Institute of Medical Sciences, New Delhi, India, 6Department of NMR and MRI Facility, All India Institute of Medical Sciences, New Delhi, India
Synopsis
The present study demonstrated the metabolic profile of urine samples of prostate cancer (PCa) patients (n=33) and healthy controls (HC; n=21) using 700 MHz high-resolution proton NMR for early diagnosis and to define noninvasive biomarker/s. A significantly lower concentration of leucine, histidine, tyrosine, citrate, dimethylglycine, glycerophosphocholine, choline, creatinine, indoxyl sulphate and formate was seen in PCa patients. These findings suggest metabolic alterations due to mitochondrial dysfunction, cell proliferation, energy demand, oxidative stress and protein turnover in PCa patients.
Purpose:
To investigate metabolic profile of urine samples of prostate cancer (PCa) patients and to compare with healthy controls (HC) using proton (1H) nuclear magnetic resonance (NMR) spectroscopy.
Introduction:
PCa is most frequently diagnosed prostatic adenocarcinoma in men over the age of 50 years. It is a slow growing cancer and men with early cancer may not have symptoms. The diagnosis of PCa is difficult due to lack of sensitive and specific tumor markers. Thus, the present study was designed to investigate the metabolic profile of urine sample of PCa patients and healthy controls (HC) using high-resolution 1H NMR spectroscopy to determine the early noninvasive biomarker/s for the diagnosis.
Methods:
Urine samples were collected from patients with PCa (n = 33; mean age = 68.3 ± 8.2 years); PSA = 45.81 (4.11-270) ng/mL and HC (n = 2; mean age = 27.8 ± 3.8 years) in morning pre-prandial and immediately stored at -80°C until NMR experiments were carried out. An informed consent was taken and the study was approved by Institute Ethics Committee. Proton spectra of urine samples were carried out at 700 MHz spectrometer (Agilent, USA). One dimensional with water pre-saturation was acquired at 25°C with following parameters: spectral width = 9124.1 Hz; scans = 256; relaxation delays = 14s. Two dimensional (2D) total correlation spectroscopy (TOCSY) experiments was carried out for assignments of resonances. The data was processed using the Vnmrj 2.3A software (Agilent technologies). For comparison between two groups, unpaired Mann–Whitney U test was used. A p-value < 0.05 was considered significant. Statistical analysis was carried out using SPSS software (SPSS Inc. Chicago, IL, USA) and MetaboAnalyst3.0. In order to analyze the data obtained in the performed studies, the univariate (receiver operating characteristics (ROC) curve analysis) and multivariate (partial least squares–discriminant analysis (PLS-DA), variable importance to projection (VIP) score, statistical analyses were applied in urine samples of PCa patients and HC.
Results:
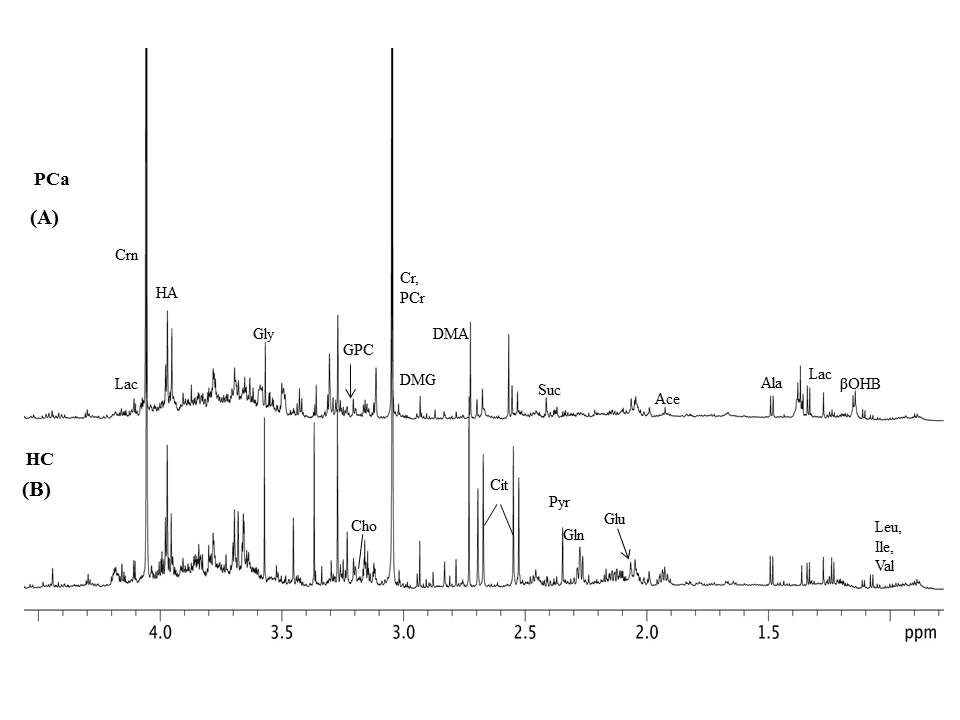
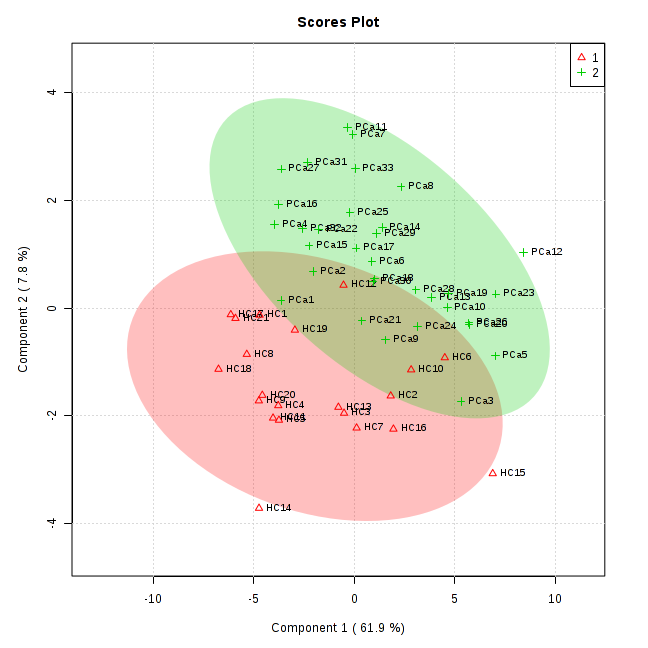
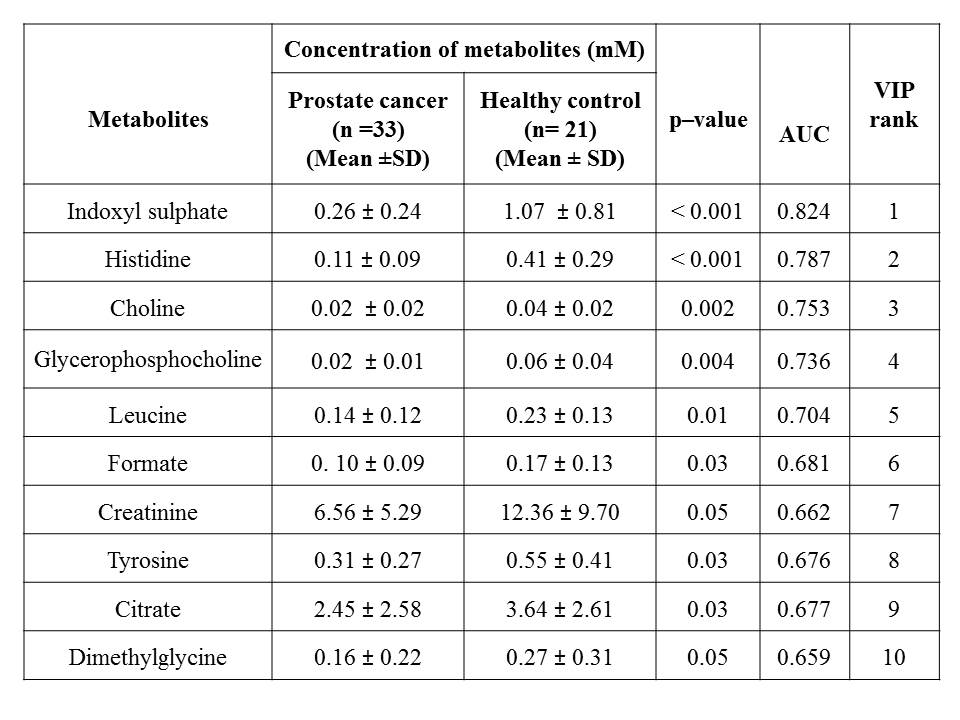
Figure 1 shows the representative aliphatic region of 1D proton NMR spectrum of urine sample of a patient with PCa (A) and HC (B). In all, 40 metabolite were assigned using 1D and 2D NMR. The concentration [mM (mean ± SD)] of 10 metabolites that showed significant (p< 0.05) difference, AUC values and VIP score (>1) between PC and HC is presented in Table 1. Figure 2 shows the PLS -DA score plot clearly discriminating PCa patients from HC.
Discussion:
The present study revealed significantly lower concentration of branch chain amino acid such as leucine (Leu) and aromatic amino acids like tyrosine (Tyr) and histidine (His) in urine of PCa patients1 as compared to HC indicates increased protein turnover in cancer cells. Also a significantly lower concentration of membrane metabolite such as Choline (Cho) and glycerophosphocholine (GPC) in urine of PCa patients indicates a higher proliferation of PCa cells. Furthermore, a significantly lower concentration of dimethylglycine (DMG) in PCa patients2 was seen compared to HC. DMG is an intermediate metabolite of choline metabolism, alterations in membrane biosynthesis needed for proliferation of cancer cell. Further, our data showed significantly lower concentration of indoxyl sulfate (IS) in urine samples of PCa patients indicating dysfunction of oxidative stress3 and cancer progression4. Significantly lower concentration of Krebs cycle intermediate metabolite citrate (Cit) in PCa may be due to dysfunction of mitochondria metabolism5. In addition, our data showed a lower concentration of creatinine (Crn) in PCa patients, a waste product of muscle metabolism and therefore lower concentrations of urinary Crn may be associated with energy demand6. A significantly decreased concentration of formate (For) in urine of PCa patients was also seen which may be utilized for the biosynthesis of purines and thymidine7. The univariate ROC curve analyses indicated that in urine, the metabolites such as IS and His showed an AUC with high value (0.824 and 0.787, respectively), whereas AUC for DMG was 0.659, which is less significant as compared to Cho, GPC, Leu, For, Cit, Tyr and Crn. Table 1 shows the 10 VIP ranked metabolites which contribute to cancer development and progression. Figure 2 shows a PLS-DA classification score plot that depicts the differentiation of patients with PCa and HC in separate quadrant.
Conclusion:
This preliminary study revealed significantly lower concentration of His, IS, GPC, and Cho which may be considered as early non-invasive biomarker/s of PCa and consequently may be useful for diagnosis and prognosis. The altered metabolism specific for PCa state may also help to explain the pathogenesis of the disease.
Acknowledgements
No acknowledgement found.References
(1). Dereziński P, Klupczynska A, Sawicki W et al. International Journal of Medical Sciences. 2017;14 (1):1-122); (2). Pérez RC, Puchades CL, García FM et al. Metabolomics. 2017 1;13 (5):52; (3). Dou L, Jourde-Chiche N, Faure V et al. J Thromb Haemost. 2007 Jun;5(6):1302-8; (4). Monteiro MS, Barros AS, Pinto J et al. Sci Rep. 2016 Nov 18;6:37275; (5).Struck-Lewicka W, Kordalewska M, Bujak R et al. J Pharm Biomed Anal. 2015;111:351-61; (6). Eisner R, Stretch C, Eastman T et al. Metabolomics. 2011 7(1): 25–34; (7) Gronwald W, Klein MS, Zeltner R et al. Kidney Int. 2011;79(11):1244-53.Figures