4007
Metabolic Profiling of Blood Plasma for Distinguishing Prostate Cancer in Patients with Positive Biopsy and Negative Biopsy using NMR Spectroscopy1Department of NMR and MRI Facility, All India Institute of Medical Sciences, New Delhi, India, 2Department of Urology, All India Institute of Medical Sciences, New Delhi, India, 3Department of Radiology, All India Institute of Medical Sciences, New Delhi, India, 4Department of Pathology, All India Institute of Medical Sciences, New Delhi, India
Synopsis
The metabolic profiling of blood plasma sample for distinguishing prostate cancer (PCa) patients with positive biopsy (n=32) and negative biopsy (n=30) using NMR spectroscopy was investigated. A significantly higher concentration of lactate, choline, glucose and a lower concentration of histidine, tyrosine and phenylalanine were observed in blood plasma of PCa patients with positive biopsy as compared to negative biopsy. Our results suggest alterations in amino acid, energy, glucose and choline metabolisms, which may have association with disease progression.
Purpose: To investigate metabolic profiling of blood plasma to distinguish between prostate cancer (PCa) patients with positive biopsy and negative biopsy using proton (1H) nuclear magnetic resonance (NMR) spectroscopy.
Introduction: PCa is most prevalent noncutaneous cancer in males over the age of 50 years. The most common of PCa screening is serum prostate specific antigen (PSA) and/or digital rectal examination (DRE), followed by TRUS guided biopsy. There are limitations of diagnosis of PCa because of the lack of specificity and sensitivity and also providing false positive finding leading to over-diagnosis. Thus the present study was designed to investigate the metabolic profiling of blood plasma to distinguish between of PCa patients with positive biopsy (PB) and negative biopsy (NB) using 1H NMR spectroscopy for establishing biomareker/s for the diagnosis.
Methods: Blood samples were collected from PCa patient with PB (n = 32; mean age = 68.3 ± 6.8 years), PSA: 244.43 (5.92-1652) ng/mL and NB (n =30; mean age = 65.5 ± 7.1 years), PSA: 11.88 (4.03-37) ng/mL, in the morning pre-prandial after overnight fasting. An informed consent was taken and the study was approved by Institute Ethics Committee. Each blood sample was centrifuged at 3000 rpm for 10 minutes at 4°C and plasma was separated and stored at -80°C until NMR experiments were carried out. Proton spectra of blood plasma were carried out at 700 MHz NMR spectrometer (Agilent, USA) at 25°C using a 1D CPMG pulse sequence with water presaturation. Sixty four scans were an acquired using relaxation delay 70s and with a spectral width of 9124.1Hz and an echo time of 15ms. 2D NMR Spectroscopy was carried out for assignment of resonances of 1D spectrum. The calculated concentrations of metabolites were determined by comparing the integrated intensity of isolated resonance of the compounds of interest with that of the intensity of the Formate signal. For comparison between the two groups, unpaired Mann-Whitney U test was used. A p-value < 0.05 was considered significant. Statistical analysis was carried out using SPSS software (SPSS Inc. Chicago, IL, USA). Both univariate (receiver operating characteristics (ROC) curve analysis) and multivariate analyses (partial least squares–discriminant analyses PLS-DA, variable importance to projection (VIP) score) were carried out using MetaboAnalyst 3.0.
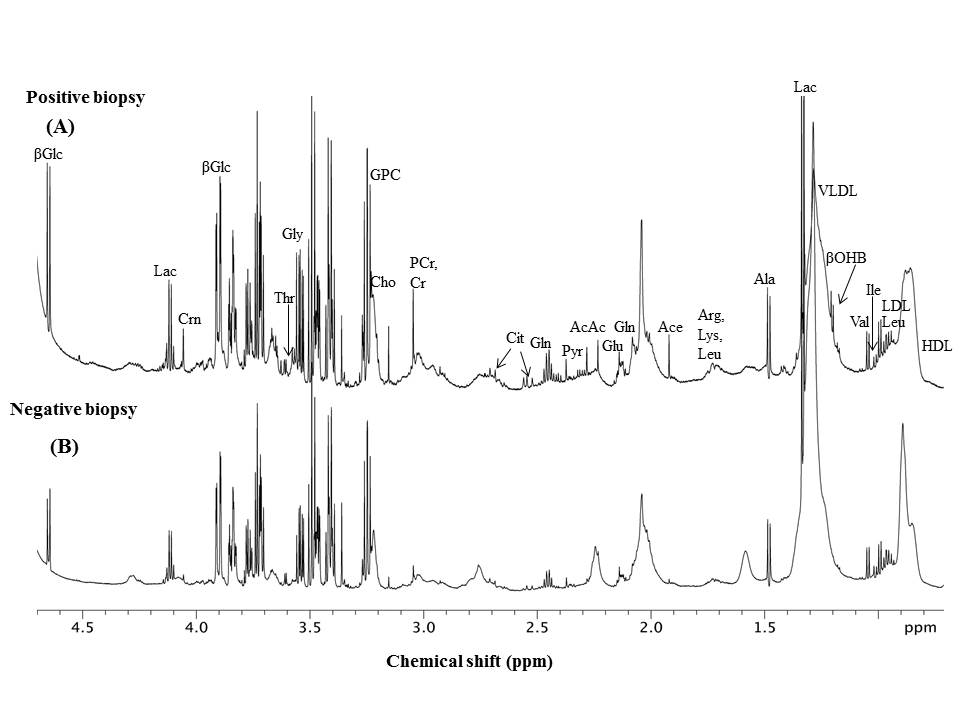
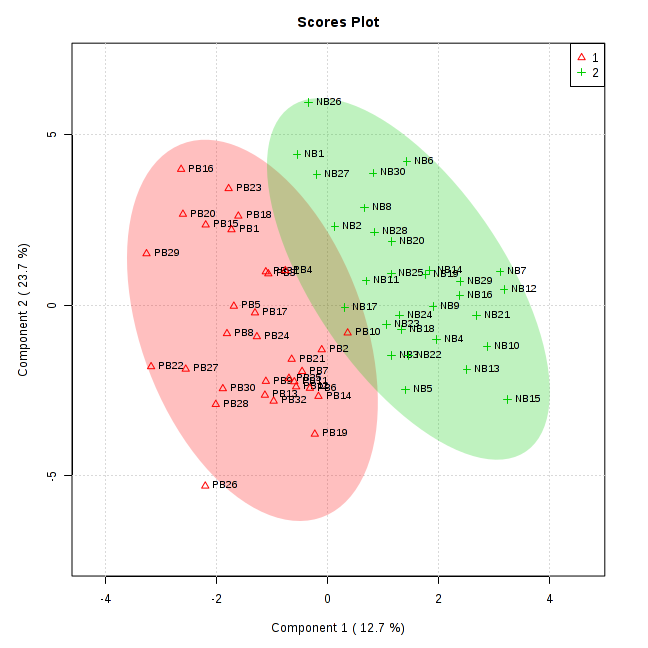
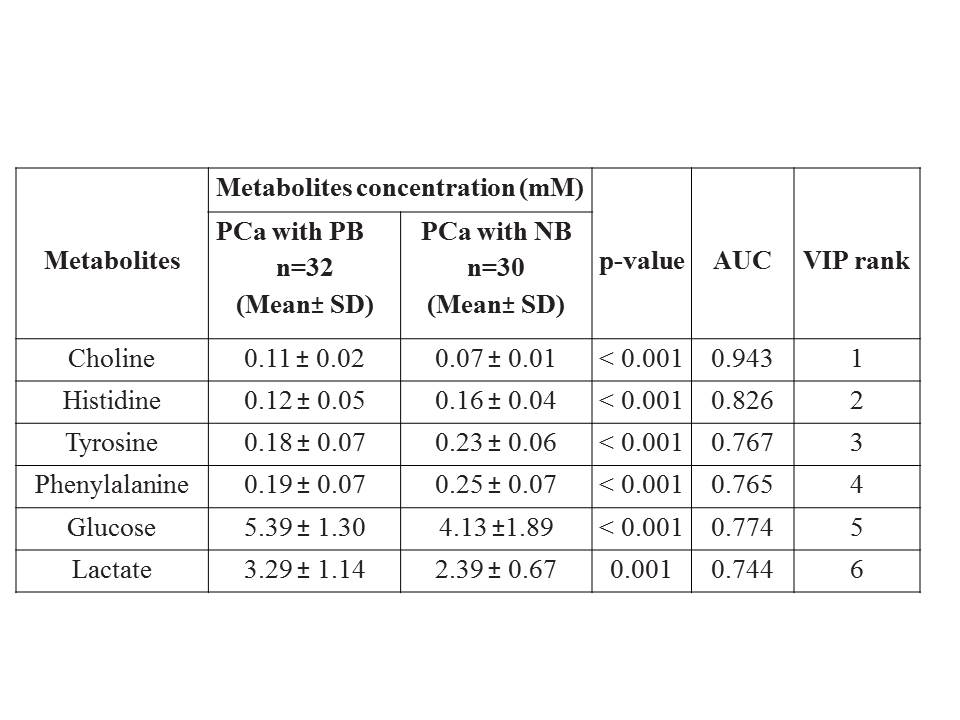
Result: Figure 1 shows the representative aliphatic region of 1D proton NMR spectrum of blood plasma sample of a PCa patient with PB (A) and NB (B). In all, 32 metabolites were assigned using 1D and 2D NMR. For the concentration [mM (mean ± SD)] of 6 metabolites that showed significant (< 0.05) differences, AUC values obtained using univariate ROC curve analyses and VIP score (>1) between PCa patients with PB and NB, are presented in Table 1. Figure 2 shows the PLS -DA score plot, which signifies a clear discrimination between PCa patients with PB and NB.
Discussion: A significantly higher concentration of choline (Cho) was observed in blood plasma of PCa patients with PB as compared to NB, which is associated with the breakdown of membrane phospholipids during malignant transformation of prostatic epithelial cells1. Further, a significantly higher concertration of lactate2 (Lac) in blood plasma of PB was seen as compared to the NB. Lactate as a “hypoxic” waste product may increase glucose uptake for bioenergetics metabolism. Glucose (Glc) was also higher in PB patients as compared to the patients with NB. Blood plasma glucose may have a direct role in cancer prognosis as it is a key nutrient for proliferating cells3. A significantly lower concentration of aromatic amino acids such as tyrosine (Tyr), phenylalanine (Phe) and histidine (His) were seen in blood plasma of PB patients as compared to patients with which NB indicates an increased protein turnover involved in cancer progression4. The univariate ROC curve analyses indicated that in blood plasma, the metabolites such as Cho and His showed AUC with high value (0.943 and 0.826, respectively), whereas AUC for Lac was 0.744 , which is less significant as compared to Glc, Tyr and Phe. Table 1 shows the six VIP ranked metabolites which contribute to cancer development. Figure 2 shows a PLS-DA classification score plot that depicts the differentiation of PCa patients with PB and NB in separate quadrant.
Conclusion: The present study revealed the distinction of metabolic profiling of blood plasma of PCa patients with positive biospy from that of patients with negative biopsy implying that NMR based metabolomics may provide an insight to understand the metabolic alterations that occurs in these PCa patients.
Acknowledgements
No acknowledgement found.References
(1). Johansson M, Van Guelpen B, Vollset SE et al. Cancer Epidemiol Biomarkers Prev. 2009;18(5):1538-43. (2). Nagrath D, Caneba C, Karedath T et al. Biochim Biophys Acta. 2011, 1807(6):650-63. (3). Wulaningsih W, Holmberg L, Garmo H et al. PLoS One. 2013, 8(1): e54944. (4). Dereziński P, Klupczynska A, Sawicki W et al. International Journal of Medical Sciences. 2017, 14 (1):1-12.Figures