4006
17O bolus fluxes in rat head at 21.1 T1NHMFL/FSU, Tallahassee, FL, United States, 2FSU, Tallahassee, FL, United States, 3Heidelberg University, Mannheim, Germany, 4NUKEM Isotopes, Alzenay, Germany
Synopsis
17O MRI is an attractive and promising goal utilizing ultra-high magnetic fields. The current study is devoted to the time changes of 17O MR signals detectable in a rat head at 21.1 T using bolus injection of 17O labeled water-17O and glucose-17O. The time course of 17O-water revealed a two stage process of distribution. During glucose injection the time course has the same stages as for water, and the third stage represents glucose metabolism. The shape of the high resolution glucose time course is important for the accurate determination of tissue glucose consumption.
Introduction
The importance and potential of ultra-high magnetic field MRI for humans (up to 20 T) is under investigation across-the-board 1. Detecting 17O is an attractive and promising goal of utilizing MRI at ultra-high magnetic fields 2-5. Currently, the naturally abundant 17O MR signal can be used for imaging in vivo in a time frame comparable to sodium MRI. This study is devoted to the time changes of 17O MR signals detectable in rat head at 21.1 T using 17O labeled water and glucose. 17O MRI expands our capability to conduct non-invasive in vivo investigations.Methods
In vivo fluxes of 17O labeled glucose and water were investigated in a rat head at 21.1 T. The MR experiments were performed using Bruker MRI Avance III console (PV 5.1 software). The in vivo RF probe has a double tuned 17O/1H volume RF coil with an internal diameter of 33 mm, covering the whole rat head. The MR frequency for 17O was 121.65 MHz. The time course was acquired with 90 degree RF pulse of 160 μs, TR time of 90 ms and NA = 166. The time resolution was 15 s/point. 3D MR rat head imaging was accomplished using a modified Bruker UTE pulse sequence with radial sampling having a matrix size =80x112x56, FOV=64x64x64 mm, TR = 15 ms, TE = 0.2 ms, NA= 16, Scan time = 25 min. The time course of 17O MR signal was investigated after IV tail injections of 1 mL PBS solution containing 17% enriched H217O or 1.5 ml of PBS with 1.85 M of 6-17O 47% enriched D-glucose. The bolus IV injections in the rat tail had a duration of 1.5 min. The in vivo experiments were performed using 3 male Fisher 344 rats (~ 200 g). All animal experiments were conducted according to the protocols approved by The Florida State University ACUC.
Results and Discussion
The time course of water-17O in rat head can be well fitted by two exponential components (Fig. 1) with k1w = 0.62 ± 0.01 min-1 and k2w = 0.088 ± 0.001 min-1. The fast component may represent a quick water-17O equilibration in a blood pool and rat brain, while the slow component may represent a distribution of water-17O throughout the rat body. At 21.1T, 17O MR signals of glucose-6 provide a distinct separation between peaks of water-17O and 17O in glucose-6 6. The ultra-high magnetic field allows convenient and quick observation of changes in the glucose level for each animal during injection and metabolism. The time course of the 17O glucose-6 peak (Fig. 2) demonstrates a comparable fast changing component k1g = 0.82 ± 0.08 min-1 as in water-17O. The slowly changing components of the time course represent distribution of glucose in the rat body and, consequently, its metabolism. The corresponding fit of the glucose peak decay by three exponential functions gives additional parameters k2g = 0.13 ± 0.04 min-1 and k3g = 0.02 ± 0.002 min-1. The parallel time course changes of labeled water-17O after glucose injection (Fig.3) demonstrate a linear change of metabolic water during almost two hours. Using the initial natural abundance of 17O at the beginning of the time course for 100% (which represent 16.2 µM/g of 17O) the linear rate of the water-17O increase is 1.8 *10-3 µM/g/min. The 3D 17O MR images (Fig. 4) demonstrate sensitivity for the images with resolution of 1x1x1 mm for natural oxygen abundance and during water-17O intervention.
Conclusion
The time course of 17O labeled water injection in rat head revealed a two stage process of 17O equilibration. The first stage represents a bolus passage and the following blood and brain pool equilibration, and the second stage represents a distribution of labeled water around the rat body. During glucose injection, after first two stages, which are comparable with water, there is a third stage representing a glucose metabolism. The shape of the glucose time course is important for the accurate determination of the glucose consumption. The 17O MR images 3D 17O MRI with resolution of 1x1x1 mm are feasible in a rat head for natural abundance of oxygen and a variety of the labeled 17O compounds.Acknowledgements
The study was performed at the National High Magnetic Field Laboratory (Tallahassee) supported by NSF, grant No. DMR-115490. Many thanks to Richard Desilets, Ashley Blue, Jason Kitchen, Malathy Elumalai, and Peter Gor’kov for their valuable help and support with RF probes.References
Budinger T, Bird M, Frydman L, et al. Towards 20 T magnetic resonance for human brain studies: opportunities for discovery and neuroscience rationale. MAGMA, Magnetic Resonance Materials in Physics, Biology and Medicine 2016; 1-23.
Zhu X, Chen W. In vivo oxygen-17 NMR for imaging brain oxygen metabolism at high field. Progress in NMR spectroscopy 2011; 59: 319-335.
Borowiak R, Reichardt W, Kurzhunov D, et al. Initial investigation of glucose metabolism in mouse brain using enriched 17O-glucose and dynamic 17O-MRS. NMR in Biomedicine, 2017; 30(8): e3724.
Kurzhunov D, Borowiak R, Hass H, et al. Quantification of oxygen metabolic rates in human brain with dynamic 17O MRI: profile likelihood analysis. Magn Reson Med. 2017; 78(3): 1157-1167.
Atkinson I, Thulborn K. Feasibility of mapping the tissue mass corrected bioscale of cerebral metabolic rate of oxygen consumption using 17-oxygen and 23-sodium MR imaging in a human brain at 9.4 T. NeuroImage 2010; 51: 723-733.
Schepkin V, Neubauer A, Schuch C, et al. The first observation of 17O MRI in normal rats at 21.1 T. Proceedings of the 25th Annual Meeting of the ISMRM, Honolulu, Hawaii, 2017.
Figures
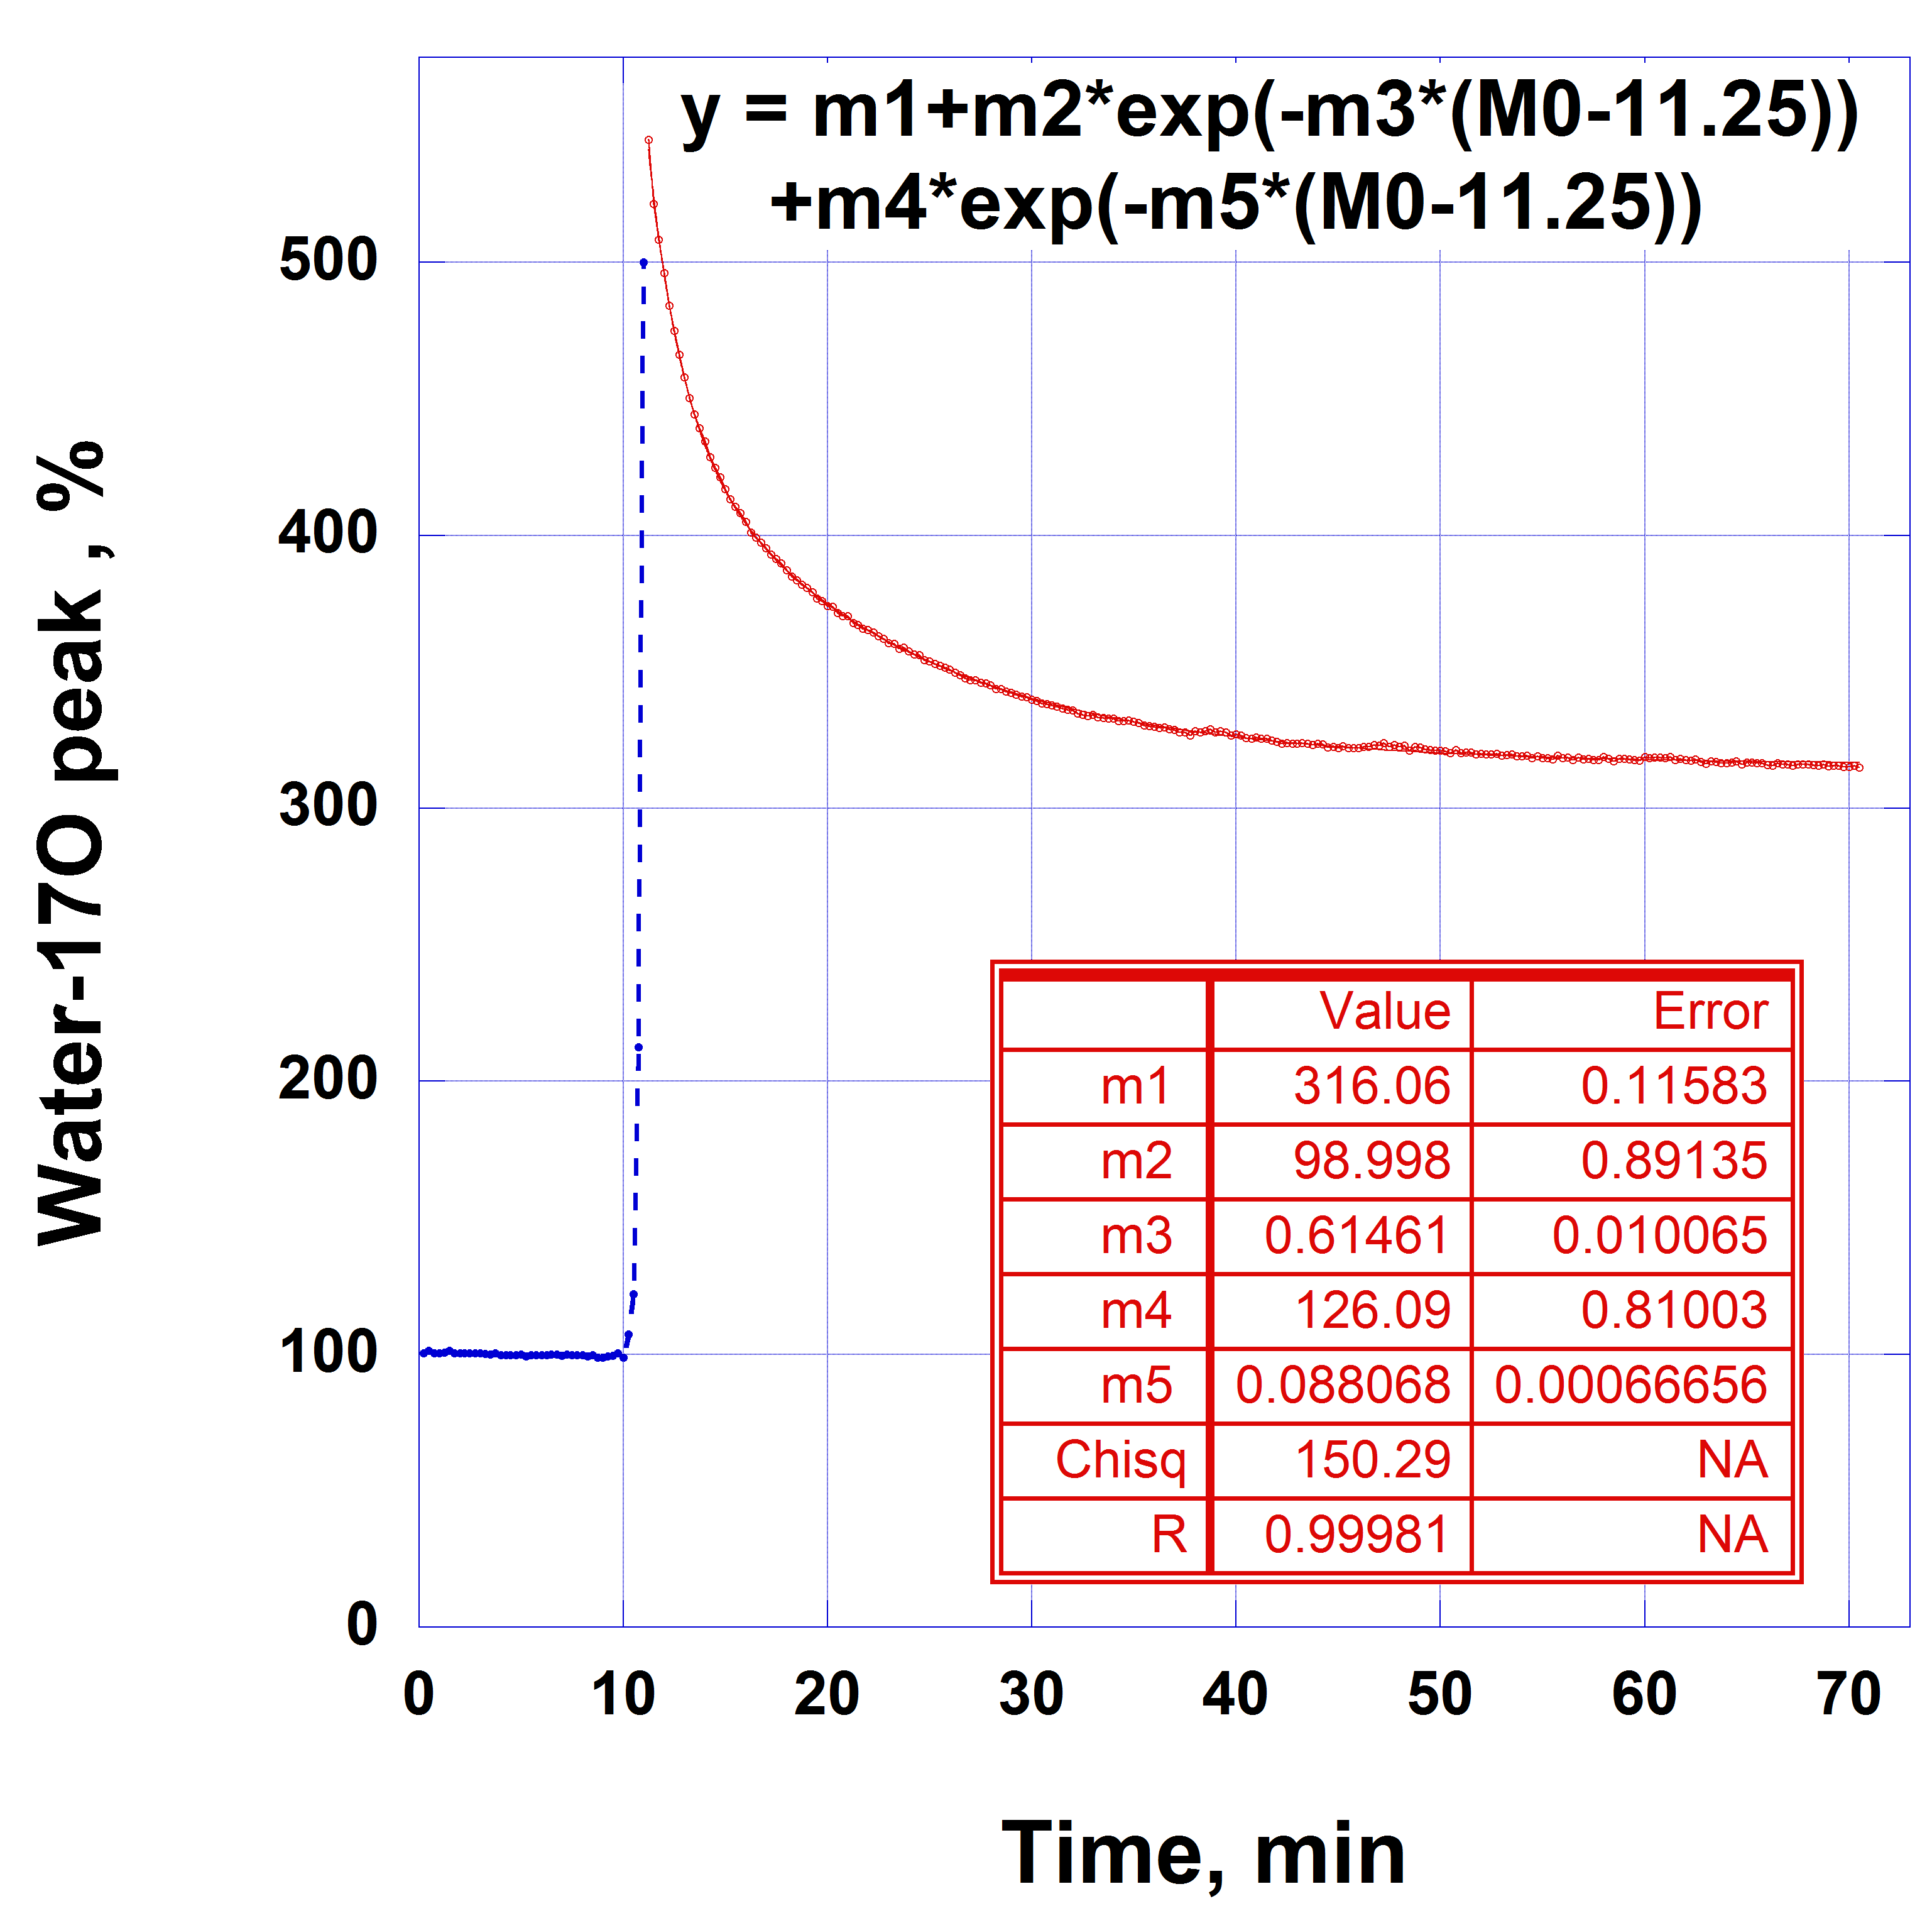
Fig. 1. Representative time course of 17O in water MR peak in a normal rat head after bolus injection of 1 ml of water in PBS with final 17O enrichment of 17%. The data (15 s/point) was well-fitted by two exponential functions with k1w=0.62 min-1 and k2w = 0.088 min-1. The initial 100% level corresponds to the natural abundance of the 17O signal. The injection (duration = 1 min) was started 10 min after beginning measurements.
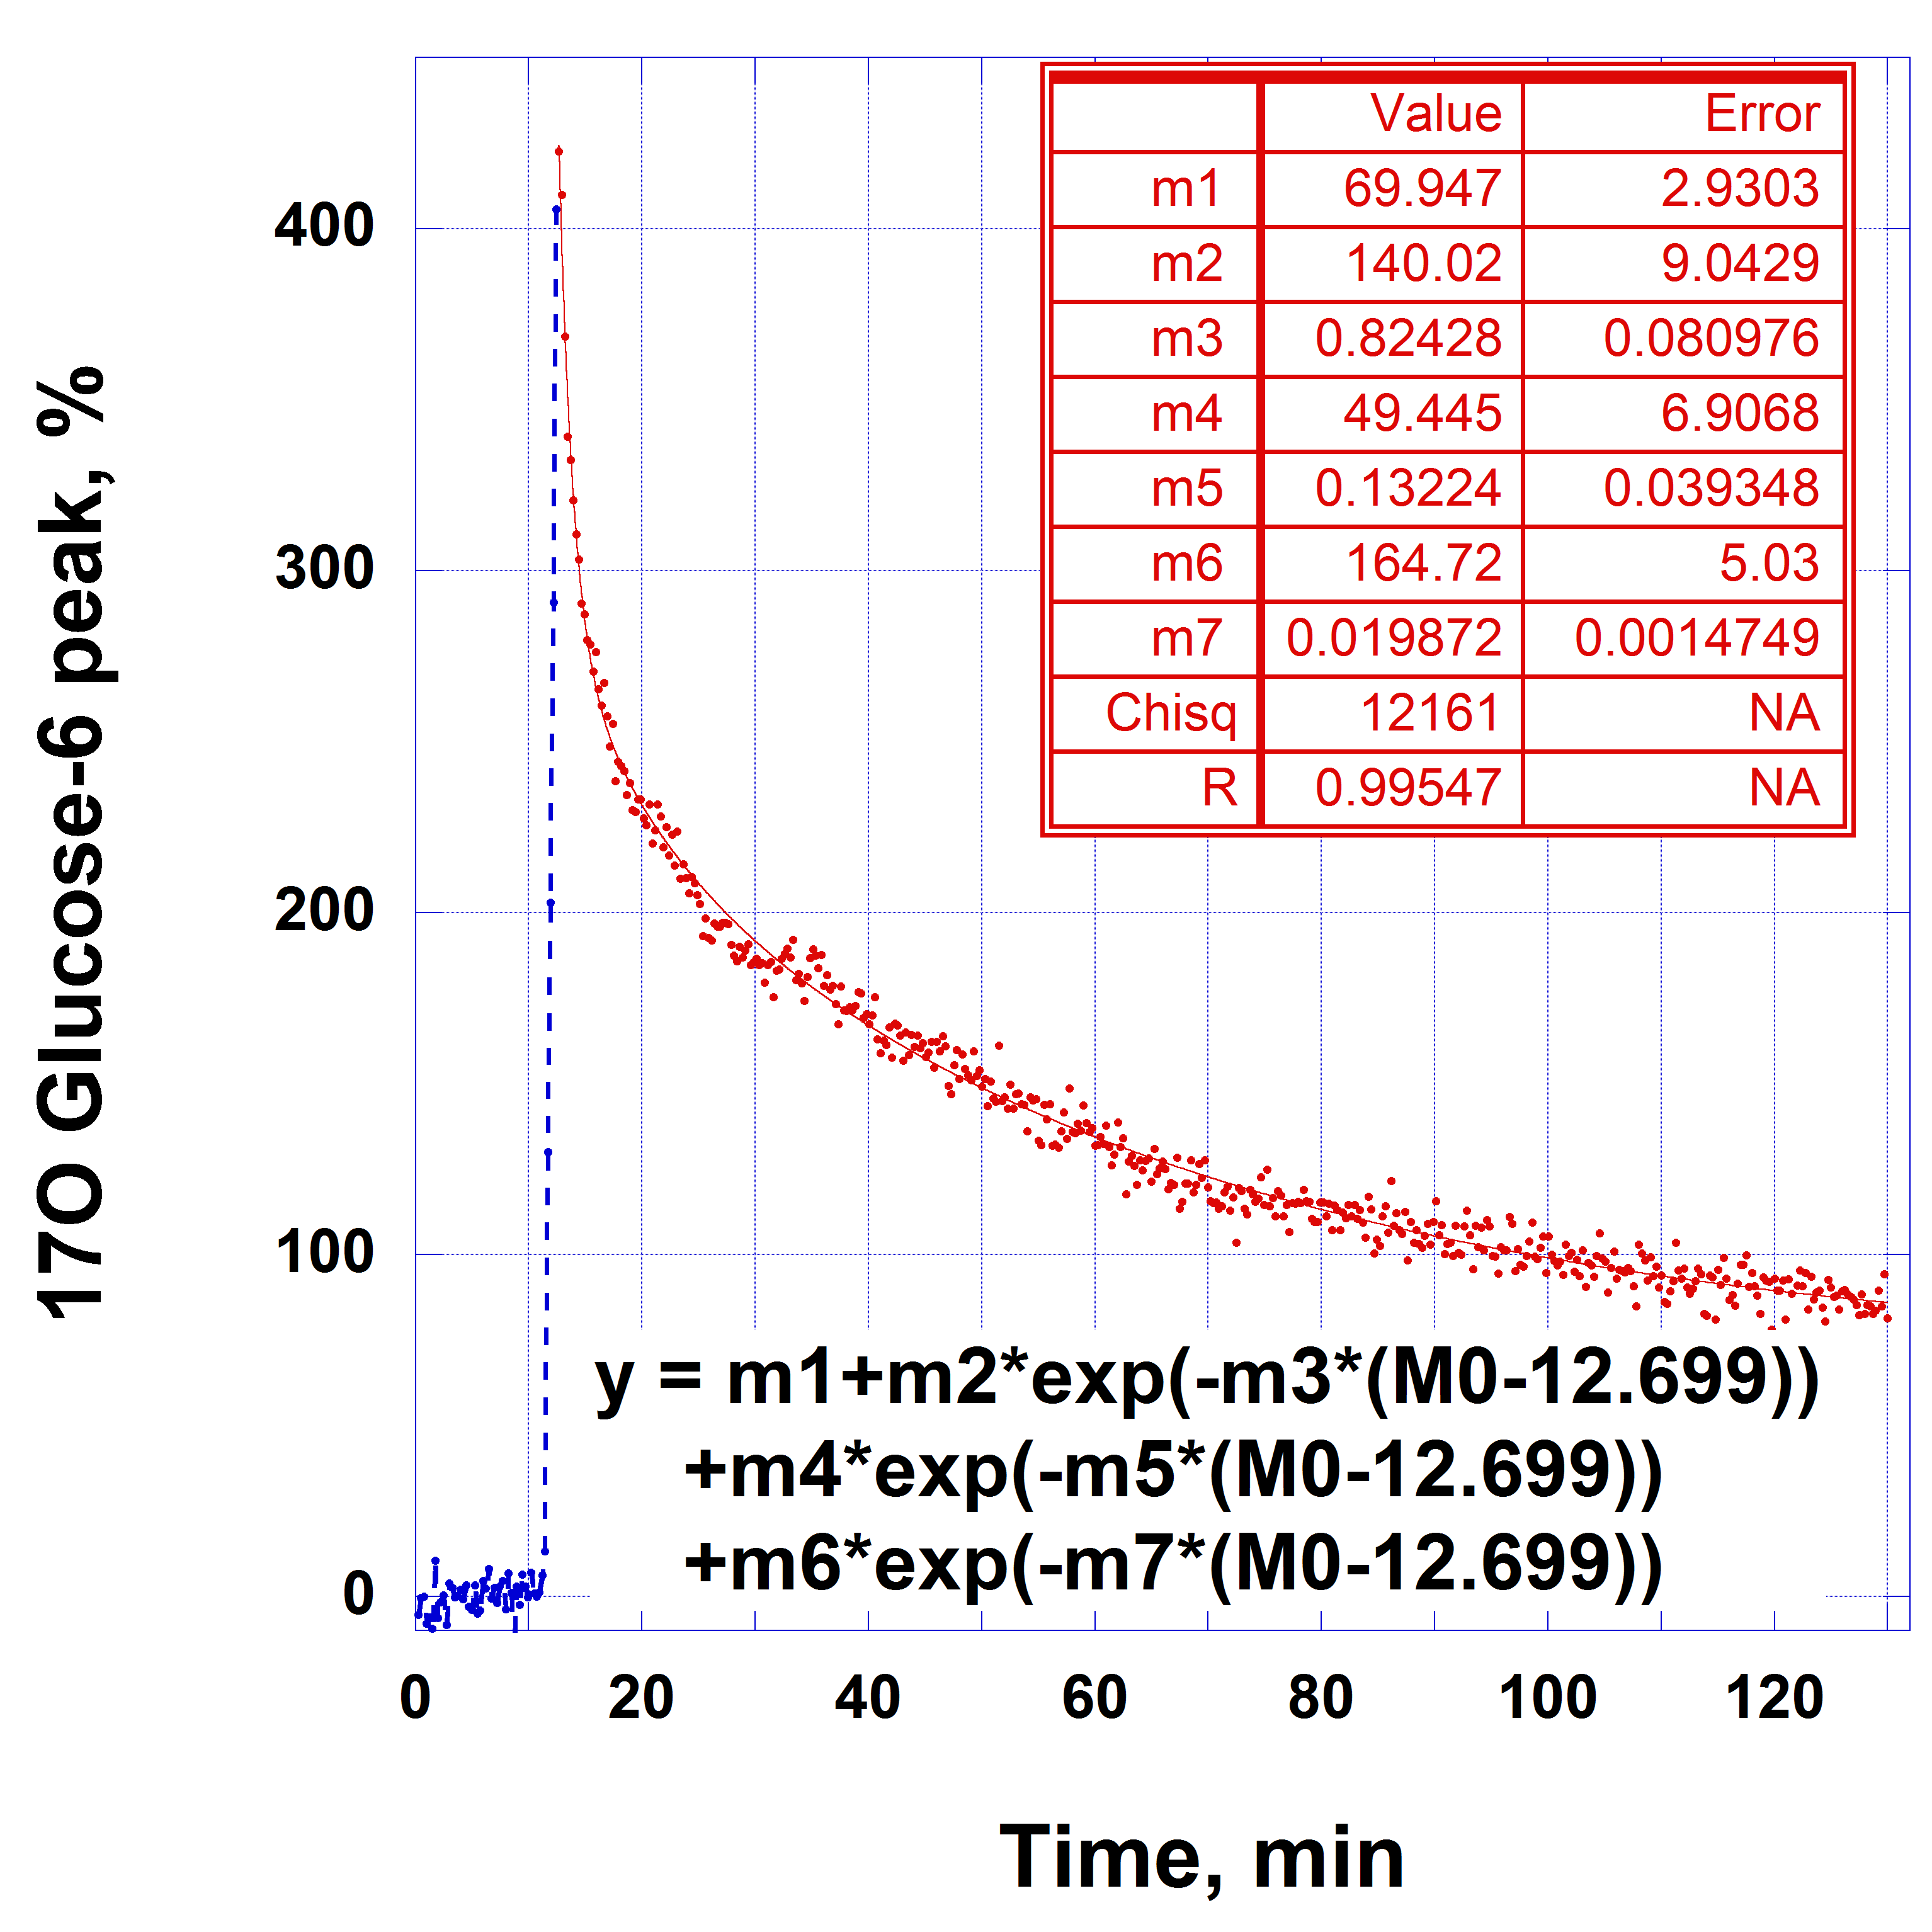
Fig. 2. Representative time course of 17O glucose-6 MR peak in the normal rat head after 1.5 ml bolus injection of 17O enriched glucose-6 (47%) in PBS with concentration of 1.85 M. The data (15 s/point) was fitted by three exponential functions with k1g = 0.82 ± 0.08 min-1, k2g = 0.13 ± 0.04 min-1 and k3g = 0.02 ± 0.002 min-1. The injection (duration =1.5 min) was introduced 10 min after starting MR measurements.
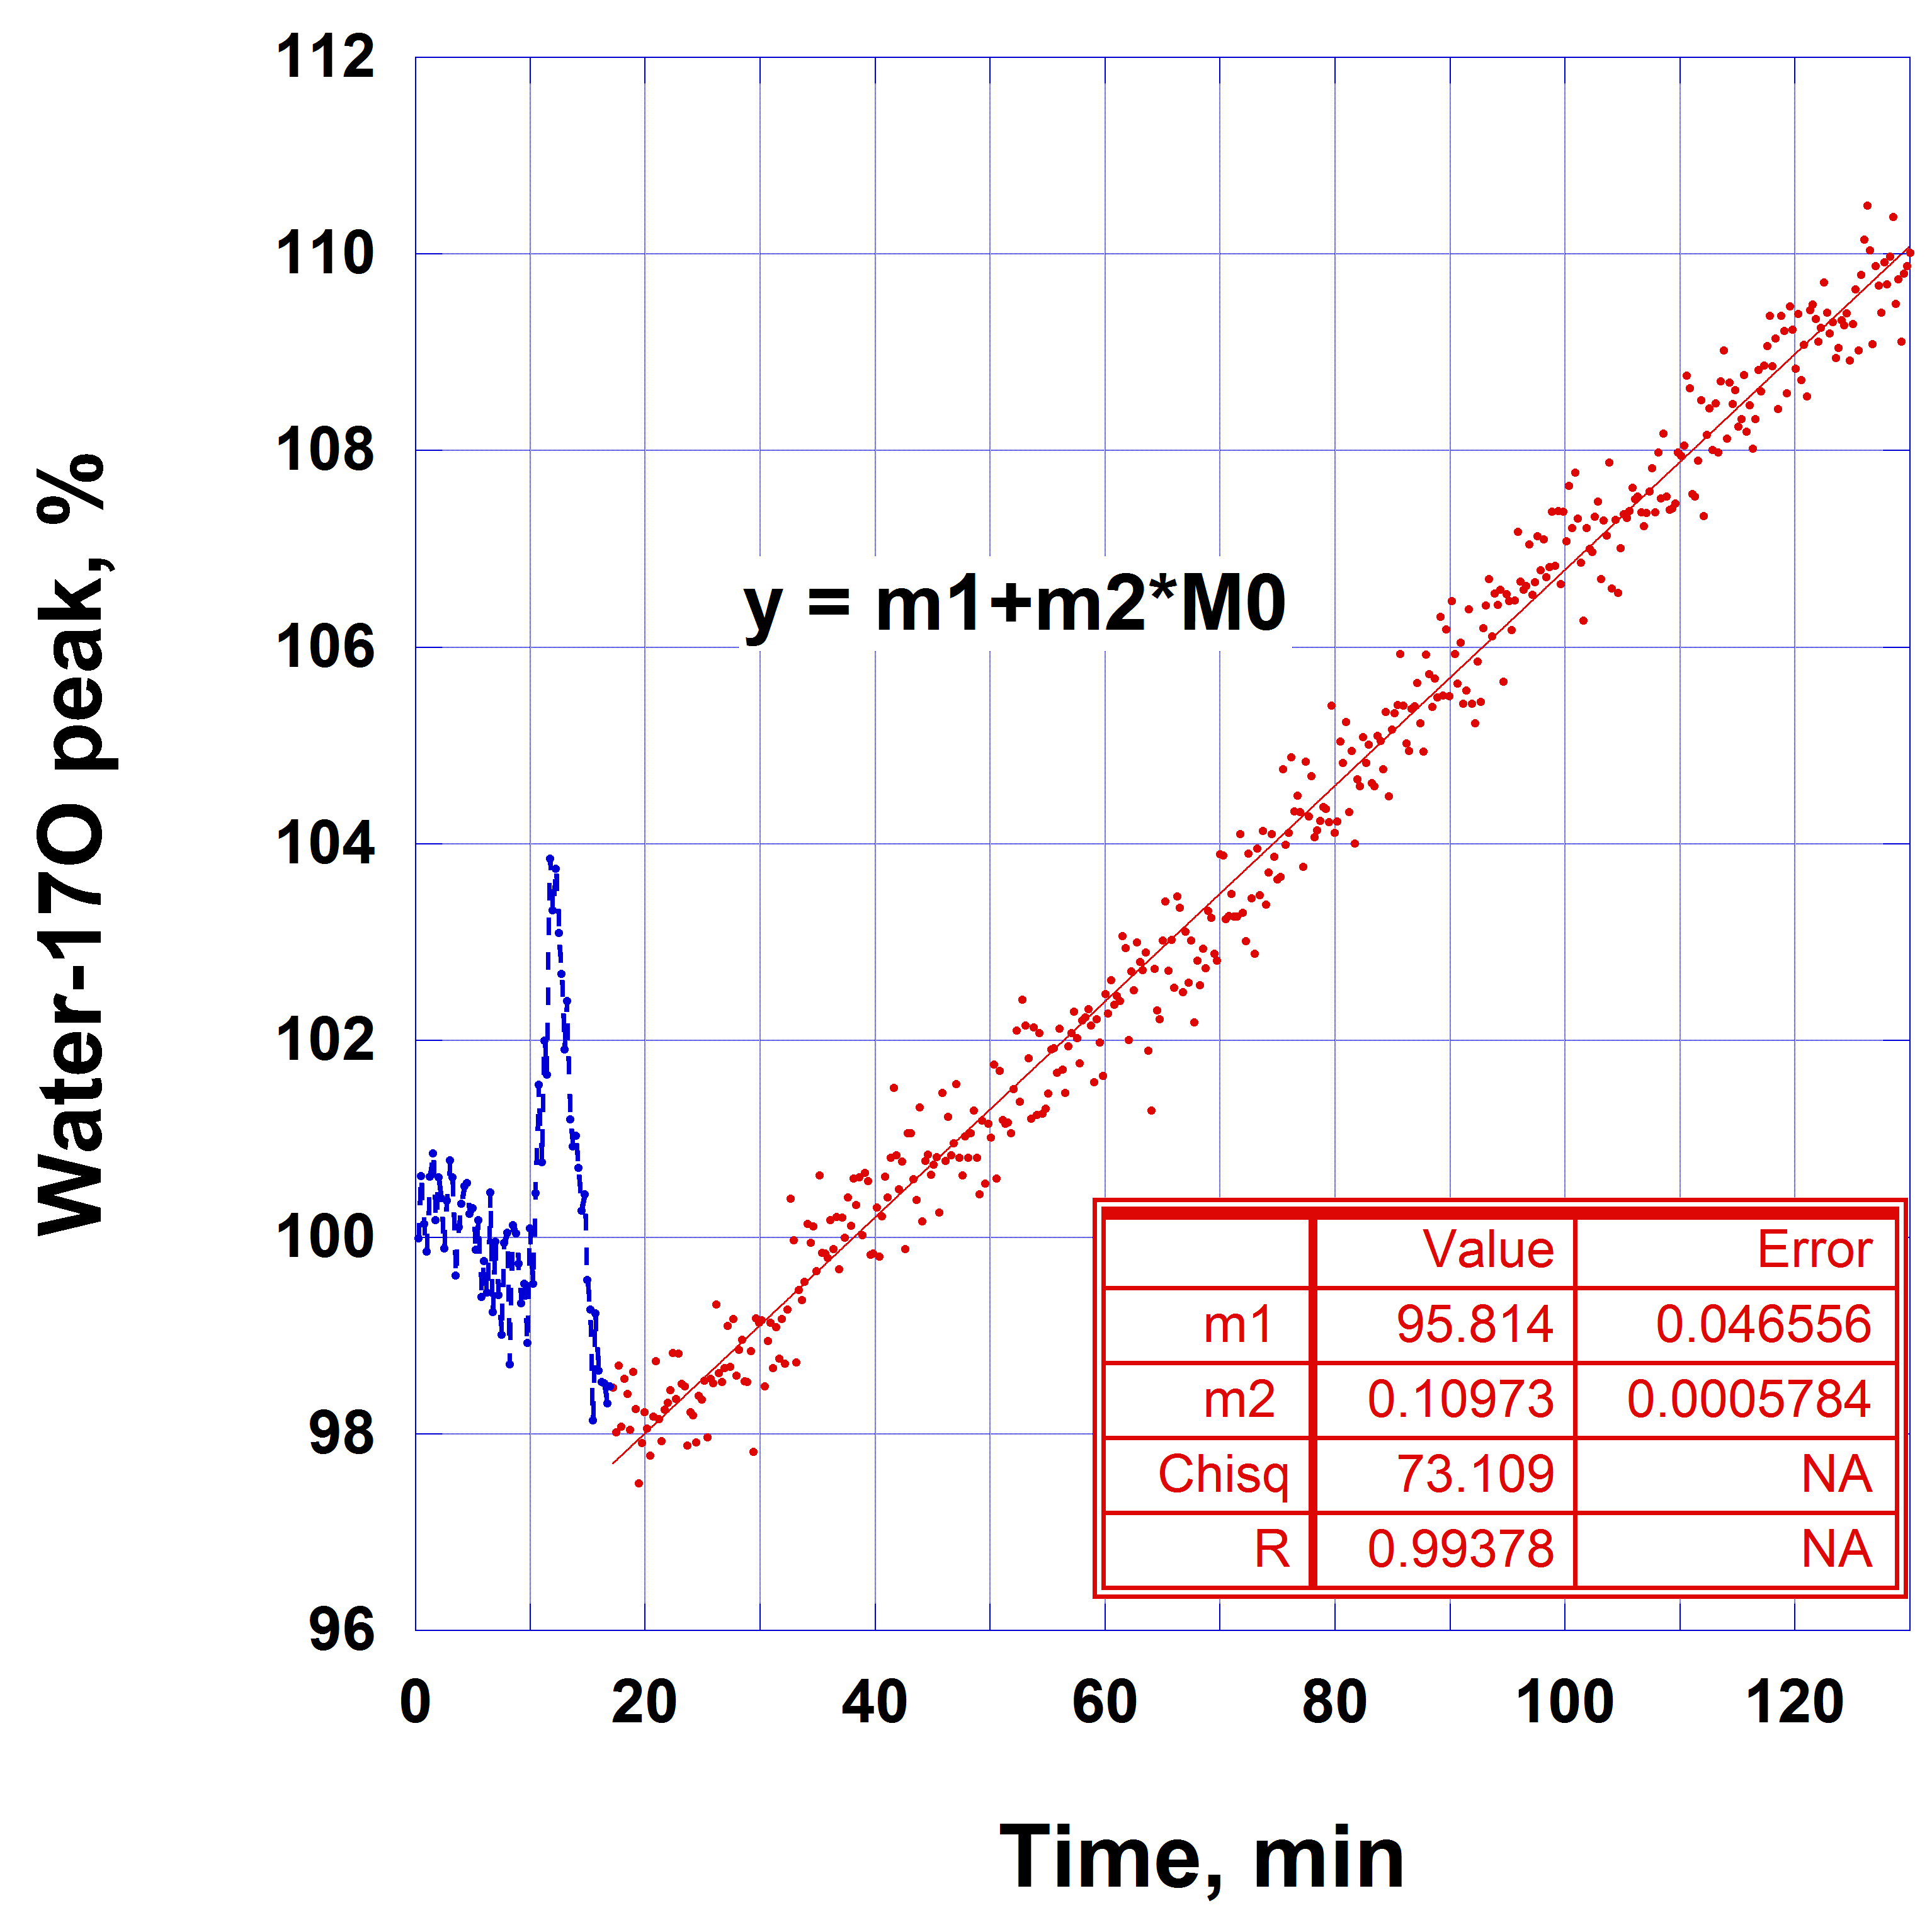
Fig. 3. Representative time course of 17O MR water peak in rat head after bolus injection of 17O enriched glucose-6 (47%) in PBS with concentration of 1.85 M. Initial amplitude of 100% corresponds to 16.2 µM/g of 17O in the head tissue. The initial peak after injection is due to the presence of some water-17O in the glucose-6 solution.
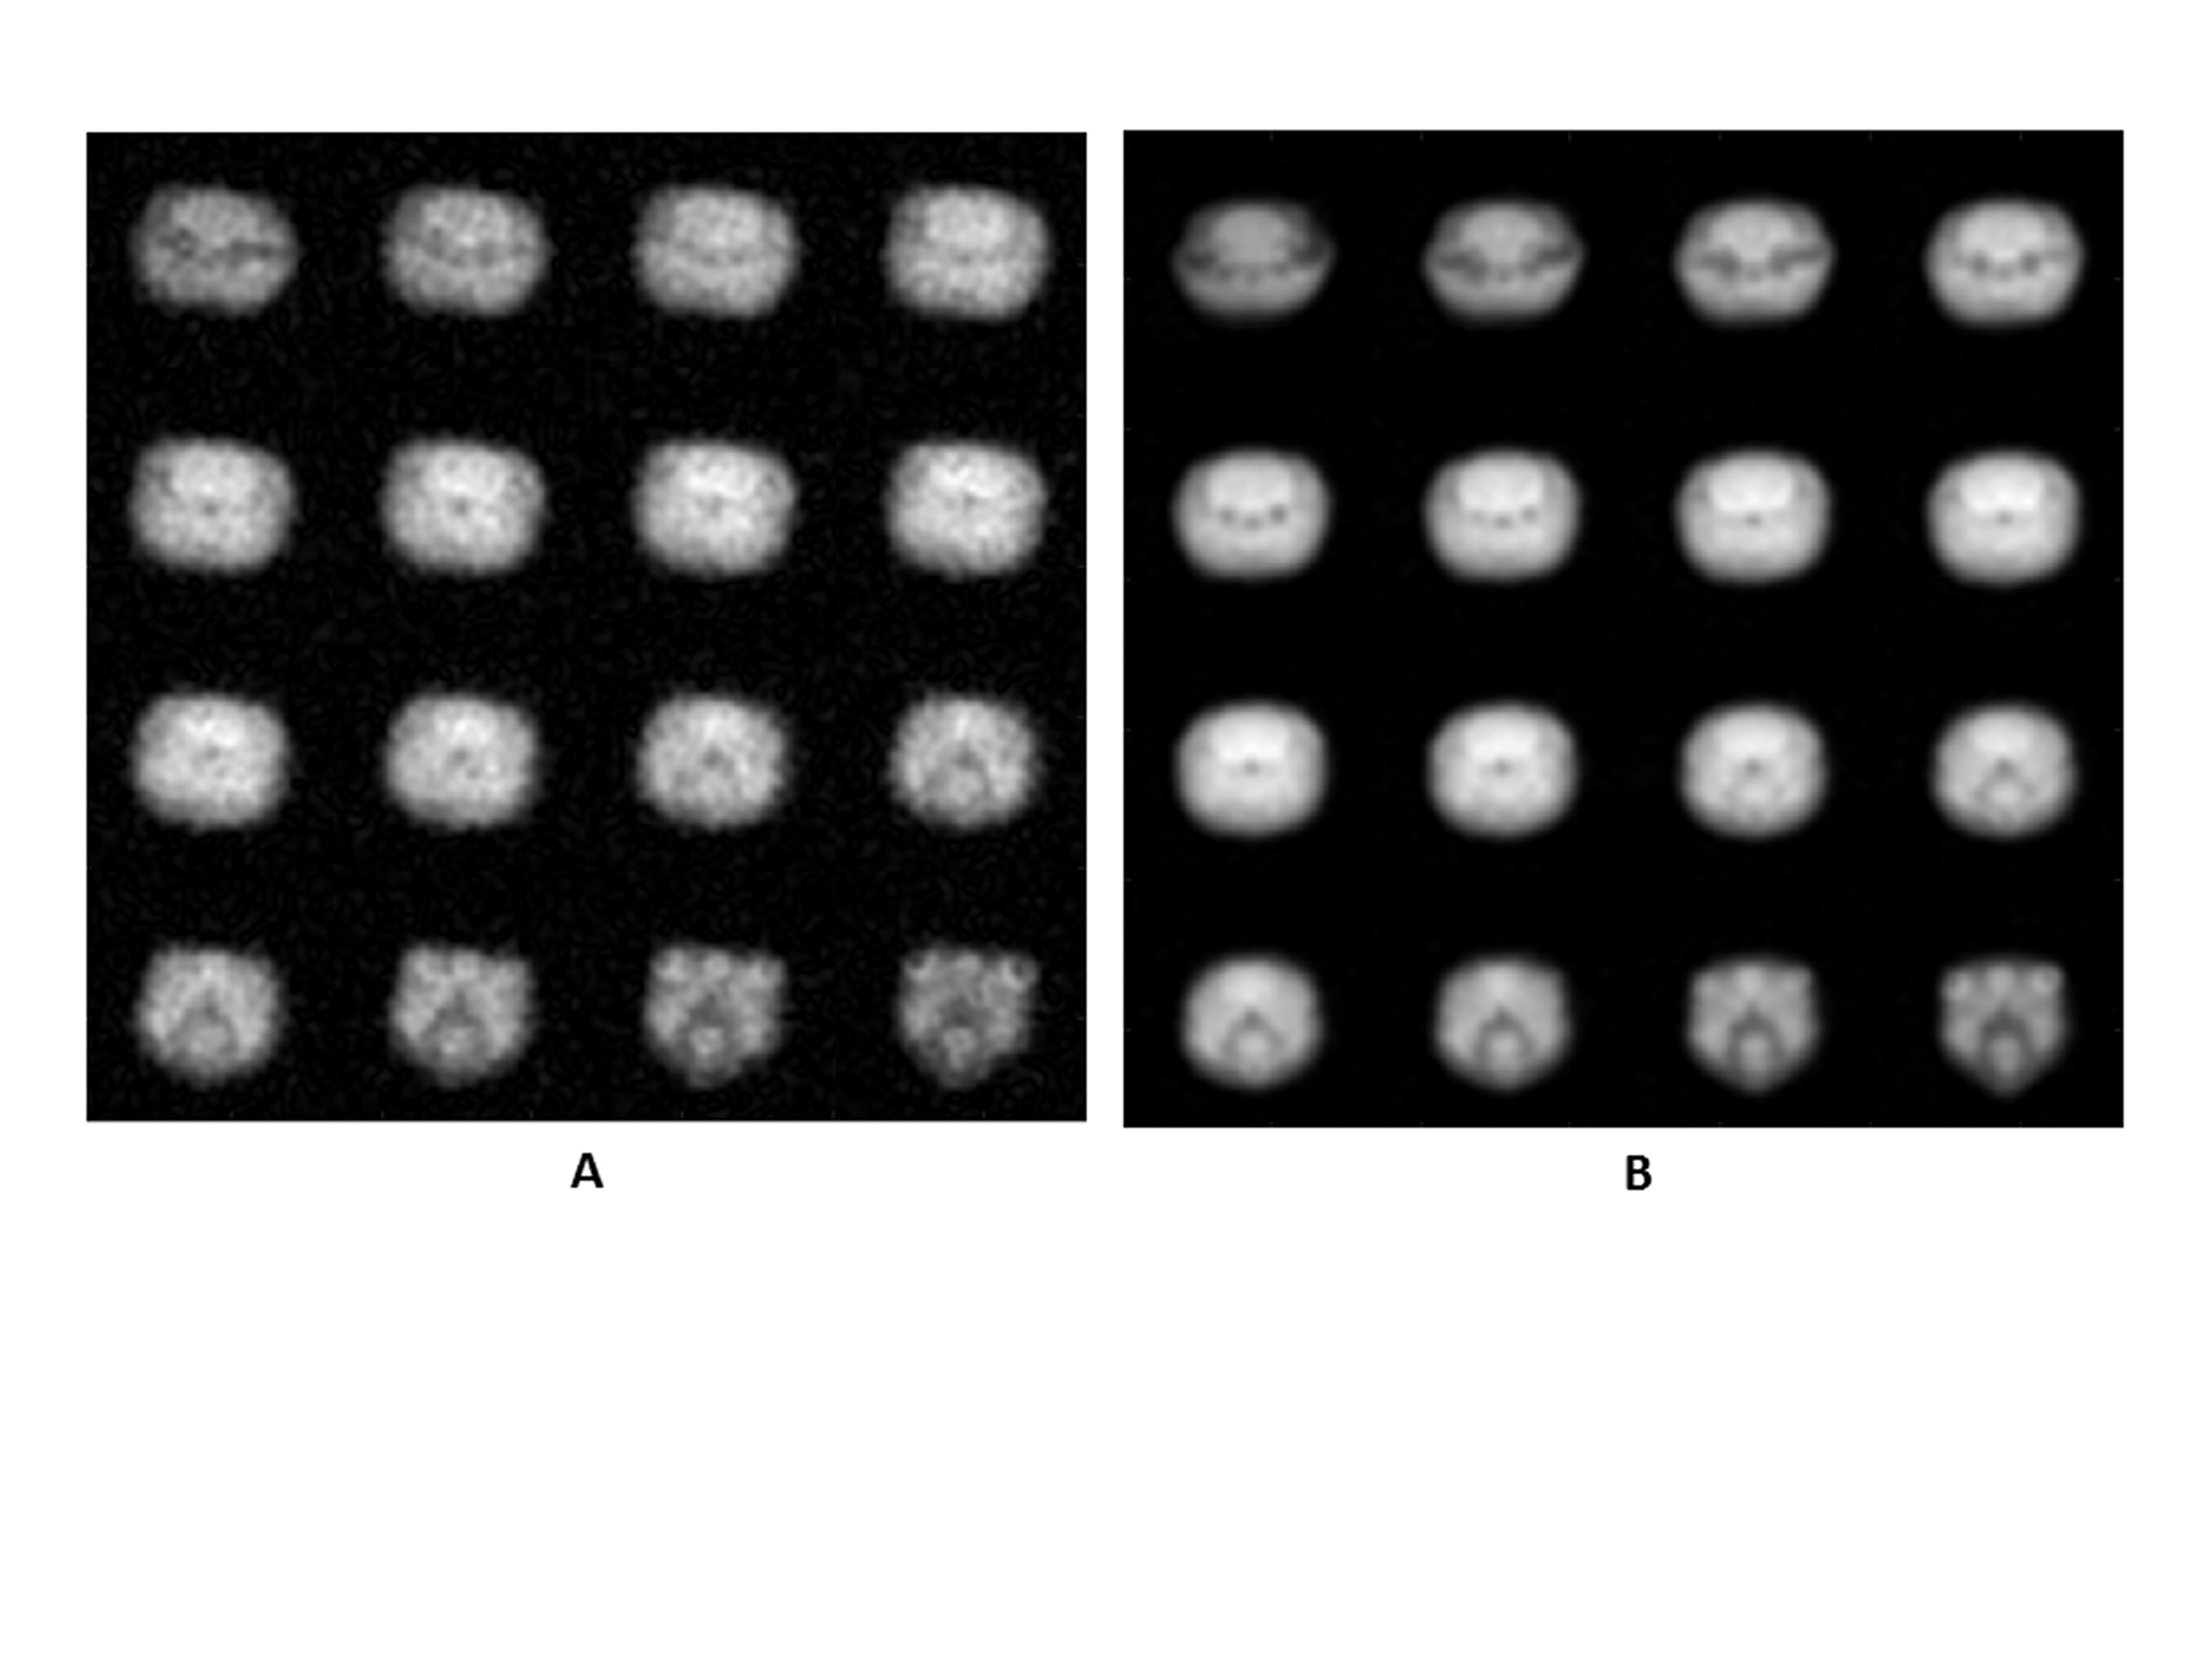
Fig. 4. 17O 3D MRI of rat head before (A) and 1.5 hours after (B) 1 mL bolus injection of water in PBS with final 17O enrichment of 17%. Scan time 25 min, resolution 1x1x1 mm.