4004
Use of dissolved-phase 129Xe imaging to visualize gas uptake and distribution in the free-breathing mouseLuis Loza1, Stephen Kadlecek1, Mehrdad Pourfathi1, Kai Ruppert1, Hooman Hamedani1, Ian Duncan1, and Rahim R. Rizi1
1Radiology, University of Pennsylvania, Philadelphia, PA, United States
Synopsis
The lung is an intrinsically difficult organ to image using conventional MRI. Although global structural features and major abnormalities are detectable using conventional MRI, lung structure on the vascular level is prohibitively difficult to image. Hyperpolarized gas MRI provides high enough signal to obtain high-resolution images of lung structure at the acinar level. Furthermore, with the use of hyperpolarized xenon MRI, dynamic images of xenon dissolution are made obtainable given xenon’s high solubility in blood and tissue. By applying decreasingly destructive pulses, the uptake and distribution of the gas throughout the body becomes visible.
Introduction
Like hyperpolarized 3He, 129Xe is used to visualize lung ventilation and gas redistribution/diffusion. However, its blood/tissue solubility and phase-specific chemical shift also allow visualization of gas uptake into tissue and blood, and flow into the heart, vasculature and other organs. We present images acquired in a free-breathing mouse that highlight and quantify these processes.Materials and Methods
Images were acquired in three BAL/b mice using a Bruker 9.4T spectrometer with a gradient insert. During imaging, animals breathed freely from a flowing mixture of 100ml/min 30/70% O2/N2 and 40ml/min hyperpolarized 129Xe to maintain FiO2=0.21. Ultra-short echo time (UTE) pulse sequences utilized varying repetition times and flip-angles with TE = 98μs, 200 kHz acquisition bandwidth, FOV = 35x25mm, 401 spokes acquired and regridded to a 128x128 matrix. Because the dissolved gas signal buildup is quickly limited by RF-induced relaxation, each TR and flip-angle combination may be characterized more simply by its relaxivity or effective T1. In this study we explored dissolved gas redistribution under a range of effective T1s from 0.076 to 6.6s.Results and Discussion
Figure 1 shows representative images centered on the cardiopulmonary system, acquired with decreasingly destructive RF excitations (see caption). Parenchymal tissue signal saturates quickly, followed by appearance of the lung vasculature (panel 2), left atrium (panel 3), left ventricle (panels 3 and 4), aortic arch (panels 4 and 5), descending aorta (panel 5), and finally distal tissue, vasculature, kidney and vena cava (panel 6). This appearance time can be used to approximate the time required for dissolved gas to reach the corresponding structure; e.g., delayed signal buildup in the aortic arch indicates approximately 1s delay between gas dissolution and arrival at this structure.By repositioning the coil and extending the effective T1 to larger values (Figure 2), arrival of dissolved Xe can be visualized in additional abdominal structures. As T1 approaches 6s, signal in the kidney becomes more intense, and liver and gut become highlighted.Conclusion
Use of high-resolution, dynamic images of hyperpolarized xenon dissolution and flow allows visualization and measurement of gas dynamics that mirror those of oxygen in vivo. By utilizing decreasingly destructive RF pulses, structures more distal to the site of gas exchange become increasingly well visualized. Although many flip-angle and TR combinations are available for these studies, all sequences that destroy the hyperpolarized signal at the same rate are equivalent with respect to specific tissue contrast. Similarly, two equally destructive sequences can be made to yield equivalent S/N if they are averaged for the same period of time. Thus, it is sufficient to fix one parameter (e.g., TR) and vary the other (e.g., flip-angle), while still exploring all possible dissolved phase contrast options. Future work will address the buildup in specific tissues quantitatively with a model of Xe tissue saturation and spin-lattice relaxation.Acknowledgements
No acknowledgement found.References
No reference found.Figures
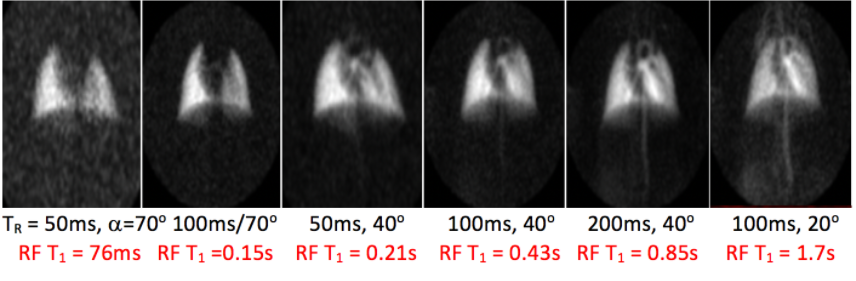
Figure 1: UTE images acquired with flip-angle and TR combinations of (L to R) 70°,50ms; 70°,100ms; 40°,50ms; 40°,100ms; 40°,200ms; 20°,100ms result in RF-induced signal loss rates corresponding to 0.076s, 0.15s, 0.21s, 0.43s, 0.85s and 1.7s, respectively, after dissolution in the lung tissue and blood. Appearance of structures distal to the lung parenchyma when using less destructive parameters indicates the delayed arrival of the dissolved gas.
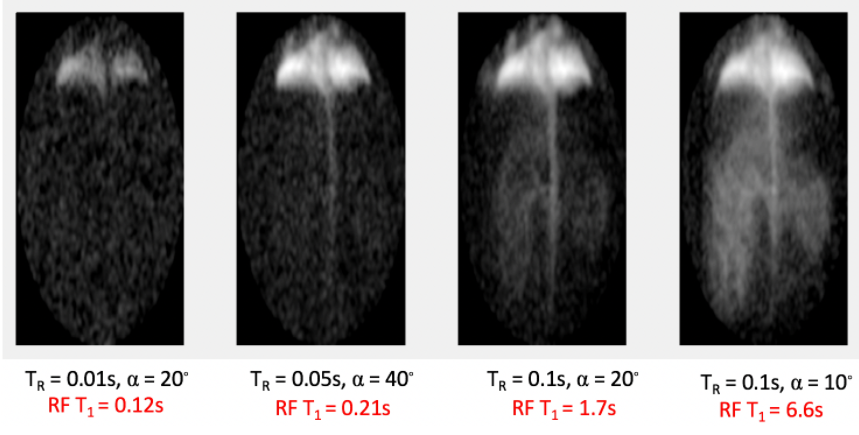
Figure 2: By positioning the coil to cover the lower body and exploring less destructive pulses, distribution of the gas to body fat and abdominal structures can be visualized as well.