4003
3D 7Li Magnetic Resonance Imaging of Brain Lithium Distribution in Bipolar Disorder1Institute of Cellular Medicine, Magnetic Resonance Centre, Newcastle University, Newcastle upon Tyne, United Kingdom, 2Institute of Neuroscience, Newcastle University, Newcastle upon Tyne, United Kingdom
Synopsis
Lithium is a major treatment for bipolar disorder (BD) and the likelihood of a favourable response may be determined by its distribution in the brain. Lithium can be directly detected by magnetic resonance (MR), but this is challenging compared to proton MRI due to lithium’s low therapeutic concentration in brain (<1mM). To overcome this challenge, we implemented a highly efficient balanced steady state free precession (b-SSFP) 7Li-MRI method. We report a 3D 7Li-MRI acquisition with 25mm isotropic resolution, acquired in 8 minutes using a 3T clinical scanner, demonstrating heterogeneity in lithium concentration within the brain in subjects with BD (n=14).
Purpose:
This study aimed to determine a b-SSFP protocol for 7Li-MRI and assess whether gains in image SNR could be achieved compared to conventional spoiled gradient echo (SPGR) imaging, thereby permitting assessment of brain lithium distribution in a clinically relevant scan time.
Materials and Methods:
All subjects in this study were adults taking lithium long-term for BD, with serum levels confirmed in the therapeutic range. MR data were acquired on a Philips 3T Achieva scanner (Philips Medical Systems, Best, The Netherlands) equipped with a quadrature, double tuned 1H/7Li radiofrequency birdcage head coil (RAPID Biomedical, Rimpar, Germany).
A 7Li 3D b-SSFP gradient echo acquisition was acquired in 10 subjects (20 × 19 × 7 acquisition matrix and 24.0 × 25.3 × 25.0 voxel size, 480 × 480 × 175 mm field of view, with TR = 9.4 ms, TE = 4.5 ms, flip angle = 60 degrees, receiver bandwidth = 219 Hz/pixel, 500 averages per dynamic. Data were reconstructed into a 32 × 32 × 7 matrix (voxel size of 15 × 15 × 25 mm). Total acquisition time was eight minutes.
The scan protocol was also applied to phantoms containing lithium to evaluate image uniformity and the relationship between lithium concentration and 7Li signal intensity in b-SSFP images. Six 0.8 L aqueous phantoms were constructed, each containing a different concentration of LiCl (0.5, 0.75, 1.0, 1.5, 2.0 and 4.0 mmol/L) and NaCl at a concentration of 108 mmol/L.
In a further four subjects, 7Li 3D SPGR images (ie, standard gradient echo imaging) were also acquired together with 7Li b-SSFP data to compare the image SNR between the techniques. The 7Li SPGR imaging sequence was acquired with the same acquisition protocol as the 7Li b-SSFP acquisition but TR = 6.7 ms and TE = 2 ms, flip angle was the Ernst angle at 4.6 degrees and averages = 700 to maximise SNR. Each acquisition was eight minutes long and to increase image SNR, three scan dynamics were acquired in each subject (total acquisition 24 minutes) and the data averaged in complex form. Comparably, three 7Li b-SSFP dynamics were acquired in each subject (total acquisition 24 minutes), also averaged in complex form.
A 3D T1-weighted image of brain anatomy was acquired for each subject with a 1H gradient echo sequence (TR = 8.2 ms, TE = 4.6 ms, acquisition matrix = 180 × 200 × 146 mm reconstructed into a matrix size of 240 × 240 × 146 mm, isotropic 1 mm resolution, FOV = 216 × 240 × 175, one average).
All reconstructed lithium images were interpolated bilinearly to match the resolution parameters of the 1H MRI using in-house software written in Matlab® (The Mathworks® Inc., Natick, MA, USA).
7Li images were analysed using ImageJ software1 and Matlab. To determine the relationship between 7Li-MRI signal intensity and lithium concentration, a region of interest (ROI) was placed in the central image slice of each phantom. To evaluate the spatial distribution of 7Li-MRI signal intensity, a volume ROI was placed in each phantom image and the coefficient of variation (COV) measured.
For the comparison of signal intensity between the 7Li b-SSFP and SPGR sequences, mean 7Li-MRI signal amplitude was determined from an intracranial volume ROI drawn on 1H structural scan images in native space. This ROI was also used to determine the COV in 7Li b-SSFP signal intensity.
Results:
In the uniform phantoms, a linear relationship between lithium concentration and 7Li b-SSFP image intensity was observed, with slice profiles through each phantom showing homogeneous signal intensity (Figure 1). In brain, lithium distribution was heterogeneous in all subjects. Figure 2 shows the entire 3D 7Li b-SSFP dataset from one subject; Figure 3 shows 3D 7Li b-SSFP data from a single slice in 8 subjects. The spoiled GE failed to produce interpretable images in three of four subjects due to insufficient signal-to-noise although the technique demonstrated heterogeneous distribution similar to the 3D 7Li b-SSFP image in one subject (Figure 4).
Discussion:
Our data demonstrates that 7Li b-SSFP MRI can rapidly image lithium distribution in the human brain in vivo, providing evidence of that tissue distribution is heterogeneous in BD. The use of an imaging-based acquisition rather than a spectroscopic imaging approach, coupled with the time- and signal- efficient SSFP methods, affords considerable advantages compared to previous reports.2,3,4
Conclusions:
Lithium can be imaged in its target organ, the human brain, in a clinically applicable scan time of eight minutes. Our 7Li b-SSFP MRI notably expands the available methods to investigate the effects of lithium on the brain.
Acknowledgements
With thanks to radiographers at our Centre and to the Medical Research Council, UK for funding this work,References
References:
1. Schneider, C.A.R., W. S. & Eliceiri, K. W (2012) 'NIH Image to ImageJ: 25 years of image analysis', Nature methods, 9(7), 671-675.
2. Lee, J.-H., Adler, C., Norris, M., Chu, W.-J., Fugate, E.M., Strakowski, S.M. and Komoroski, R.A. (2012) '4-T 7Li 3D MR spectroscopy imaging in the brains of bipolar disorder subjects', Magnetic Resonance in Medicine, 68(2), 363-368.
3. Girard, F., Suhara, T., Sassa, T., Okubo, Y., Obata, T., Ikehira, H., Sudo, Y., Koga, M., Yoshioka, H. and Yoshida, K. (2001) 'Li-7 2D CSI of human brain on a clinical scanner', Magnetic Resonance Materials in Physics Biology and Medicine, 13(1), 1-7.
4. Soares, J.C., Boada, F., Spencer, S., Mallinger, A.G., Dippold, C.S., Wells, K.F., Frank, E., Keshavan, M.S., Gershon, S. and Kupfer, D.J. (2001) 'Brain lithium concentrations in bipolar disorder patients: Preliminary Li-7 magnetic resonance studies at 3 T', Biological Psychiatry, 49(5), 437-443.
Figures
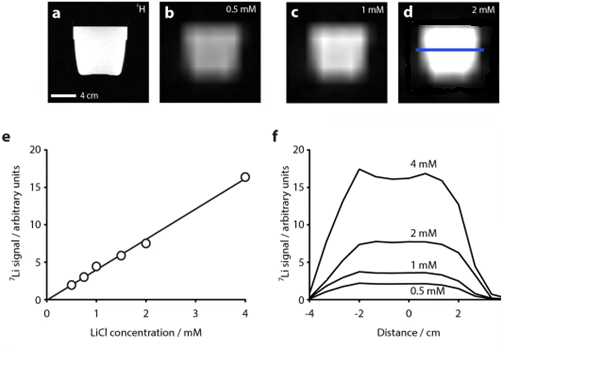
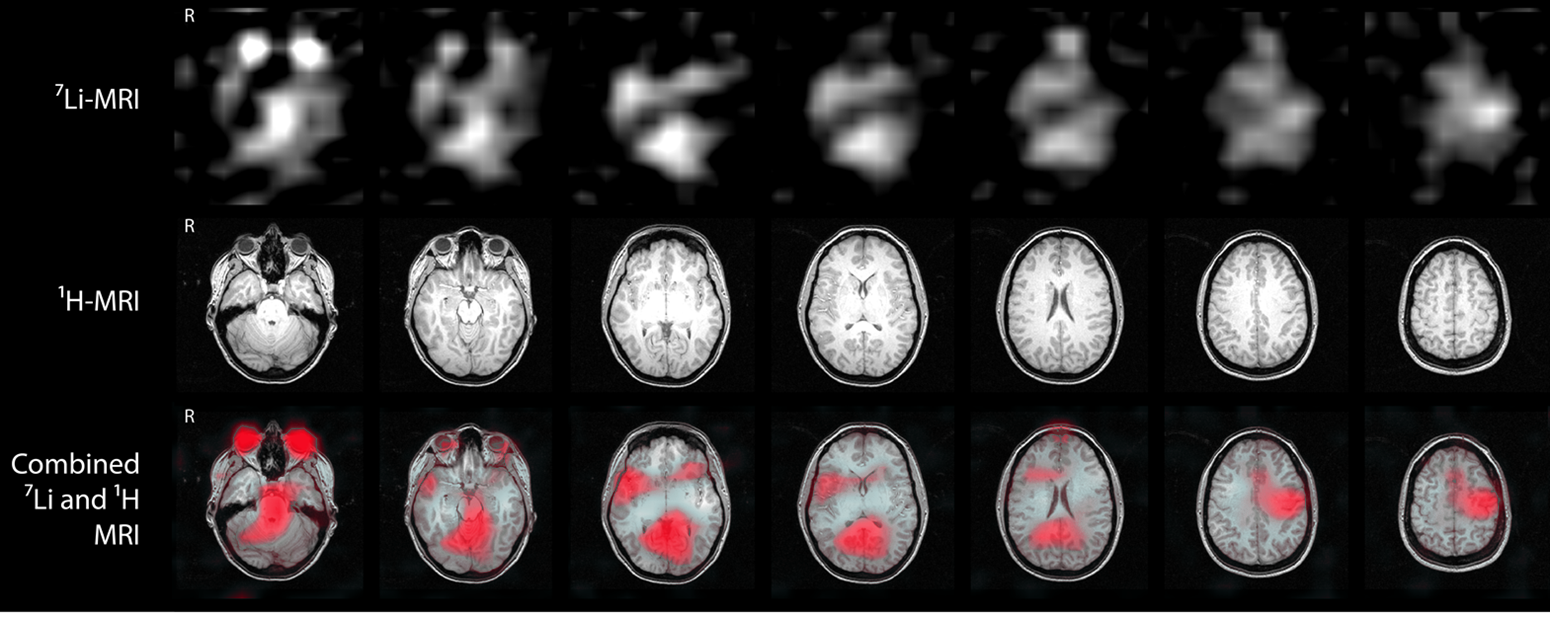
Figure 2: 7Li b-SSFP MRI in a single subject. The 7Li-MRI dataset (upper row) was acquired in 8 minutes and is presented with corresponding 1H-MRI axial images (middle row). The combined images (lower row) show 7Li b-SSFP MRI (in red) overlaid on 1H-MRI images. The distribution of lithium in the brain is heterogeneous and the greatest signal intensity arises from the orbits.
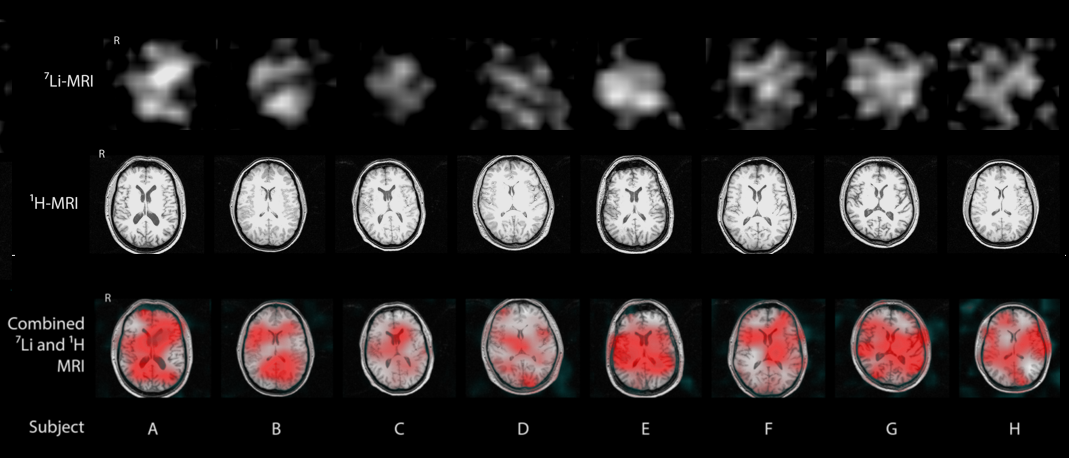
Figure 3: 7Li b-SSFP MRI in 8 subjects shown at the level of the head of the caudate nucleus (upper row), with corresponding 1H-MRI axial slices (middle row). The combined images (lower row) show 7Li b-SSFP MRI (in red) overlaid on 1H-MRI images. The distribution of lithium in the brain is heterogeneous in all subjects, and varies between subjects.
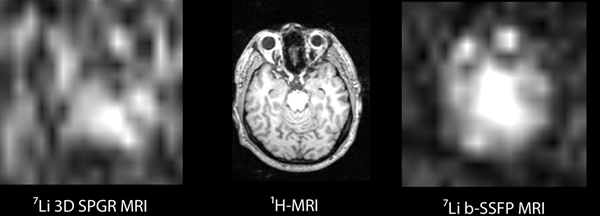
Figure 4: Comparison of the 7Li SPGR MRI and 7Li b-SSFP MRI in a single subject, plotted with the same intensity scale and acquired with equal scan durations (24 minutes in total for each sequence).