4002
Mapping longitudinal changes in brain oxygenation in vascular cognitive impairment using 19F-MRI1Department of Experimental Neurology and Center for Stroke Research Berlin, Charité – Universitätsmedizin Berlin, corporate member of Freie Universität Berlin, Humboldt-Universität zu Berlin, and Berlin Institute of Health, Berlin, Germany, 2Berlin School of Mind and Brain, Humboldt-Universität zu Berlin, Berlin, Germany, 3Department of Neurology, Max Planck Institute for Human Cognitive and Brain Sciences, Leipzig, Germany, 4Cluster of Excellence NeuroCure and Charité Core Facility 7T Experimental MRIs, Charité - Universitätsmedizin Berlin, Berlin, Germany, 5Institute of Molecular Cardiology, Heinrich-Heine-University of Düsseldorf, Düsseldorf, Germany
Synopsis
We assessed tissue oxygenation with 19F-MRI using perfluorocarbon emulsions in a mouse model of vascular cognitive impairment. Brain T1 values were measured using a cryogenic 19F/1H coil at multiple
Introduction
A central pathophysiological process in cerebrovascular disorders is the disturbance of the delivery of oxygen and glucose to tissues.1 Assessing tissue oxygenation is therefore relevant for understanding the natural history of acute and chronic vascular brain diseases and potentially for monitoring the effects of both novel and established treatments. Often, surrogate measures such as blood flow are used for this purpose instead. These measures are useful, but their relationship to tissue nutrient delivery is complex, making their interpretation difficult and possibly explaining the limited impact they have had thus far on patient management.2 The longitudinal relaxation rate (R1) of perfluorocarbons increases linearly with increased molecular oxygen concentration3, and this property has been used to quantify tissue oxygenation, particularly in mouse models of tumors.4 In this study, we applied 19F-MRI using a cryogenic coil (with an SNR 2-3 times higher than room-temperature mouse head surface coils) to assess brain oxygenation changes in a mouse model of vascular cognitive impairment.Methods
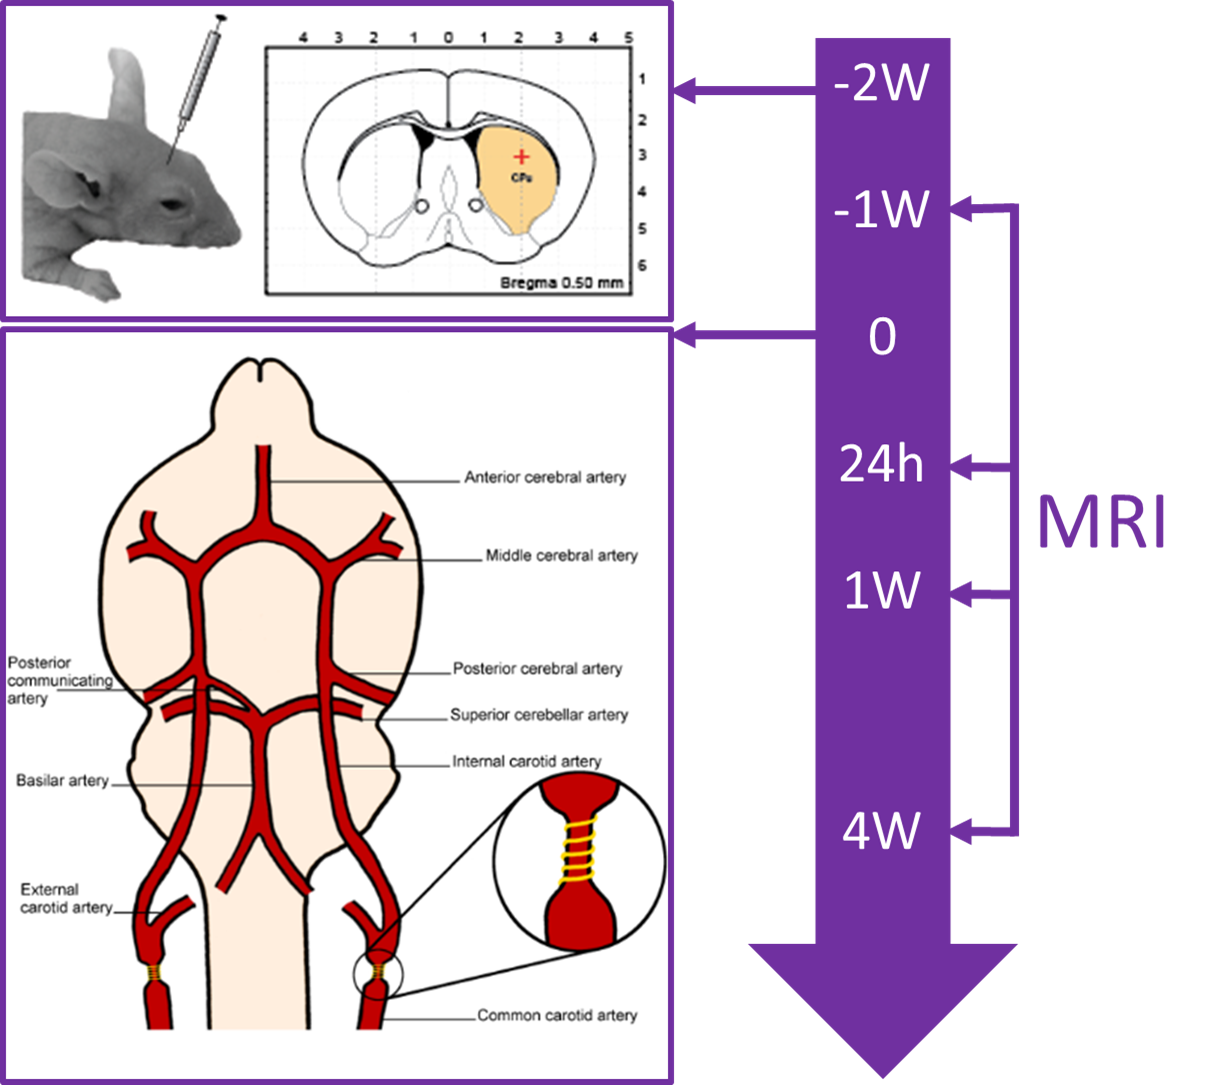
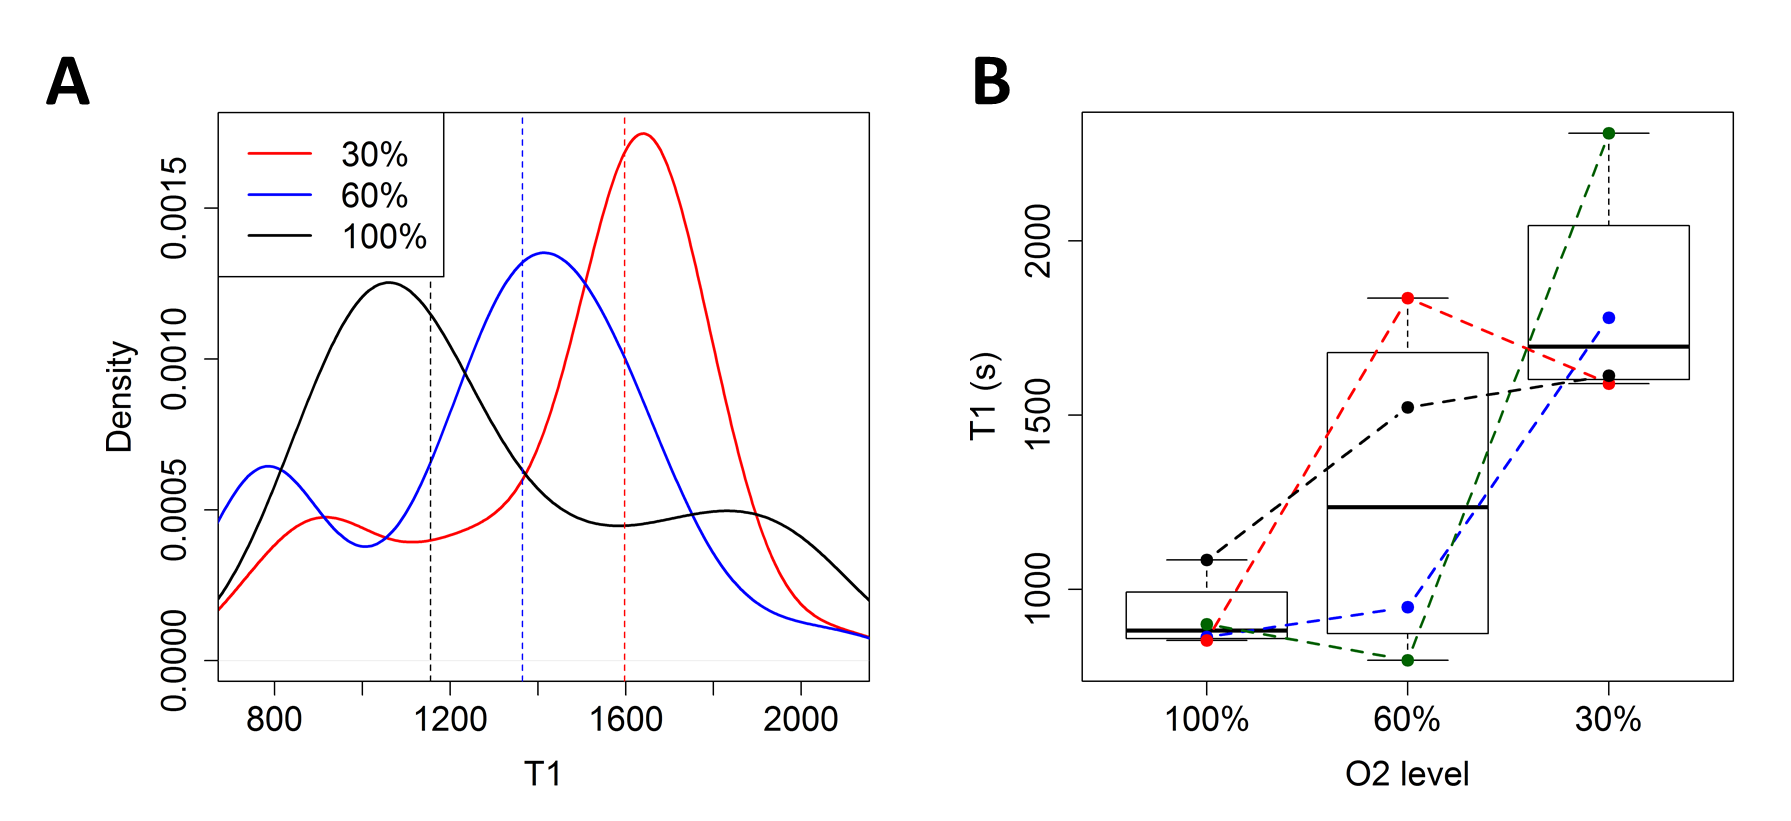
Seventeen C57/BL6 mice underwent stereotactic injection of Rhodamin-labeled perfluoro-15-crown-5-ether (PFCE) emulsion into the striatum and corpus callosum (1 µl/deposit). Subsets of the mice were each imaged 1 week before (baseline) as well as 24 hours, 1 week, and 4 weeks after global hypoperfusion was induced by wrapping 160 µm microcoils around both common carotid arteries (Figure 1).5 Imaging was performed under isoflurane anesthesia (1.5 – 2%, adjusted to maintain vital signs) on a 7T Bruker BioSpin scanner with a cryogenic 19F/1H surface coil. It consisted of T2-weighted TurboRARE 1H (TR = 3500 ms, TE = 33 ms, 6 averages, FOV [mm] = 19.2 x 19.2, matrix = 128 x 128, slice thickness = 1 mm, acquisition time = 5 min 36 s, RARE factor = 8) and 19F (TR = 1000 ms, TE = 5 ms, 128 averages, FOV [mm] = 19.2 x 19.2, matrix = 48 x 48, slice thickness = 2 mm, acquisition time = 6 min 24 s, RARE factor = 16) images as well as T1 mapping with a single-slice 19F flow-sensitive alternating inversion recovery echo planar imaging (FAIR-EPI) sequence with adiabatic excitation pulses (TR = 5000 ms, TE = 9 ms, inversion times [ms] = (25, 400,800, 1200, 1600), 20 averages, FOV [mm] =19.2 x 19.2, matrix = 48 x 48, slice thickness = 6 mm, acquisition time = 12 min 1 s). At the baseline timepoint, the T1 mapping was repeated with three different concentrations of inhaled oxygen (30%, 60%, and 100%). T1 fitting was performed using a three-parameter model that includes variations in inversion efficiency to account for B1+ inhomogeneity. Fitting was done both on a voxel-by-voxel basis and on the mean signal from a region-of-interest, defined by an SNR > 5 mask on the FAIR-EPI images. T1 values were converted to pO2 using an in vitro calibration curve.6Results
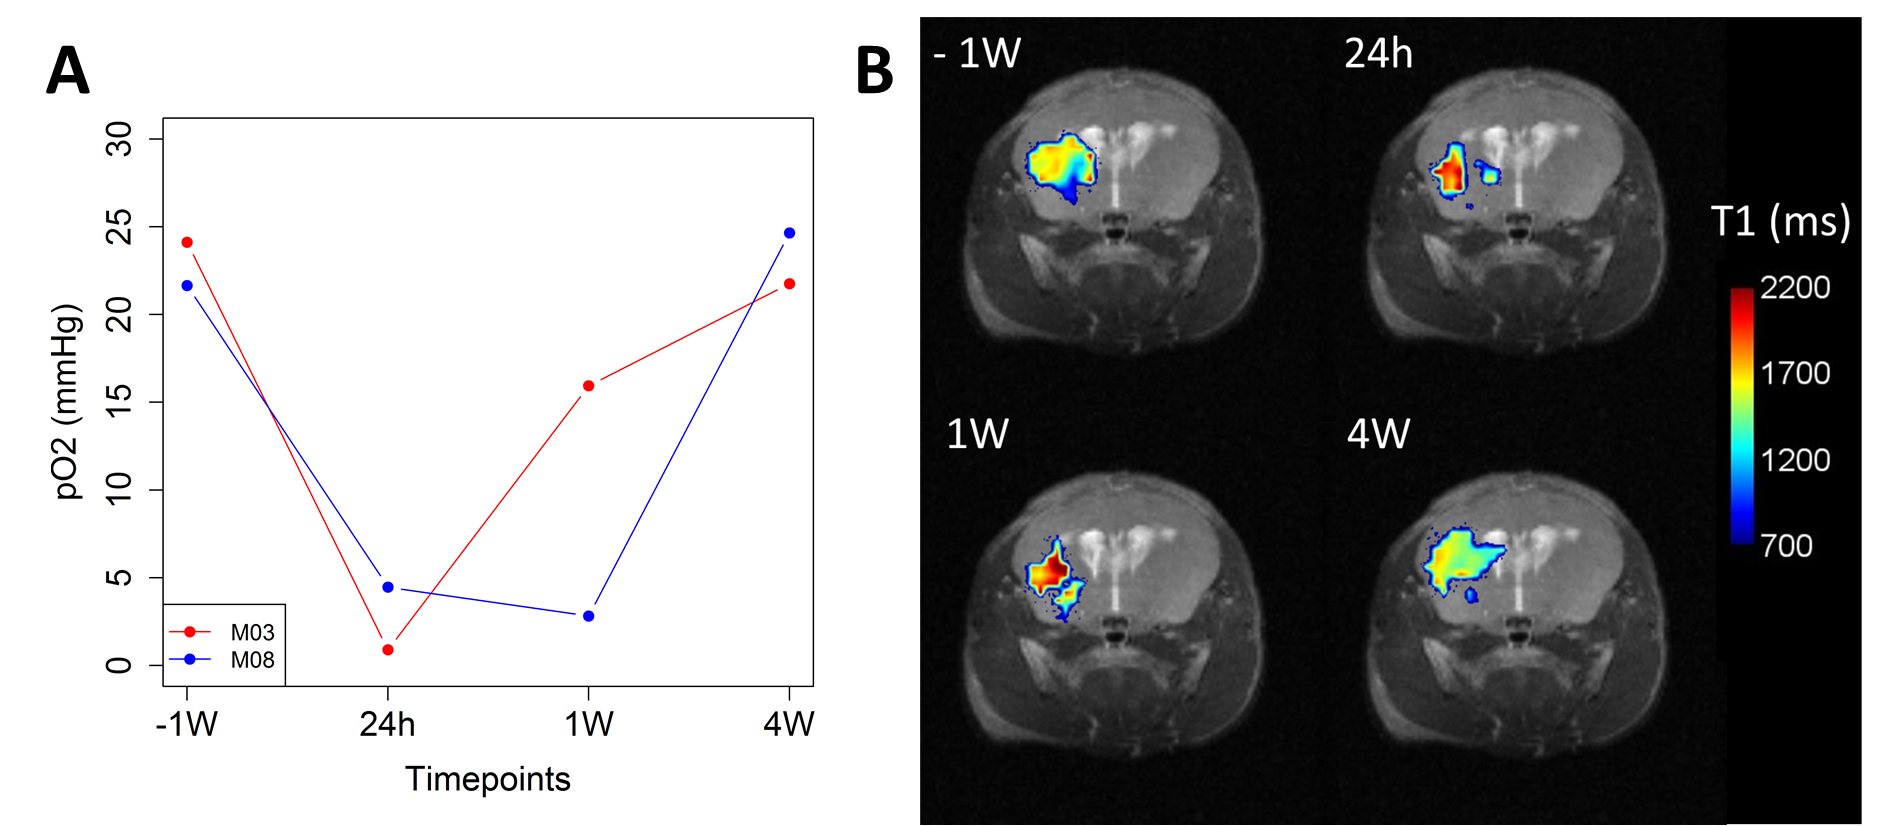
SNR measurements of the 19F FAIR-EPI images varied across mice but were largely stable over time (Figure 2). As expected, T1 decreased with increasing inhaled O2 concentrations (Figure 3). In the mice who received all 4 scans, a drop in tissue pO2 was observed 24 hours after inducing hypoperfusion, followed by a gradual recovery by week 4 (Figure 4).Discussion
Assessment of brain tissue oxygenation in vivo using water-soluble perfluorocarbon emulsions, which are more biocompatible than liquid perfluorocarbons, is feasible. Importantly, the stability of these agents allows measuring of changes over time in vivo, which is particularly relevant for studying longitudinal regenerative processes or monitoring the effects of treatments aimed at improving oxygen delivery. Although the use of a cryogenic coil improves SNR, other factors potentially affecting data quality, including injection technique and the concentration of perfluorocarbon injected, need to be taken into careful consideration. Our data suggest that in the bilateral carotid stenosis model of vascular cognitive impairment, tissue oxygenation resembles previously described changes in blood flow.7 These changes may be related to regenerative processes such as neovascularization and collateral blood flow recruitment that are seen in this model.7Conclusion
19F-MRI of perfluorocarbon emulsions using cryogenic 19F/1H coils is a promising method for long-term monitoring of changes in tissue oxygenation over time in vivo.Acknowledgements
This work was supported by the Stiftung Charité (BIH_PRO_317), the Federal Ministry of Education and Research (BMBF) (grant number 01EO0801, Center for Stroke Research Berlin), and the Deutsche Forschungsgemeinschaft (DFG) (Excellence Cluster NeuroCure, Excellence Cluster BrainLinks-BrainTools).References
1. Meisel A, Prass K, Wolf T, et al. Pathophysiology of Stroke. In: Encyclopedia of Molecular Cell Biology and Molecular Medicine. Weinheim, Germany: Wiley-VCH Verlag GmbH & Co. KGaA, 2006.
2. Kidwell CS, Alger JR, Saver JL. Beyond Mismatch: Evolving Paradigms in Imaging the Ischemic Penumbra With Multimodal Magnetic Resonance Imaging. Stroke 2003; 34: 2729–2735.
3. Ruiz-Cabello J, Barnett BP, Bottomley PA, et al. Fluorine (19F) MRS and MRI in biomedicine. NMR Biomed 2011; 24: 114–129.
4. Yu JX, Hallac RR, Chiguru S, et al. New frontiers and developing applications in 19F NMR. Prog Nucl Magn Reson Spectrosc 2013; 70: 25–49.
5. Shibata M, Ohtani R, Ihara M, et al. White matter lesions and glial activation in a novel mouse model of chronic cerebral hypoperfusion. Stroke 2004; 35: 2598–2603.
6. Kadayakkara DKK, Janjic JM, Pusateri LK, et al. In vivo observation of intracellular oximetry in perfluorocarbon-labeled glioma cells and chemotherapeutic response in the CNS using fluorine-19 MRI. Magn Reson Med 2010; 64: 1252–1259.
7. Boehm-Sturm P, Füchtemeier M, Foddis M, et al. Neuroimaging Biomarkers Predict Brain Structural Connectivity Change in a Mouse Model of Vascular Cognitive Impairment. Stroke 2017; STROKEAHA.116.014394.
Figures