4000
Detection of 13C glucose metabolism in multiple human brain regions using dynamic 1H MRS1Integrative Program of Neuroscience, McGill University, Montreal, QC, Canada, 2Biomedical Engineering, McGill University, Montreal, QC, Canada, 3Neurology & Neurosurgery, Douglas Mental Health University Institute and Department of Psychiatry, McGill University, Montreal, QC, Canada, 4Magnetic Resonance Imaging, Douglas Mental Health University Institute and Department of Psychiatry, McGill University, Montreal, QC, Canada
Synopsis
In vivo carbon-13 magnetic resonance spectroscopy is a quantitative technique for studying brain metabolism. Here, we demonstrate the use of 1H MRS to indirectly observe the metabolism of 13C labelled glucose, simultaneously in two brain regions in a single healthy volunteer. This was done using only standard proton (1H) MRS sequences and hardware. Our results demonstrate an accumulation of 13C label in glutamate and glutamine that is distinctly observable due to the pronounced effect of heteronuclear scalar coupling. This technique provides insight into neuronal metabolic rates and may provide complimentary information to 18F-FDG PET in the study of neurodegenerative disorders.
Introduction.
In vivo carbon-13 magnetic resonance spectroscopy (13C-MRS) is a quantitative technique for studying brain metabolism. Despite its promise as an investigative tool, widespread adoption of 13C MRS has been slow, due in part to experimental complexity1, and the requirement for dedicated 13C hardware1. In 2004, Boumezbeur et al.2 demonstrated the use of conventional 1H MRS to detect 13C glucose metabolism without a 13C RF channel. However, this method was demonstrated in non-human primates, and has since received limited application in humans3. Here, we demonstrate the use of 1H MRS to indirectly observe the metabolism of 13C labelled glucose, simultaneously in two brain regions in a single healthy volunteer. This was done using only standard proton (1H) MRS sequences and hardware, bypassing the need for 13C hardware and acquisition sequences. We demonstrate that with the high SNR afforded by clinical 1H head array coils, dynamic 1H MRS enables the detection of 13C glucose metabolism with high temporal resolution in the human brain. This technique is applicable to the study of neurodegenerative disorders in which alterations in brain metabolism have been observed4.Methods.
MRS
Experiments were performed on a 3T Magnetom Trio MRI system (Siemens, Erlangen Germany) with a 32-channel head receive array. A high-resolution axial T1-weighted structural image (MPRAGE sequence, TR/TE=2040/4.7 ms, 1 mm3 resolution, 6-minute acquisition time) was acquired and used to guide placement of two MRS voxels measuring 4 x 3 x 2.5 cm3; one in anterior cingulate cortex and one in precuneus/posterior cingulate cortex (Figure 1). Shimming was performed using FASTESTMAP5. Indirect (1H) detection of 13C glucose metabolism was then assessed using the SPECIAL6 sequence (TR/TE = 2400/8.5, 4096 spectral points, 4000 Hz spectral width, 128 averages, 5m 17s acquisition time). One baseline scan was performed in each region prior to the infusion of 13C glucose followed by repeated alternating scanning between frontal and posterior voxels (four times for frontal and three times for posterior regions) during and following the infusion to track the changes in 1H signals due to incorporation of 13C label. The total scan time, including subject setup in the MRI, was one hour and forty minutes.
Infusion
Following an overnight fast, 80 mL of a 20% w/w solution of [1-13C] glucose (Cambridge Isotope Laboratories, USA) were infused intravenously into the antecubital vein of the non-dominant hand at a constant rate of 0.020 g/kg/minute for a total of 15 minutes.
Processing
MRI data were processed in MATLAB (Mathworks, USA) using the FID-A Processing Toolkit7. Specifically, frequency and phase drifts were corrected using spectral registration, and each ~5-minute scan was split into two equal ~2.5-min blocks for separate analysis. The first 2.5-minute pre-infusion spectrum was subtracted from each subsequent block, and the resulting time-series of difference spectra were analyzed in LCModel8, using a simulated basis set that includes both standard 1H metabolites, and selected 13C enriched metabolites, taking into account the expected heteronuclear couplings.
Results.
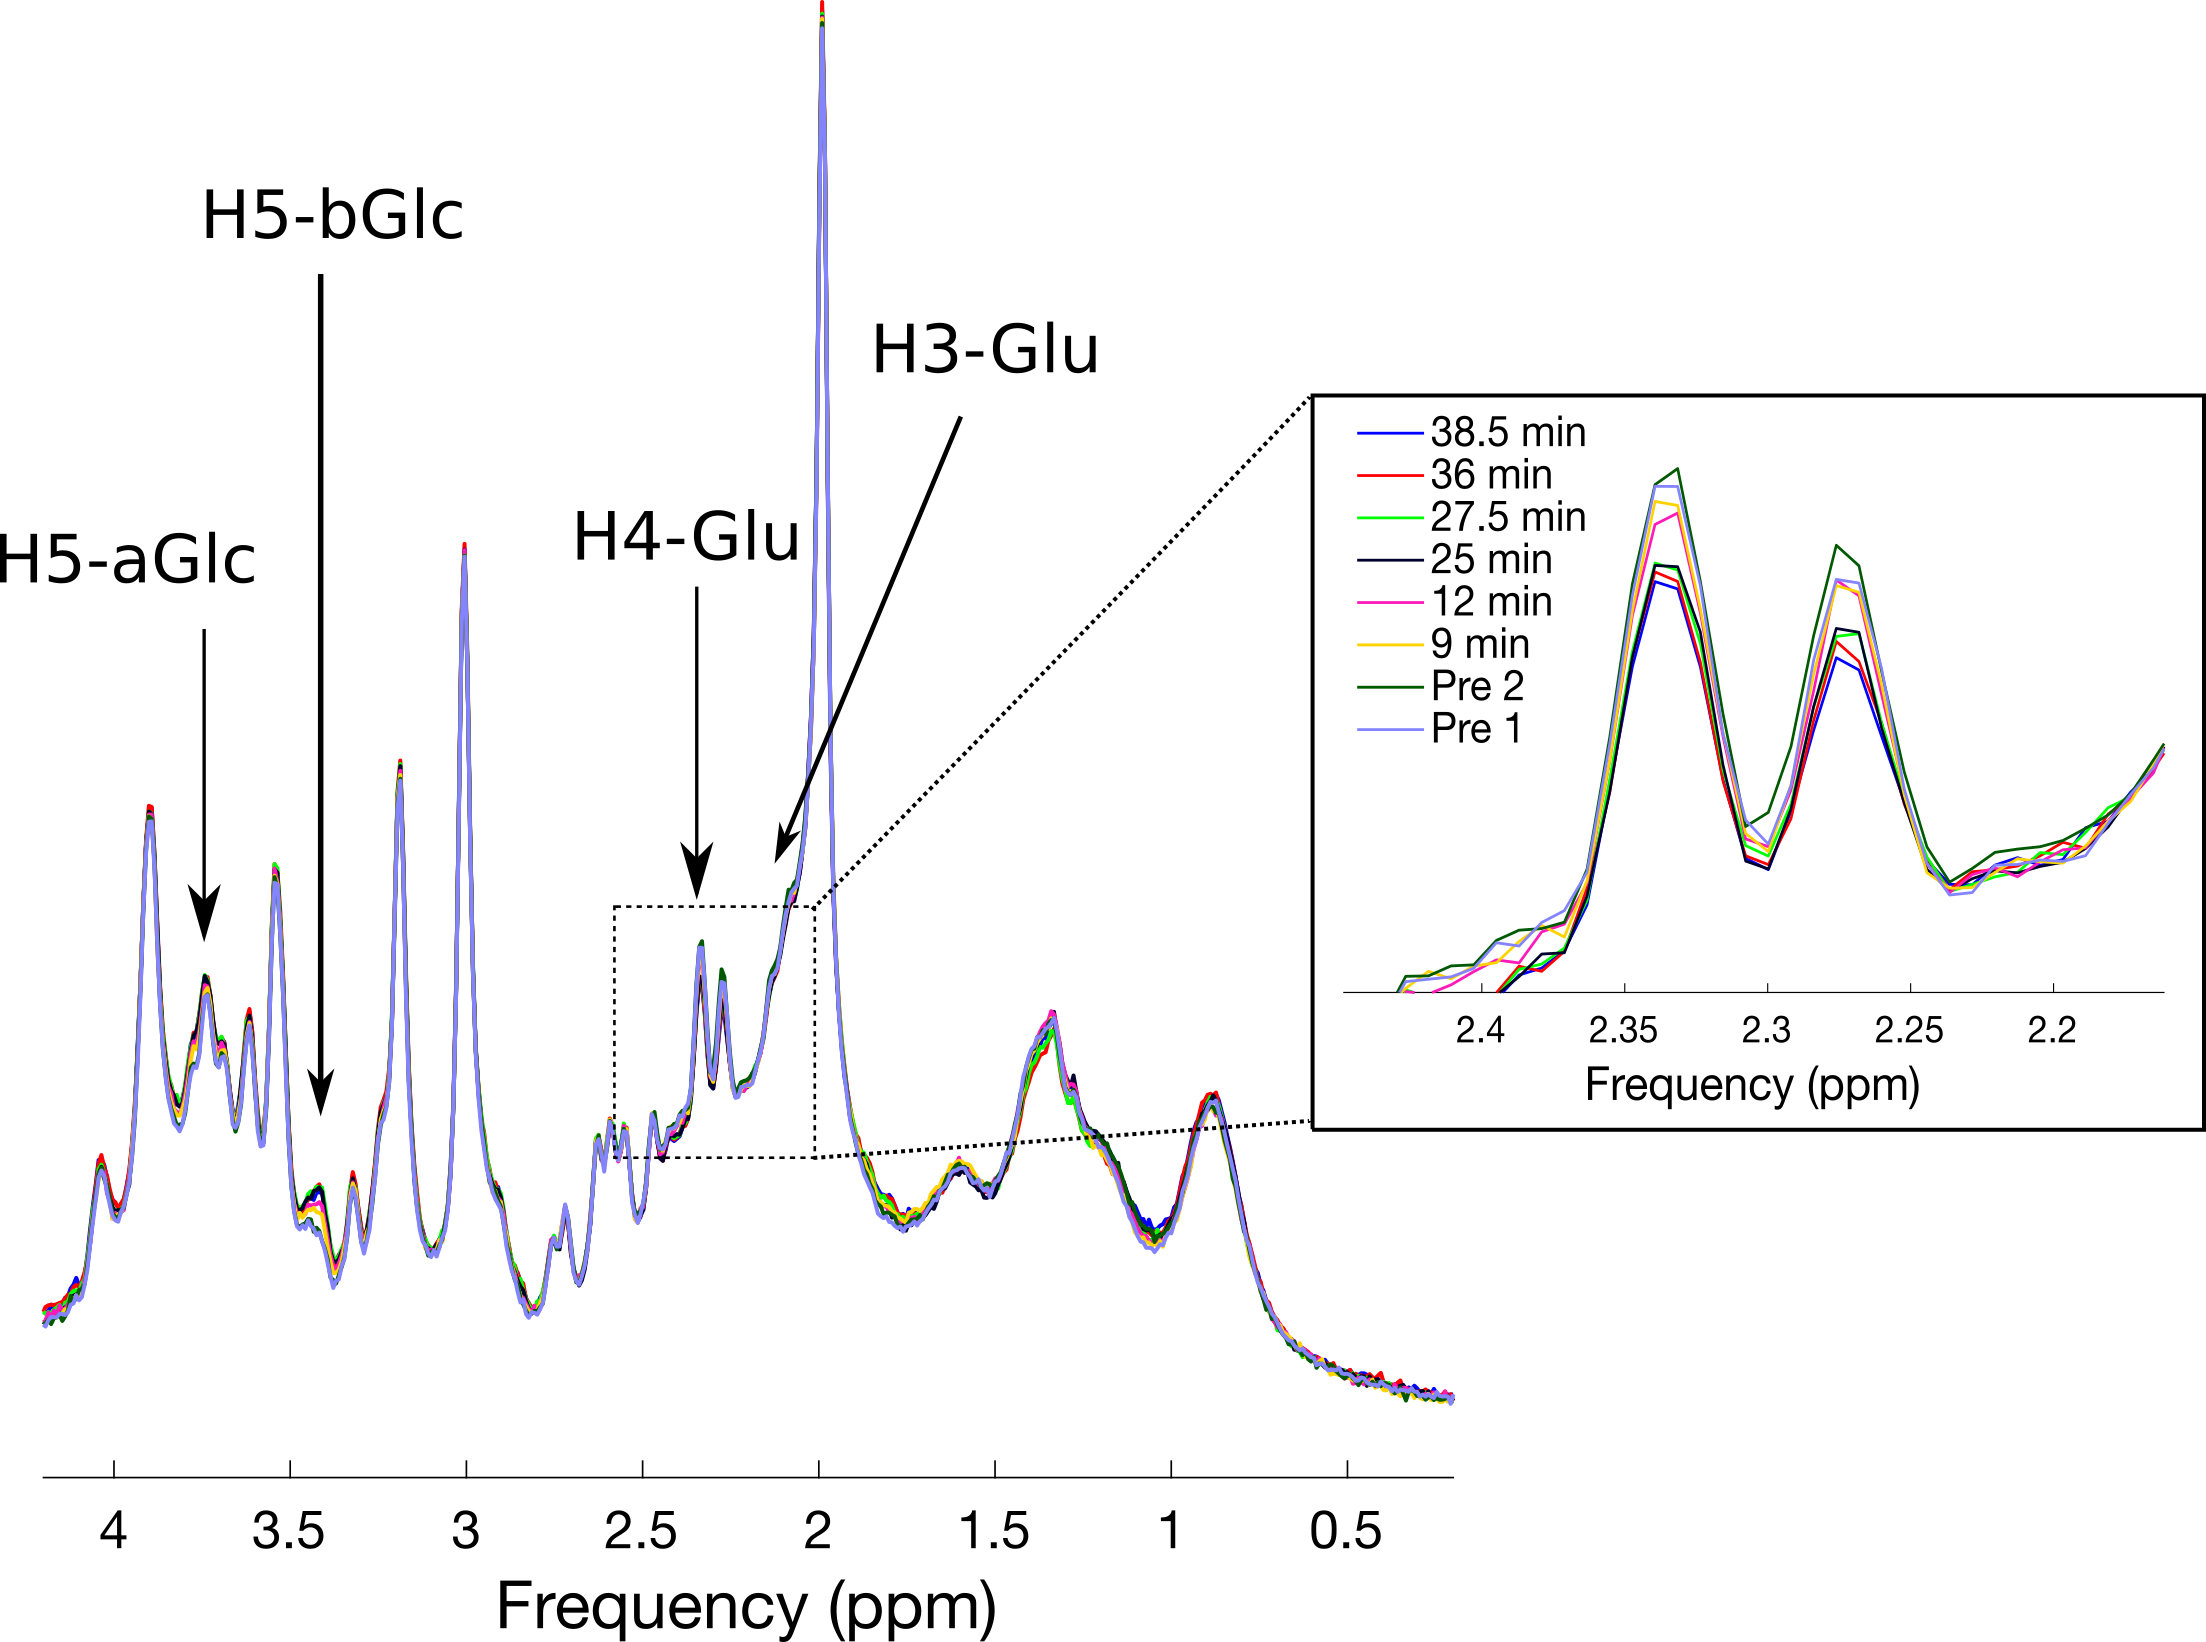
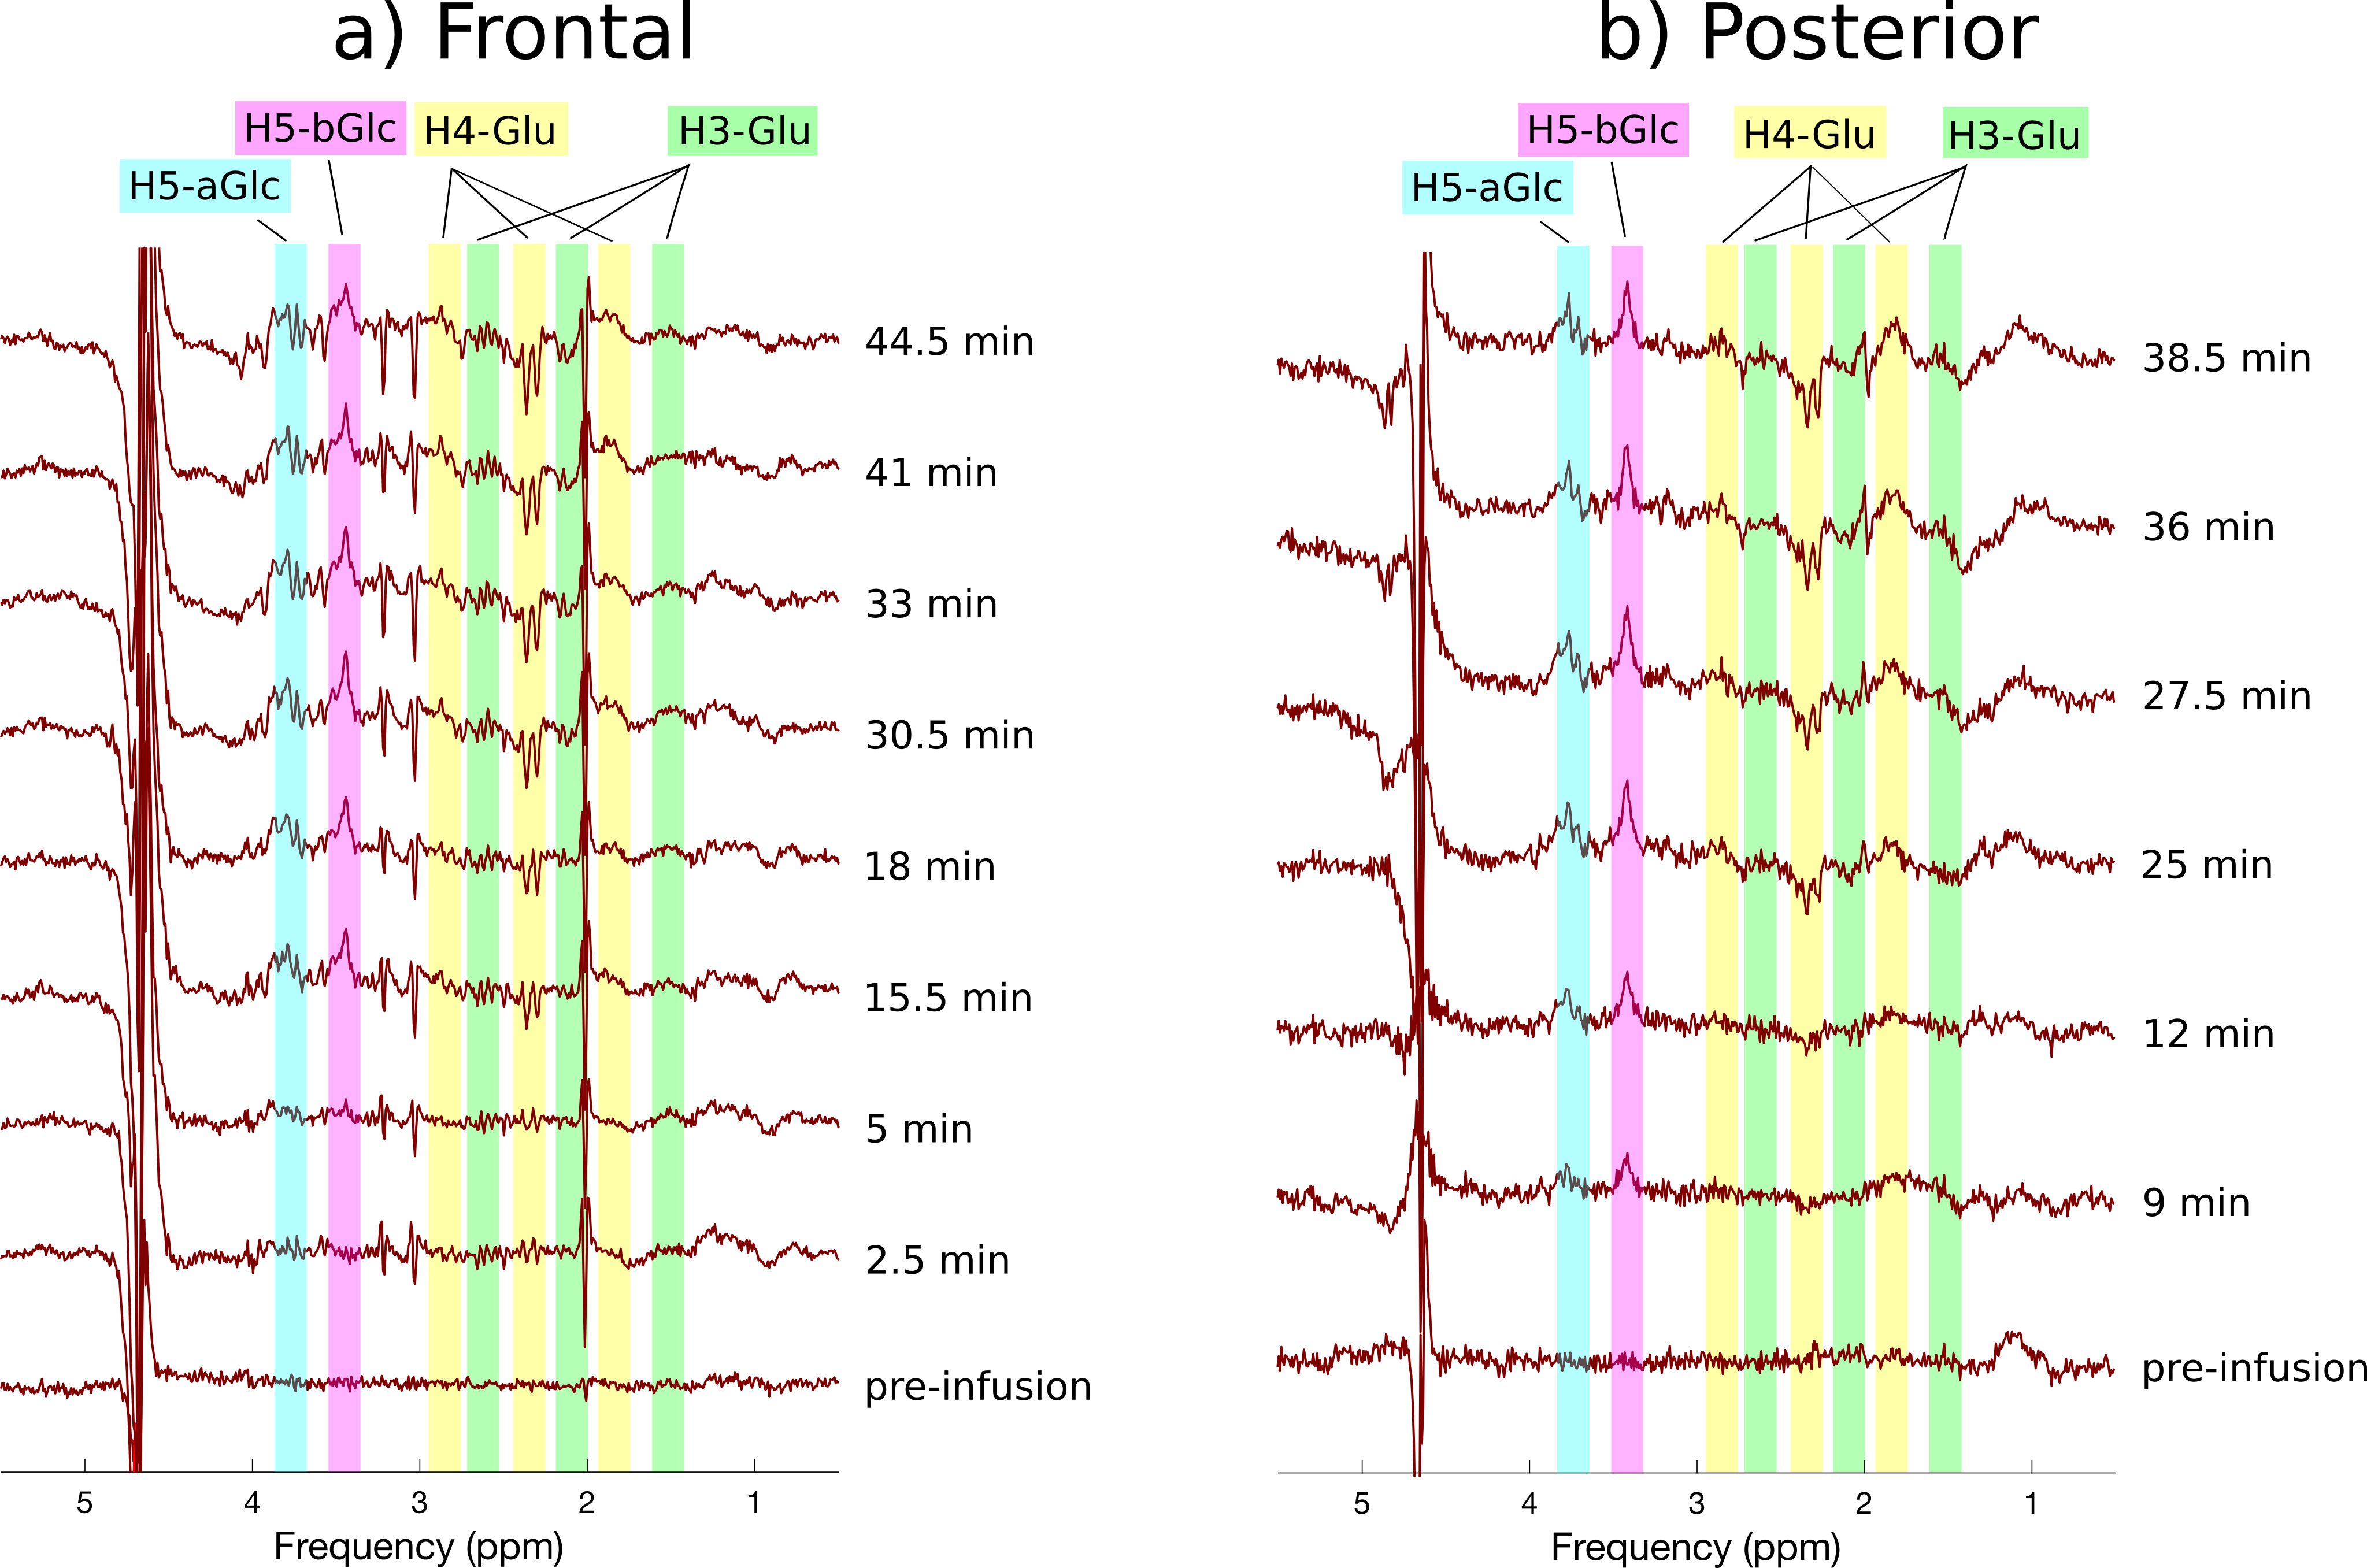
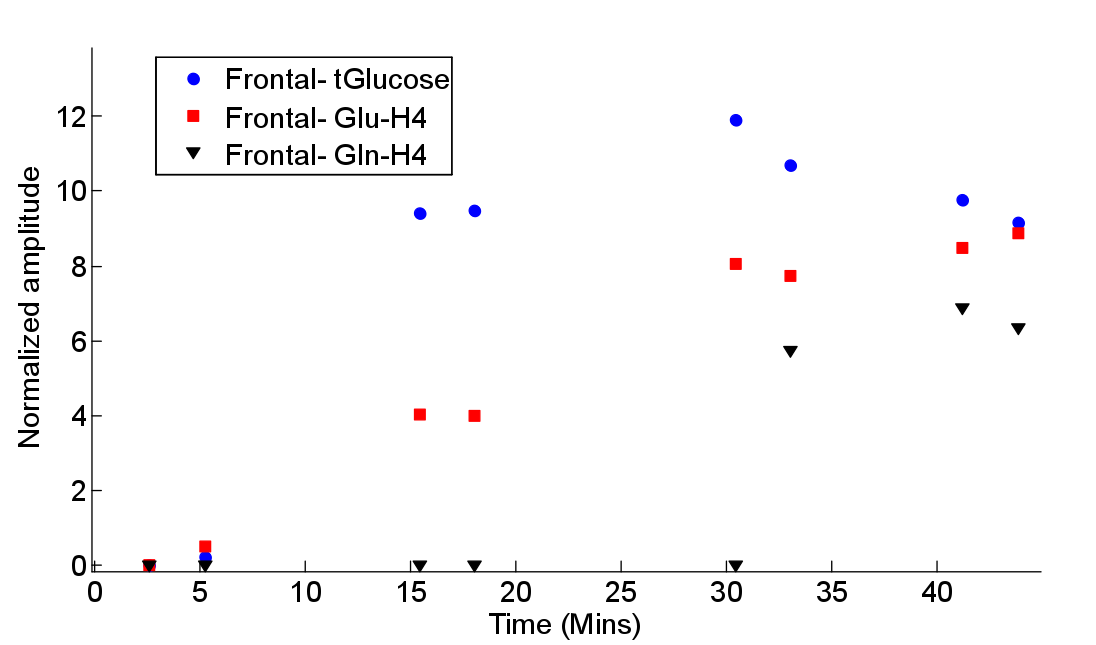
Figure 2 shows the 1H MRS time series, before subtraction, in the posterior voxel. A gradual increase of unlabelled proton signal can be seen in the alpha and beta enantiomers of D-glucose (H5-aGlc and H5-bGlc) at 3.76 and 3.41 ppm. Furthermore, a decrease in unlabeled glutamate C4 and C3 signals (H4-Glu and H3-Glu) is observed at ~2.30 and ~2.12 ppm respectively. Stacked plots of the difference spectra from both regions post infusion further emphasize these changes (Figure 3). Elevated satellites from 13C labelled Glu-H4 are also visible at 2.82 and 1.78 ppm. LCModel fitting revealed the dynamics of label uptake in both Glu-H4 and Gln-H4, as well as an increase in glucose concentrations.Discussion.
Our results demonstrate the use of dynamic 1H MRS to detect 13C glucose metabolism in the human brain without dedicated 13C hardware and pulse sequences. The accumulation of 13C label in glutamate and glutamine is distinctly observable due to the pronounced effect of heteronuclear scalar coupling. Positive peaks of unlabeled glucose enantiomers verify the rapid elevation of brain glucose levels. One limitation of this approach is susceptibility to spectral instabilities, as seen by the appearance of residual NAA, Choline and Creatine subtraction artifacts in frontal difference spectra. Despite these artifacts, observation of 13C labeling of C4 and C4 glutamate remain unaffected. The ability to track metabolic turnover rates will provide invaluable information regarding brain metabolism.Conclusion.
We demonstrated that 1H MRS can indirectly detect 13C glucose metabolism in both anterior and posterior regions of human brain. The technique provides insight into metabolic rates and may provide complimentary information to 18F-FDG PET in the study of neurodegenerative disorders.Acknowledgements
The authors thank Holly Newbold Fox for her help in MRS acquisition.References
1. de Graaf, R. A., Rothman, D. L., & Behar, K. L. (2011). State of the art direct 13C and indirect 1H-[13C] NMR spectroscopy in vivo. A practical guide. NMR Biomed, 24(8), 958-972. doi:10.1002/nbm.1761
2. Boumezbeur, F., Besret, L., Valette, J., Vaufrey, F., Henry, P., Slavov, V., . . . Lebon, V. (2004). NMR measurement of brain oxidative metabolism in monkeys using13C-labeled glucose without a13C radiofrequency channel. Magnetic Resonance in Medicine, 52(1), 33-40. doi:10.1002/mrm.20129
3. Bartnik-Olson, B. L., Ding, D., Howe, J., Shah, A., & Losey, T. (2017). Glutamate metabolism in temporal lobe epilepsy as revealed by dynamic proton MRS following the infusion of [U 13 -C] glucose. Epilepsy Research, 136, 46-53. doi:10.1016/j.eplepsyres.2017.07.010
4. Lin, A. P., Shic, F., Enriquez, C., & Ross, B. D. (2003). Reduced glutamate neurotransmission in patients with Alzheimer's disease -- an in vivo (13)C magnetic resonance spectroscopy study. MAGMA, 16(1), 29-42. doi:10.1007/s10334-003-0004-x
5. Gruetter, R. (1993). Automatic, localizedin Vivo adjustment of all first-and second-order shim coils. Magnetic Resonance in Medicine, 29(6), 804-811. doi:10.1002/mrm.1910290613
6. Mekle, R., Mlynárik, V., Gambarota, G., Hergt, M., Krueger, G., & Gruetter, R. (2009). MR spectroscopy of the human brain with enhanced signal intensity at ultrashort echo times on a clinical platform at 3T and 7T. Magnetic Resonance in Medicine, 61(6), 1279-1285. doi:10.1002/mrm.21961
7. Simpson, R., Devenyi, G. A., Jezzard, P., Hennessy, T. J., & Near, J. (2017). Advanced processing and simulation of MRS data using the FID appliance (FID-A)-An open source, MATLAB-based toolkit. Magnetic Resonance in Medicine, 77(1), 23-33. doi:10.1002/mrm.26091
8. Provencher, S. W. (1993). Estimation of metabolite concentrations from localized in vivo proton NMR spectra. Magnetic Resonance in Medicine, 30(6), 672-679. doi:10.1002/mrm.1910300604
Figures
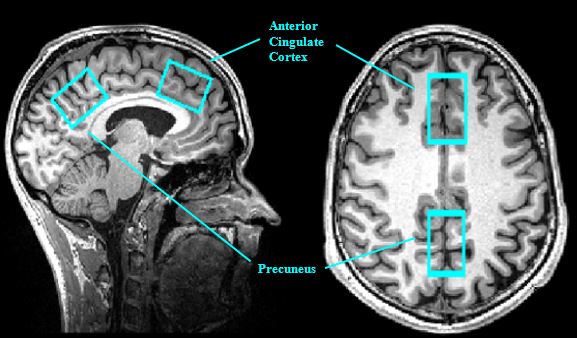
Figure 1: MRS data were acquired from the anterior and posterior cingulate cortex/precuneus using single-voxel, short echo-time SPECIAL spectroscopy with the following sequence parameters: TR/TE = 2400/8.5, 4096 spectral points, 4000 Hz spectral width, 128 averages, 5m 17s acquisition time. The voxel size was 4.0 x 3.0 x 2.5 cm3 for frontal and posterior. Sagittal and Transverse plane views of voxel placement are shown. Shimming was established independently for front and posterior voxels and scanning alternated between front and posterior voxel scans.