3997
SNR optimized $$$^{31}$$$P fMRS to measure energy metabolism in the visual cortex1Department of Radiology, University Medical Center Utrecht, Utrecht, Netherlands
Synopsis
Energy metabolism of the human visual cortex was investigated, by performing 31P fMRS. The used setup was optimized for high SNR by using a dedicated 31P RF coil at 7T and a visual stimulus with a large visual angle. Changes in the up-field peak of inorganic phosphate (Pi) are observed, revealing new promising opportunities to measure energy metabolism in the human visual cortex.
Introduction
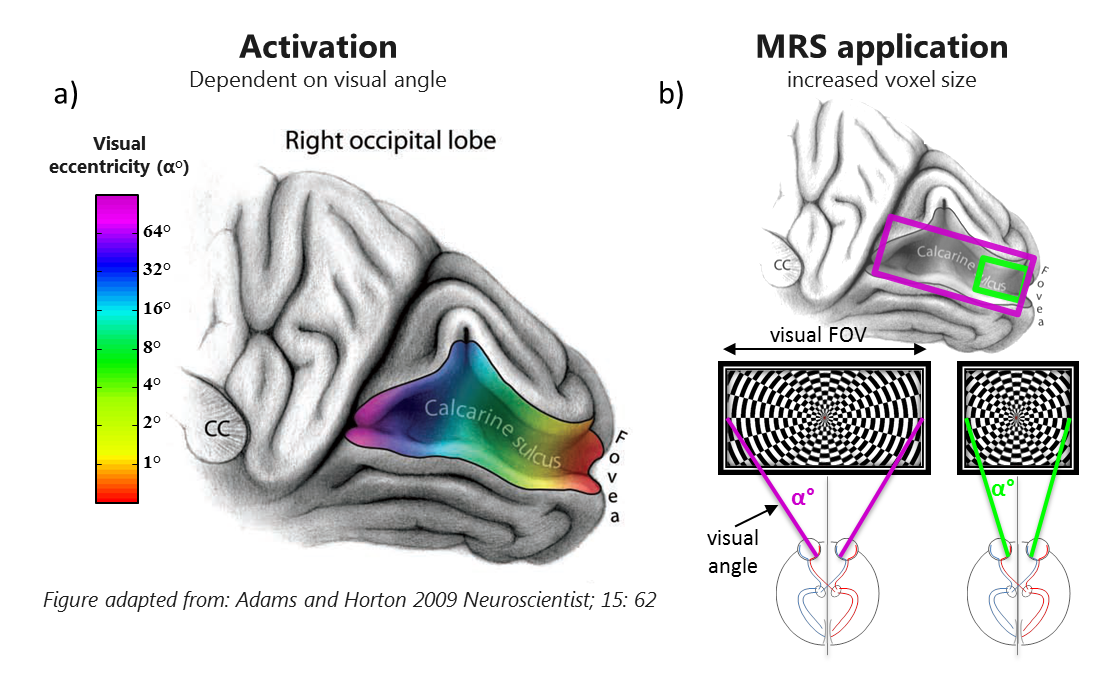
The human brain consumes a great deal of energy, and it is known to be the main glucose demanding organ of the human body [1]. Neuronal activity can increase this energy demand, and can cause local pH changes via several mechanisms [2-3]. However, the energy metabolism of the brain is strongly regulated and intracellular pH levels are controlled, for example through buffer processes like the CO2/HCO3− system. Because of these regulatory mechanisms, the magnitude of the neuronal activity induced pH changes is very small, so with MRS it could possibly only be detected as a small shift in peak frequency or minimal change in peak amplitude of inorganic phosphate (Pi). At a field strength of 7 tesla the spectral resolution is high enough to measure shifts in pH, and, because of the increased SNR, potentially also the small changes in peak amplitude. The SNR can be further improved when 7T is combined with a method to enlarge the volume of activated tissue. A large volume of activated tissue would enable the use of a large spectroscopy voxel size, resulting in an additional increase in SNR [4]. In this study, energy metabolism of the visual cortex is investigated by performing 31P MRS at 7T with a large voxel size, an optimized RF coil, and a strong visual stimulus with a large visual angle. During visual stimulation, we expect that apart from the BOLD effect, a fraction of the Pi signal shifts in frequency, because the mitochondrial and/or extracellular Pi compartments get more acidic.Aim
To gain insight into energy metabolism of the brain by using an SNR optimized 31P MRS setup at 7T with a strong visual stimulation and a large visual angle.Methods
Two participants were scanned in a 7 Tesla Achieva system (Philips, Best, the Netherlands). A dedicated custom coil setup was used (Figure 1) with a large screen for projection of a stimulus with a large visual angle (Figure 2). The transmit/receive coil used was a quadrature birdcage coil, double tuned to both the 1H and 31P frequency. For each participant a total of 16 consecutive 31P CSI scans were made. Visual stimuli were projected in blocks of 4 scans (4 rest, 4 stimulus, 4 rest, 4 stimulus). Scan parameters of the 31P 3D CSI scan were TE/TR= 0.45/100 ms, 35x35x35 mm3 voxel, 280x280x280 mm3 FOV, matrix size 8x8x8, acquisition time of 2:09 min. The visual stimulus consisted of 8 Hz contrast reversing checkerboards of 8:20 min (4 scans) for the first participant. The second participant was stimulated with 8 Hz contrast reversing curved-lines oriented in different directions, targeted to stimulate more neurons with different orientation preference. After scanning, in post processing steps, the data was Hamming filtered and 1 voxel located in the visual cortex was selected from each 3D CSI scan. The resulting spectra of 1 block (4 scans) were phased, apodized and averaged.Results
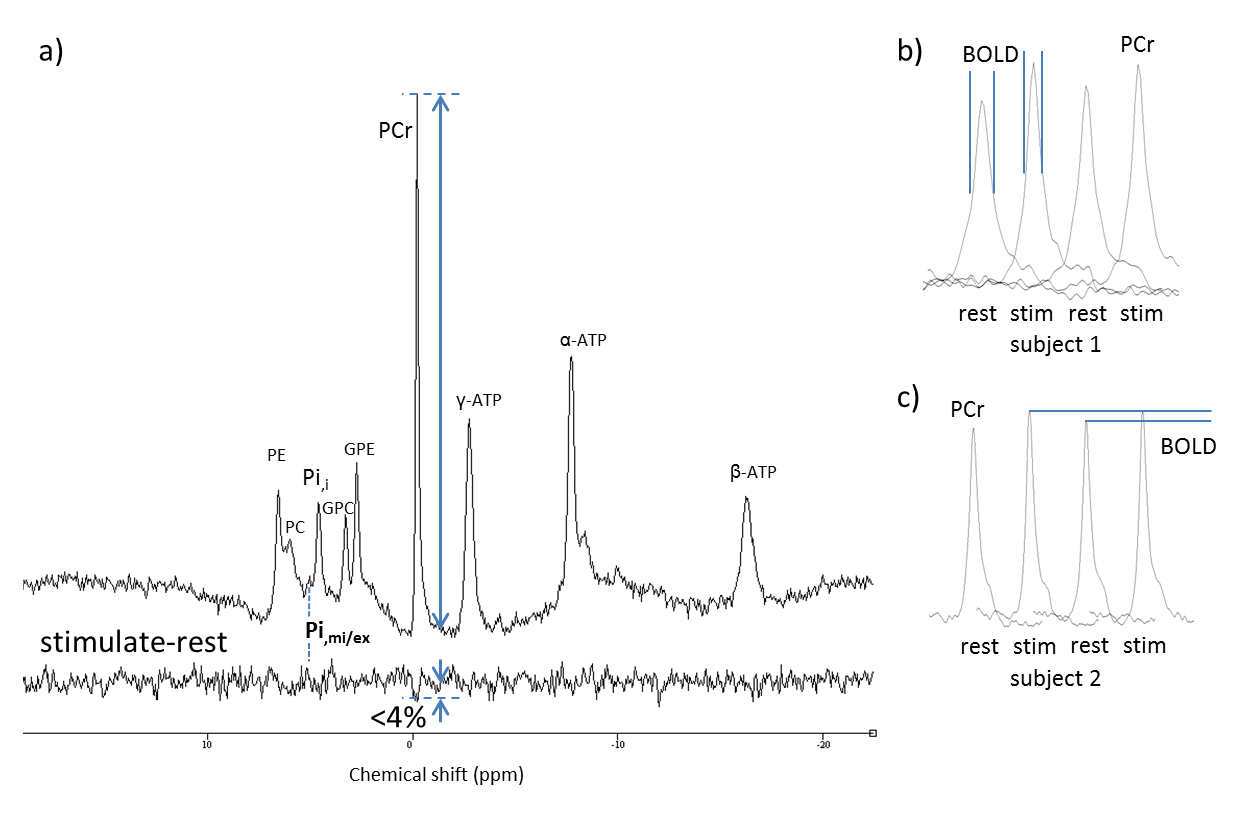
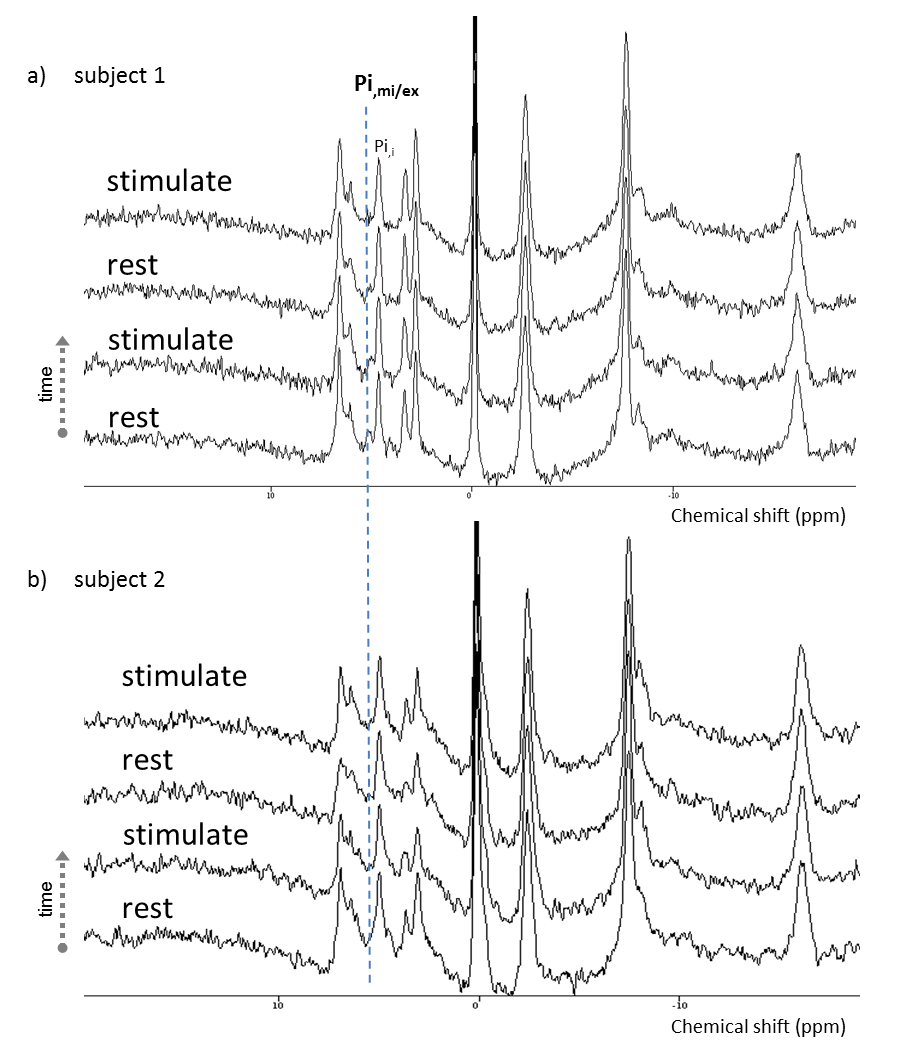
The acquired 31P MRS spectra are shown in Figure 3. Despite the lengthy and strong visual stimulation, only 4% change is visible in the PCr peak. Note that when excluding linewidth correction, a substantial BOLD effect is observed. The 31P spectra over time, for both the rest and stimulation scans, are shown in Figure 4. The intracellular Pi peak stays constant. However, the up-field (left) sub peak of Pi seems to disappear or shifts under the large Pi peak after stimulation.Discussion and conclusion
The energy metabolism of the visual cortex is investigated with 31P MRS during visual stimulation with a large visual angle. Changes in the up-field peak of Pi are observed. Whether this up-field Pi peak is extracellular or mitochondrial Pi is yet undetermined. Despite the fact that the effect on total absolute Pi is minimal, the relative effect on the Piex/mi seems substantial. The amplitude of the effect is in agreement with the decrease of PCr, which matches the equilibrium condition. Overall, the SNR optimized 31P setup at 7T in combination with a stimulus with a large visual angle, revealed promising opportunities to detect changes in energy metabolism in the human visual cortex.Acknowledgements
No acknowledgement found.References
[1] P. Mergenthaler et al. (2013) Sugar for the brain: the role of glucose in physiological and pathological brain function. Trends in Neurosciences, 36(10): 587-597
[2] V.A. Magnotta et al. (2012) Detecting activity-evoked pH changes in human brain. Proc Natl Acad Sci 22;109(21):8270-8273
[3] M. Chesler (2003) Regulation and Modulation of pH in the Brain. Physiol Rev 83: 1183–1221
[4] A.D. Hendriks et al. (2016) Pushing the limits of speed and accuracy for 7T GABA MR spectroscopy to reveal GABA level fluctuations in resting brain. Proceedings of the 24th ISMRM in Singapore pg.#3340
[5] D.L. Adams and J.C. Horton (2009) Ocular Dominance Columns: Enigmas and Challenges. Neuroscientist; 15: 62-77
Figures