3996
In Vivo Measurement of Cerebral NAD Contends and Redox State in Young Mouse.1Center for Psychiatric Neuroscience, Department of Psychiatry, Lausanne University Hospital (CHUV), Prilly, Switzerland, 2Center for Biomedical Imaging (CIBM), Ecole Polytechnique Fédérale de Lausanne, Lausanne, Switzerland, 3Chemistry, HEIA-FR, Fribourg, Switzerland
Synopsis
Nicotimamide adenine dinucleotide (NAD+ and NADH) is a key player of cell energy metabolism. 31P-MRS has been demonstrated for in vivo measurement of NAD content and redox state in cat and human brain, however, there is no reports in mouse brain. In this study we established the in vivo measurement of NAD+, NADH and NAD+/NADH in young (prepubetrtal) mice and compared two different quantification methods (Least square fitting and LCmodel). This study demonstrated the feasibility of in vivo measurement of NAD+, NADH and redox state in mouse brain and it opens the prospect of studying longitudinally the energy metabolism and redox dysfunction in mouse models of brain pathologies.
Introduction
Nicotimamide adenine dinucleotide NADH (reduced form) and NAD+ (oxidized form) are cofactors of energy producing pathways. Their ratio RX (NAD+/NADH) reflects the cellular oxidoreductive state.1 Oxidative stress and redox dysregulation has been suggested in various neurological diseases including schizophrenia, Parkinson's and Alzheimer's diseases.1,2 The in vivo measurement of redox state and NAD contents was not available until recently, 31P-MRS at high magnetic field has been demonstrated for the in vivo measurement of these indices in cat and human brains.2-5 However, there is no reports in mouse brain in vivo. It is interesting to establish this measurement for the mouse brain since mice are generally used for genetic modification to investigate the pathology of respective diseases. Therefore, in this study we aim to demonstrate the feasibility of 31P-MRS measurement of NAD+, NADH and RX in young mice brains at 14.1T and to compare two different quantification methods, i.e. a least square fitting algorithm and the LCmodel fitting.
Method
Phantom preparation
A set of solutions with known concentration of NAD+ and NADH were prepared by dissolving the chemicals in Dulbecco’s D8537 phosphate buffered saline pH 7.1-7.5 containing 9.57mM of inorganic phosphate (Pi) which was used as internal reference.
Animal preparation
C57Bl6/j mice 30-50 days old (18-21g) were anesthetized by a mixture of air, O2 (1:1 ratio) and 0.9-1.2% isoflurane. The body temperature was kept at 37±0.5°C by a tubing with circulating warm water. The respiration rate and the body temperature were monitored by a small animal monitor (SA Instruments Inc.). All animal procedures were performed according to federal guidelines and were approved by the local ethics committee.
31P MR Spectroscopy
All 31P-MR experiments were performed on a 14.1 T small animal scanner (Agilent Technologies) using a homebuilt geometrically decoupled 1H quadrature surface coil (10mm diameter) and a linearly polarized 31P coil (10mm diameter) as a transceiver. 31P-MR spectra were acquired using a pulse-acquire sequence (adiabatic half passage, 500µs pulse width, 12kHz spectral width, 4096 complex points) preceded by a 1D-ISIS for slice localization. For phantom experiments: TR = 15s, 40-100 averages, transmitter offset was set on NAD+ and on Pi resonances, respectively. For in vivo experiments: TR = 5s, 800 averages.
Spectral quantification
Two methods were used for the quantification of α-ATP, NAD+, NADH. [α-ATP] was used as an internal standard and set to 2.8mM.
1) In-house matlab routine based on least square errors minimization. NAD+, NADH, a-ATP and UPDG (uridine diphosphoglucose) 31P spectra were simulated using published chemical shifts and J-coupling constant.2 These spectra were then used to fit baseline corrected 31P MR spectra (spline subtraction) using least square errors minimization.
2) LCModel fit. A basis-set was prepared using simulated 31P spectra including PCr(phosphocreatine), α-ATP, β-ATP, γ-ATP, Piint, Piext, PE (phophothanolamine), PC (phosphocoline), GPC (glycerophosphocholine), GPE (glycerophosphoethanolamine), MP (membrane phospholipid), NADH, NAD+, UPDG with respective linewidths.6,7
Results
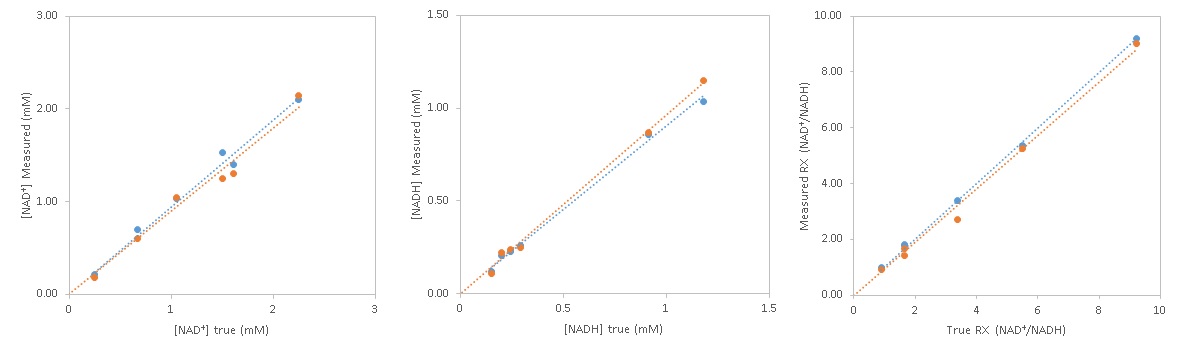
Figure 1 shows the comparison of experimentally measured [NAD+], [NADH] and RX with their corresponding true values in the phantoms using two quantification approaches. The linear regression indicates good consistency between measured and true values for both least square fit (slope: 0.94-1.12, R2:0.98-1.00) and LCModel (slope: 0.90-0.99, R2:0.97-1.00).
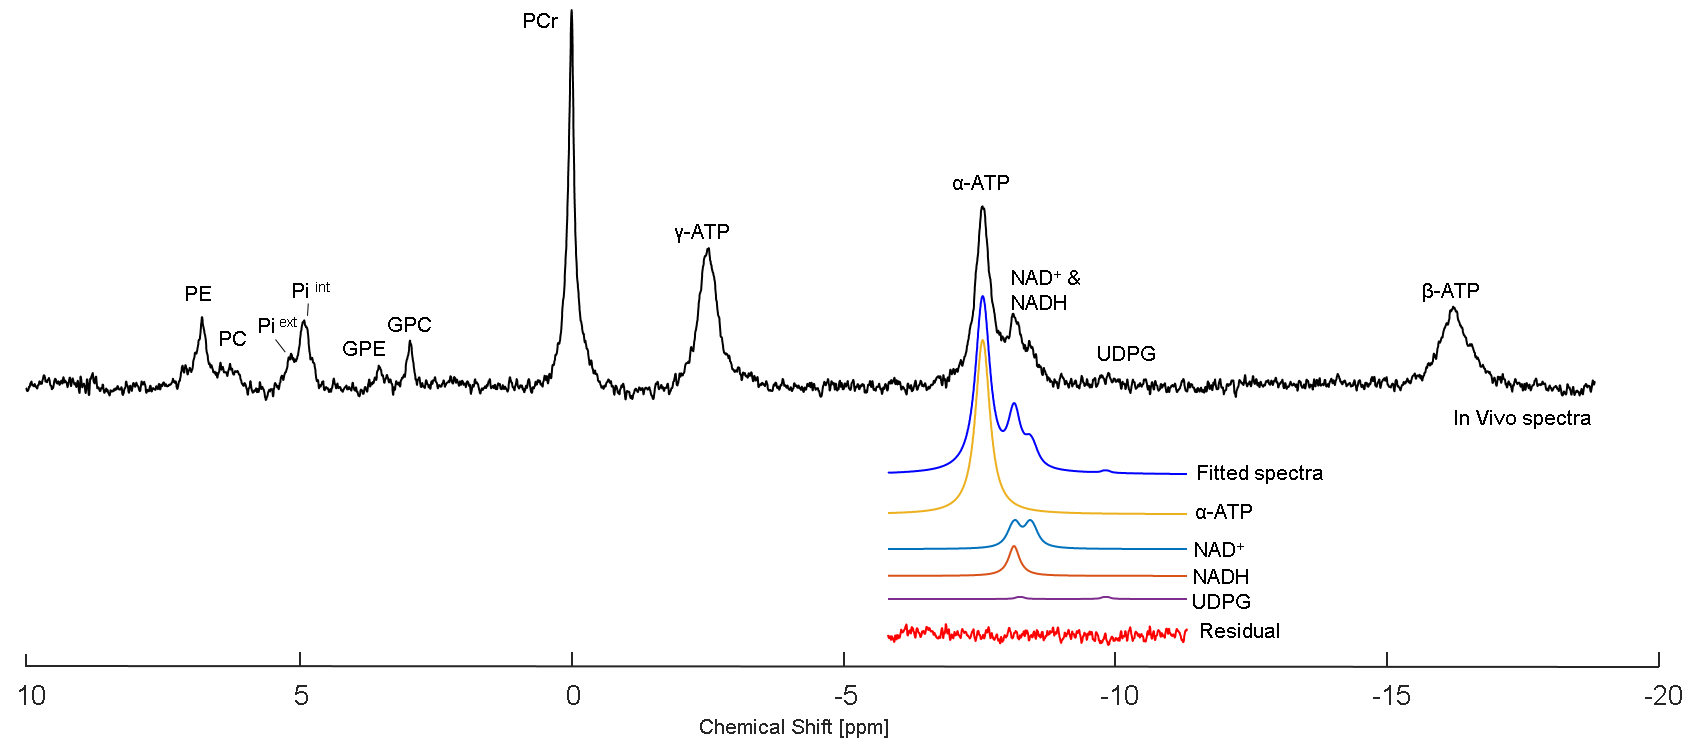
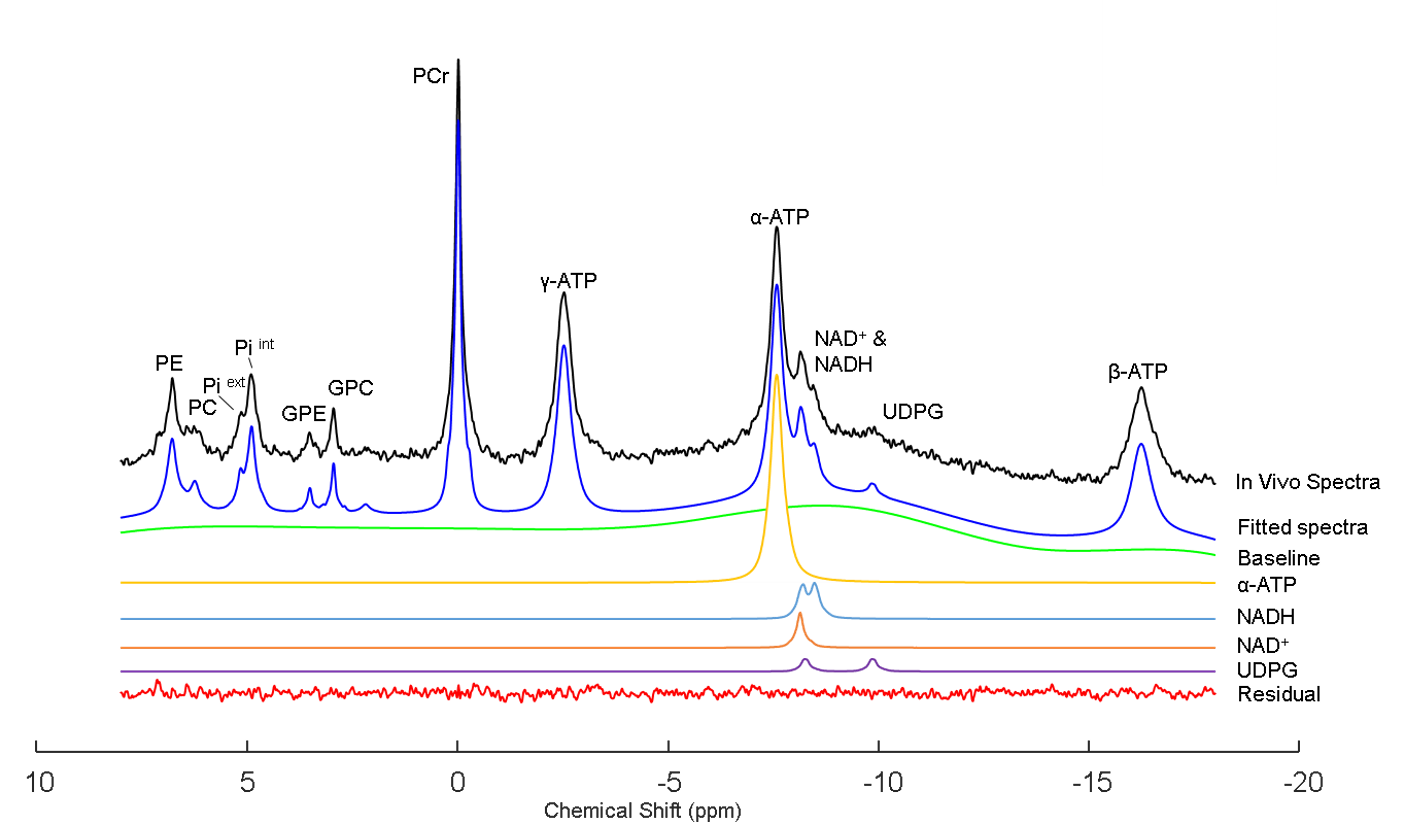
A typical in vivo 31P spectrum of mouse brain demonstrated excellent sensitivity and spectral quality at 14.1T, which ensured the reliable quantification of the NAD signals in vivo. Least square fit and LCModel are able to provide equally good fits for NAD resonances with very low fit residuals as shown in Fig.2 (least square fitting) and Fig.3 (LCModel).
Table 1 shows the concentration of NAD+, NADH and RX in mouse brain using least square fit and LCModel, respectively.
Discussion and Conclusion
We demonstrated for the first time the feasibility of NAD+, NADH and redox state measurement in vivo in young mice brain by 31P-MRS at 14.1T. The values observed in mice, using two fitting approach, are in agreement with each other and those reported in cat brain.4 Although both methods demonstrated rigorous fitting with low residual, LCModel fitting procedure is more automatic and less operator dependent for routine analysis. In conclusion, this study demonstrated the feasibility of in vivo measurement of NAD+, NADH and redox state in mouse brain and it opens the prospect of studying energy metabolism and redox dysfunction in transgenic mouse models of brain pathologies.
Acknowledgements
Supported by:
Centre d'Imagerie BioMédicale (CIBM) of the UNIL, UNIGE, HUG, CHUV, EPFL,
Leenards and Jeantet Foundations,
Alamaya Foundation,
NCCR Synapsy,
Swiss National Science Fundation (SNF)References
1. Weihai Y. NAD+ and NADH in brain functions, brain diseases and brain aging. Frontiers in Bioscience 2007;12:1863-1888.
2. Sang-Young K, Bruce M. C, Xi C, et al. Redox dysregulation in schizophrenia revealed by in vivo NAD+/NADH measurement. Schizophr Bull. 2016;43(1):197-204.
3. Xiao-Hong Z Ming L, Byeong-Yeil L, et al. In vivo NAD assay reveals the intercellular NAD contents and redox state in healthy human brain and their age dependences. PNAS 2015;112(9):2876-2881.
4. Ming L, Xiao-Hong Z, Yi Z, and Wei C. Intracellular redox state revealed by in vivo31P MRS measurement of NAD+ and NAD contents in brains. Magn Reson Med. 2014;71(6):1959-1972.
5. de Graaf R.A, De Feyter H.M, Brown P.B, et al. Detection of cerebral NAD+ in humans at 7T. Magn Reson Med 2017;78(3):828-835
6. Deelchand D. K. et al., Quantification of in vivo 31P NMR Brain Spectra using LCModel. NMR Biomed. 2015; 28(6): 633–641.
7. Provencher S.W., Estimation of metabolite
concentrations from localized in vivo proton NMR spectra. Magn Reson Med. 1993;30(6):672-9.
Figures