3995
Quantification of human cardiac inorganic phosphate content in vivo by 31P-MRSI at 7T1Oxford Centre for Clinical MR Research (OCMR), RDM Cardiovascular Medicine, University of Oxford, Oxford, United Kingdom, 2Department of Imaging Methods, Institute of Measurement Science, Slovak Academy of Sceinces, Bratislava, Slovakia, 3High-Field MR Centre, Center for Medical Physics and Biomedical Engineering, Medical University of Vienna, Vienna, Austria, 4The Wolfson Brain Imaging Centre, University of Cambridge, Cambridge, United Kingdom
Synopsis
Determination of human cardiac Pi using 31P-MRS is challenging as the resonance frequency of Pi is concealed by a close resonating 2,3-DPG signal originating from blood. Long TR acquisition using adiabatic excitation at 7T can compensate for the rapid blood signal replacement in partially-saturated short TR scans. In order to quantify Pi concentration in vivo, knowledge about longitudinal relaxation of Pi is still required. We have measured the T1 of Pi in 4 healthy volunteers at 7T using dual-TR method and used this value to quantify cardiac Pi concentration in 8 healthy volunteers.
Introduction
Phosphorus MR spectroscopy (31P-MRS) is a valuable technique for non-invasive measurement of high-energy metabolites, e.g. adenosine triphosphate (ATP) and phosphocreatine (PCr), that allows assessment of tissue energy metabolism in vivo. Interest in 31P-MRS is great in cardiovascular medicine, as the PCr/ATP concentration ratio in the heart changes in most major disease states1,2. Nevertheless, the full potential of cardiac 31P-MRS is not robustly accessible as the quantification of cardiac inorganic phosphate (Pi), important for ATP synthesis, is hindered by the dominant signal of 2,3-diphosphoglycerate (2,3-DPG), originating from the blood. We have recently demonstrated the ability to detect cardiac Pi in vivo using long TR and adiabatic excitation at 7T and use it to calculate cardiac pH, which is important as acidosis can limit heart’s ability to pump blood in disease3. However, even with acquisitions using relatively long TR, partial saturation of Pi signal cannot be fully excluded due to generally long T1 times of phosphorus metabolites4,5, making straightforward quantification without T1 correction unfeasible. Therefore, our aim was to determine the T1 of Pi in human heart at 7T using adiabatic excitation with a dual TR technique6. We also report Pi concentration, quantified using our measured T1, relative to ATP and PCr in 8 healthy volunteers.Materials and Methods
All measurements were performed on a 7T MR system (Siemens) equipped with a custom dual-tuned RF-coil, comprising a quadrature 31P coil (two 15cm loops, with overlap decoupling)7 and a single 1H loop (10cm in diameter) for localization. First, four healthy subjects (3M/1F) were recruited for determination of the T1 of cardiac Pi in compliance with local regulations. Two 3D UTE-CSI8 acquisitions (matrix size 8x16x8 and FOV of 240x240x200mm3) were made, one with the shortest possible and one matching our previous study3. The SAR limits for the narrow-banded AHP pulse9 we used did not allow TR< 3s. Our chosen TRs were therefore: TR1 = 3s and TR2 = 6s. As the AHP pulse has a relatively narrow bandwidth at the achievable B1+, the excitation was centred at +600Hz from the PCr resonance frequency. Simulations of the Bloch Equations were used to estimate the expected errors in calculated T1 for resonance offsets range from -180Hz to 180Hz from centre frequency, for the possible T1s ranging from 1s to 10s. Second, data from eight healthy volunteers (7M/1F) were used to quantify the Pi/ATP and Pi/PCr ratios. We used our previously reported protocol for cardiac 31P-MRS using interleaved AHP excitation at 7T9. In short, the AHP excitation is interleaved to excite the PCr and ATP region in odd acquisitions and the Pi and DPG region in even acquisitions. The effective TR was 6s and other parameters match the T1 measurements. Six septal voxels were fitted in all in vivo data using a Matlab implementation of AMARES10 and corrected for T1 relaxation using the measured values for Pi and literature values for ATP and PCr5. The T1 of Pi in chest muscles (again taking six voxels) was evaluated for comparison.Results and Discussion
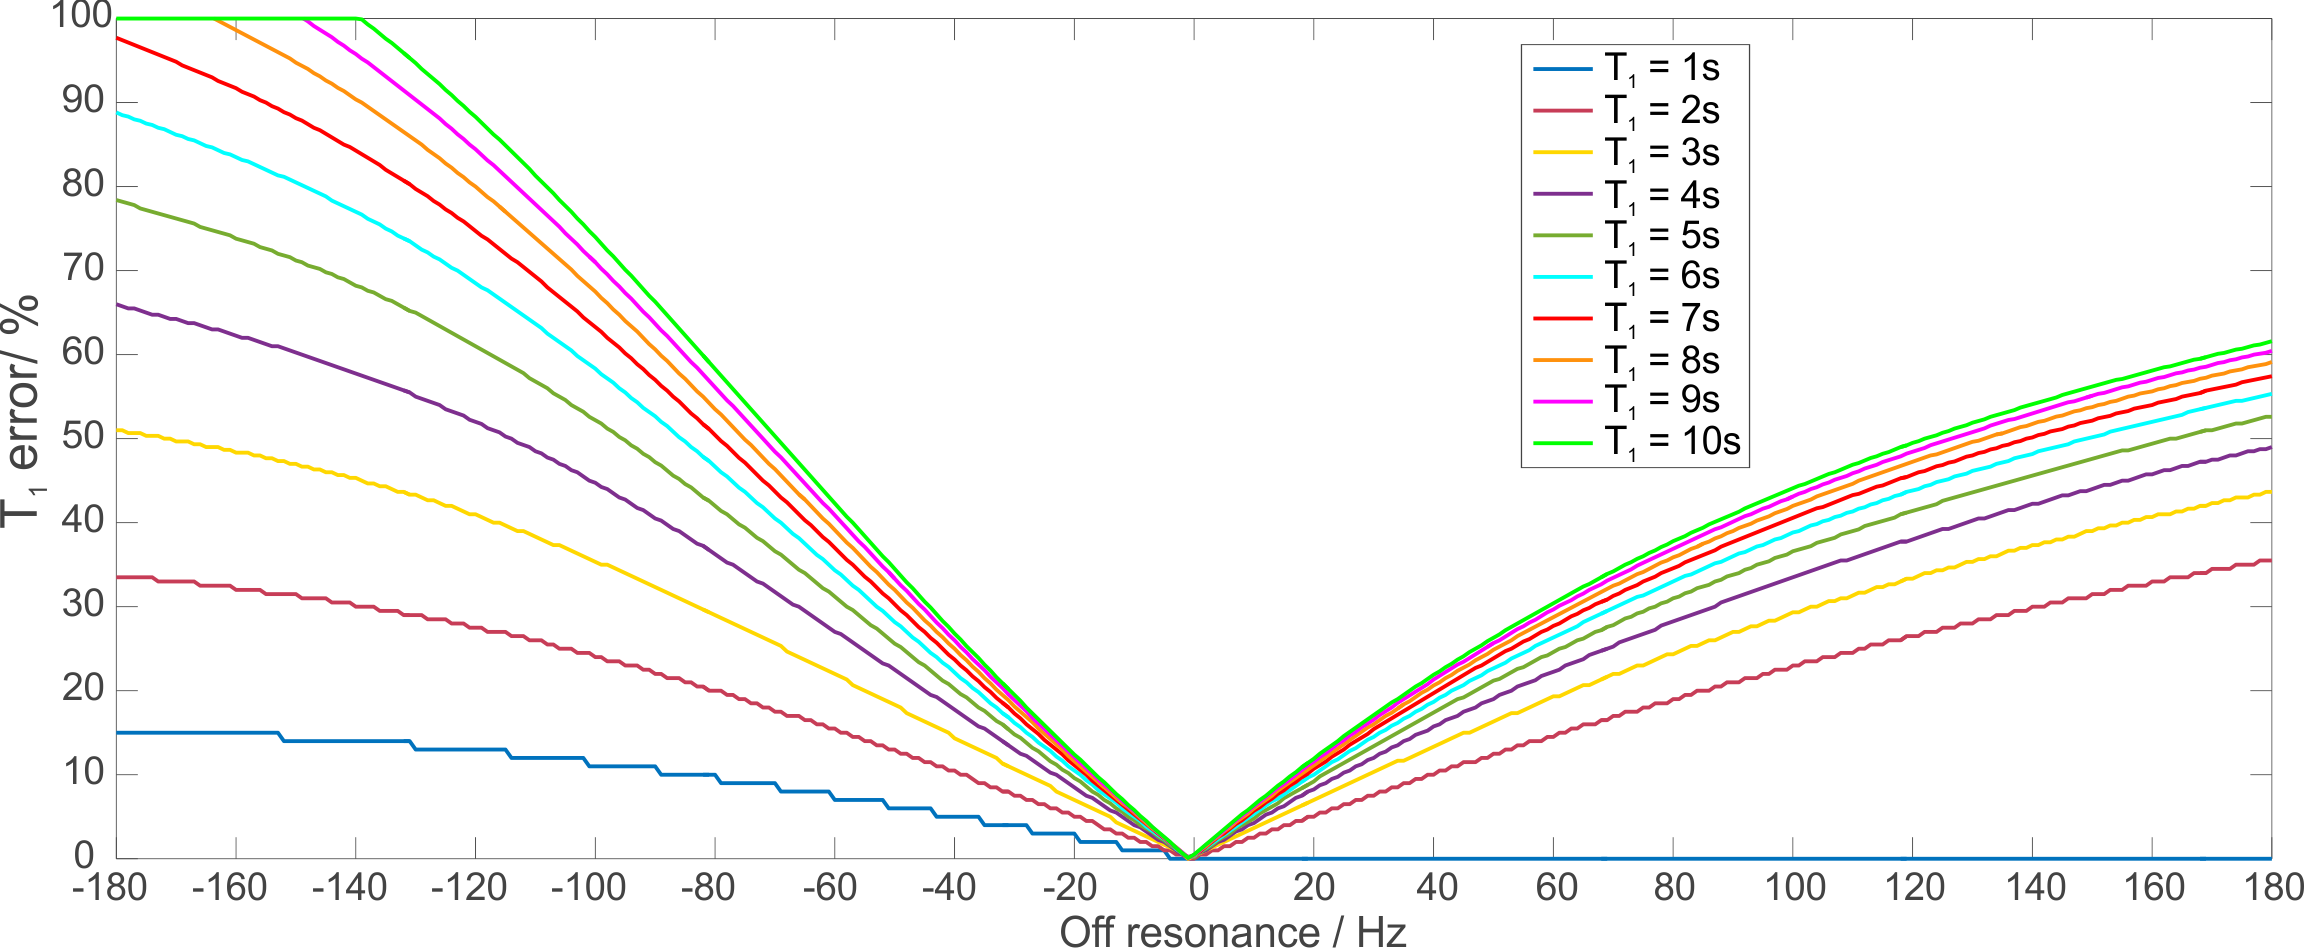
Figure 1 depicts the simulated off-resonance
error in T1 estimation using the AHP pulse for the lowest B1+
expected in the heart, i.e. 16μT7.
This shows that even in the worst case, the potential error is below 20% for a
range of frequencies ±30Hz, i.e. 0.25ppm. The asymmetry of the AHP pulse starts
to play a role for larger frequency offsets; the smoother side of the pulse,
which faces PCr here, gives smaller errors.
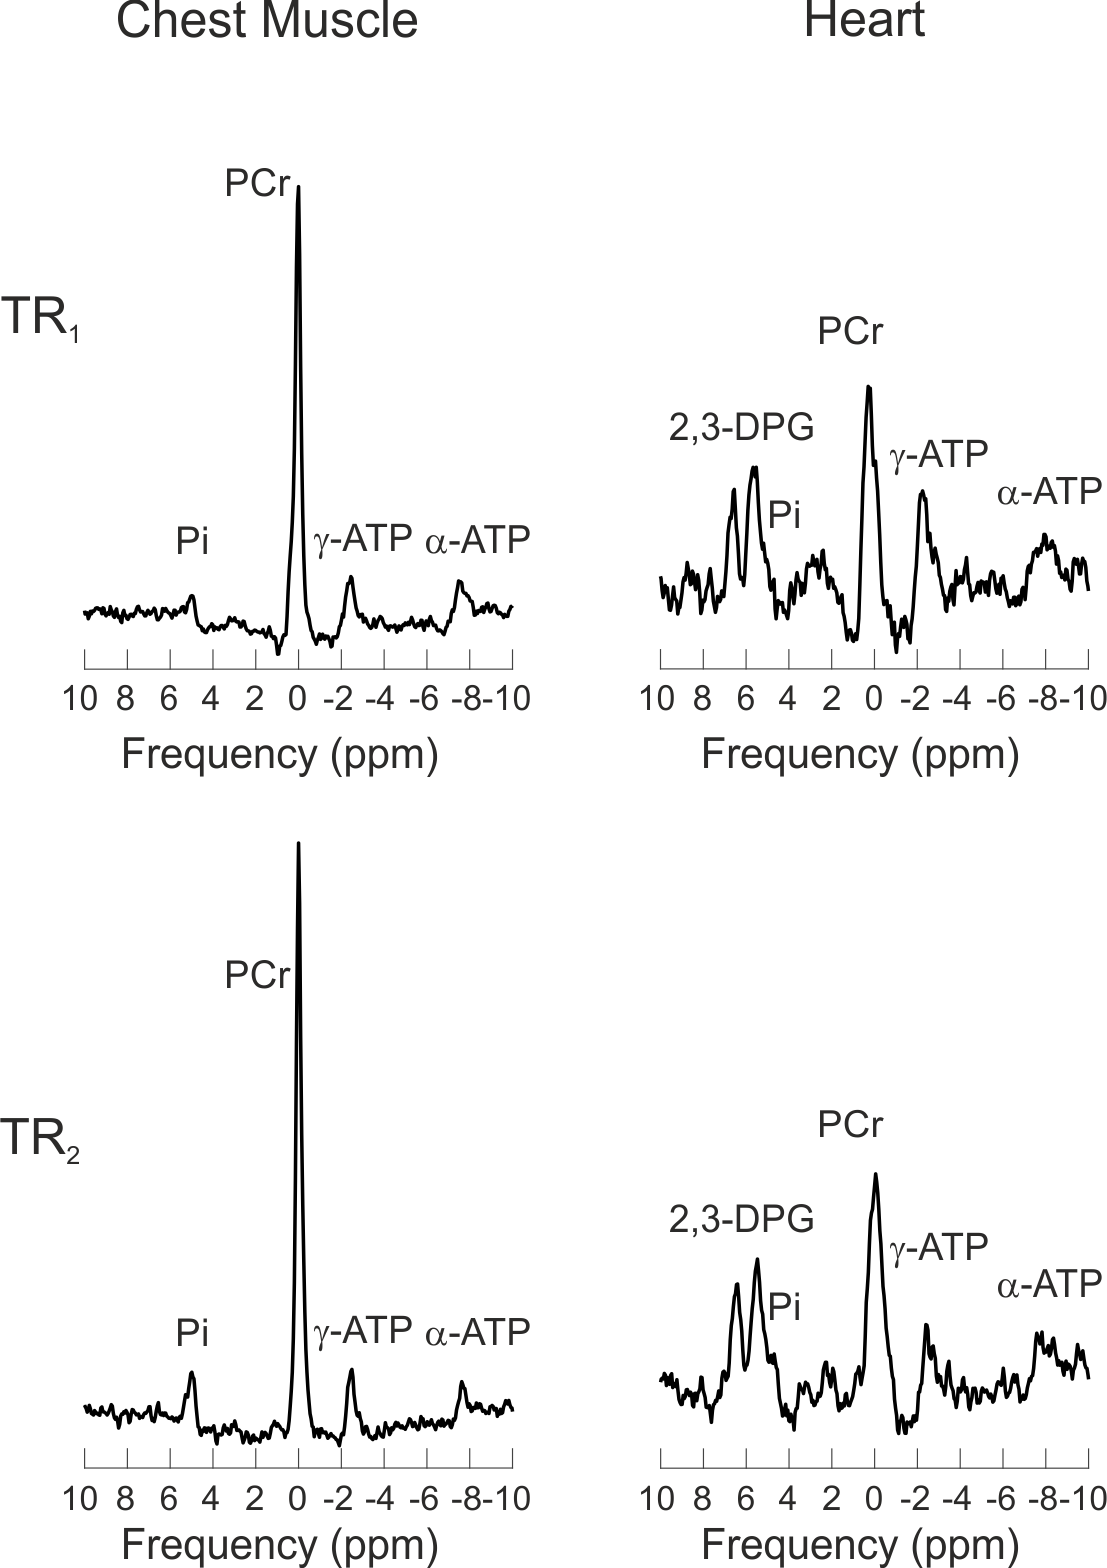
Figure 2 shows 31P-MRS spectra
from the chest muscles and septum of one volunteer acquired at TR1
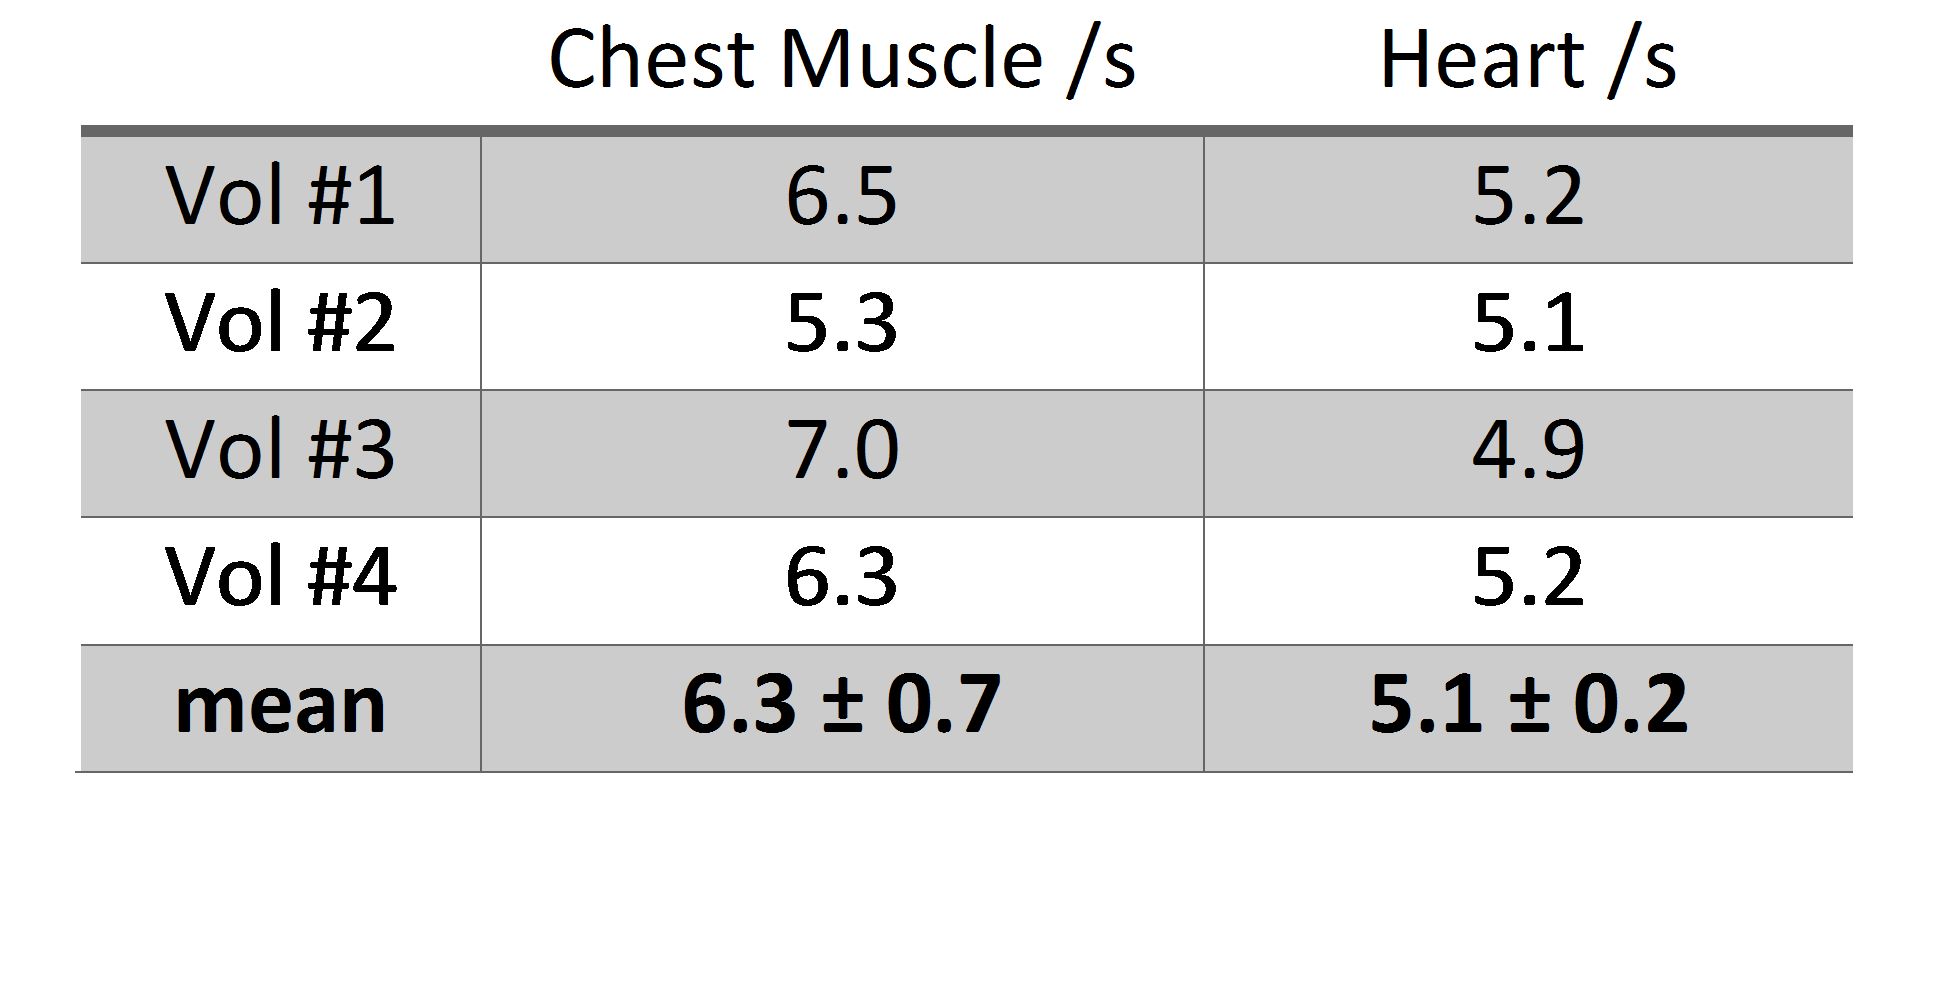
and TR2. The inter-subject mean T1 of Pi measured in
skeletal muscles was 6.3±0.7s and in human heart it was 5.1±0.2s. The chest
muscle T1 value is in good agreement with the measurements in calf
muscle4 at 7T and the measured T1 of cardiac Pi follows
the trend of slightly shorter 31P T1s in the human heart compared
to skeletal muscle5. Values for each individual subject are given in
Table 1.
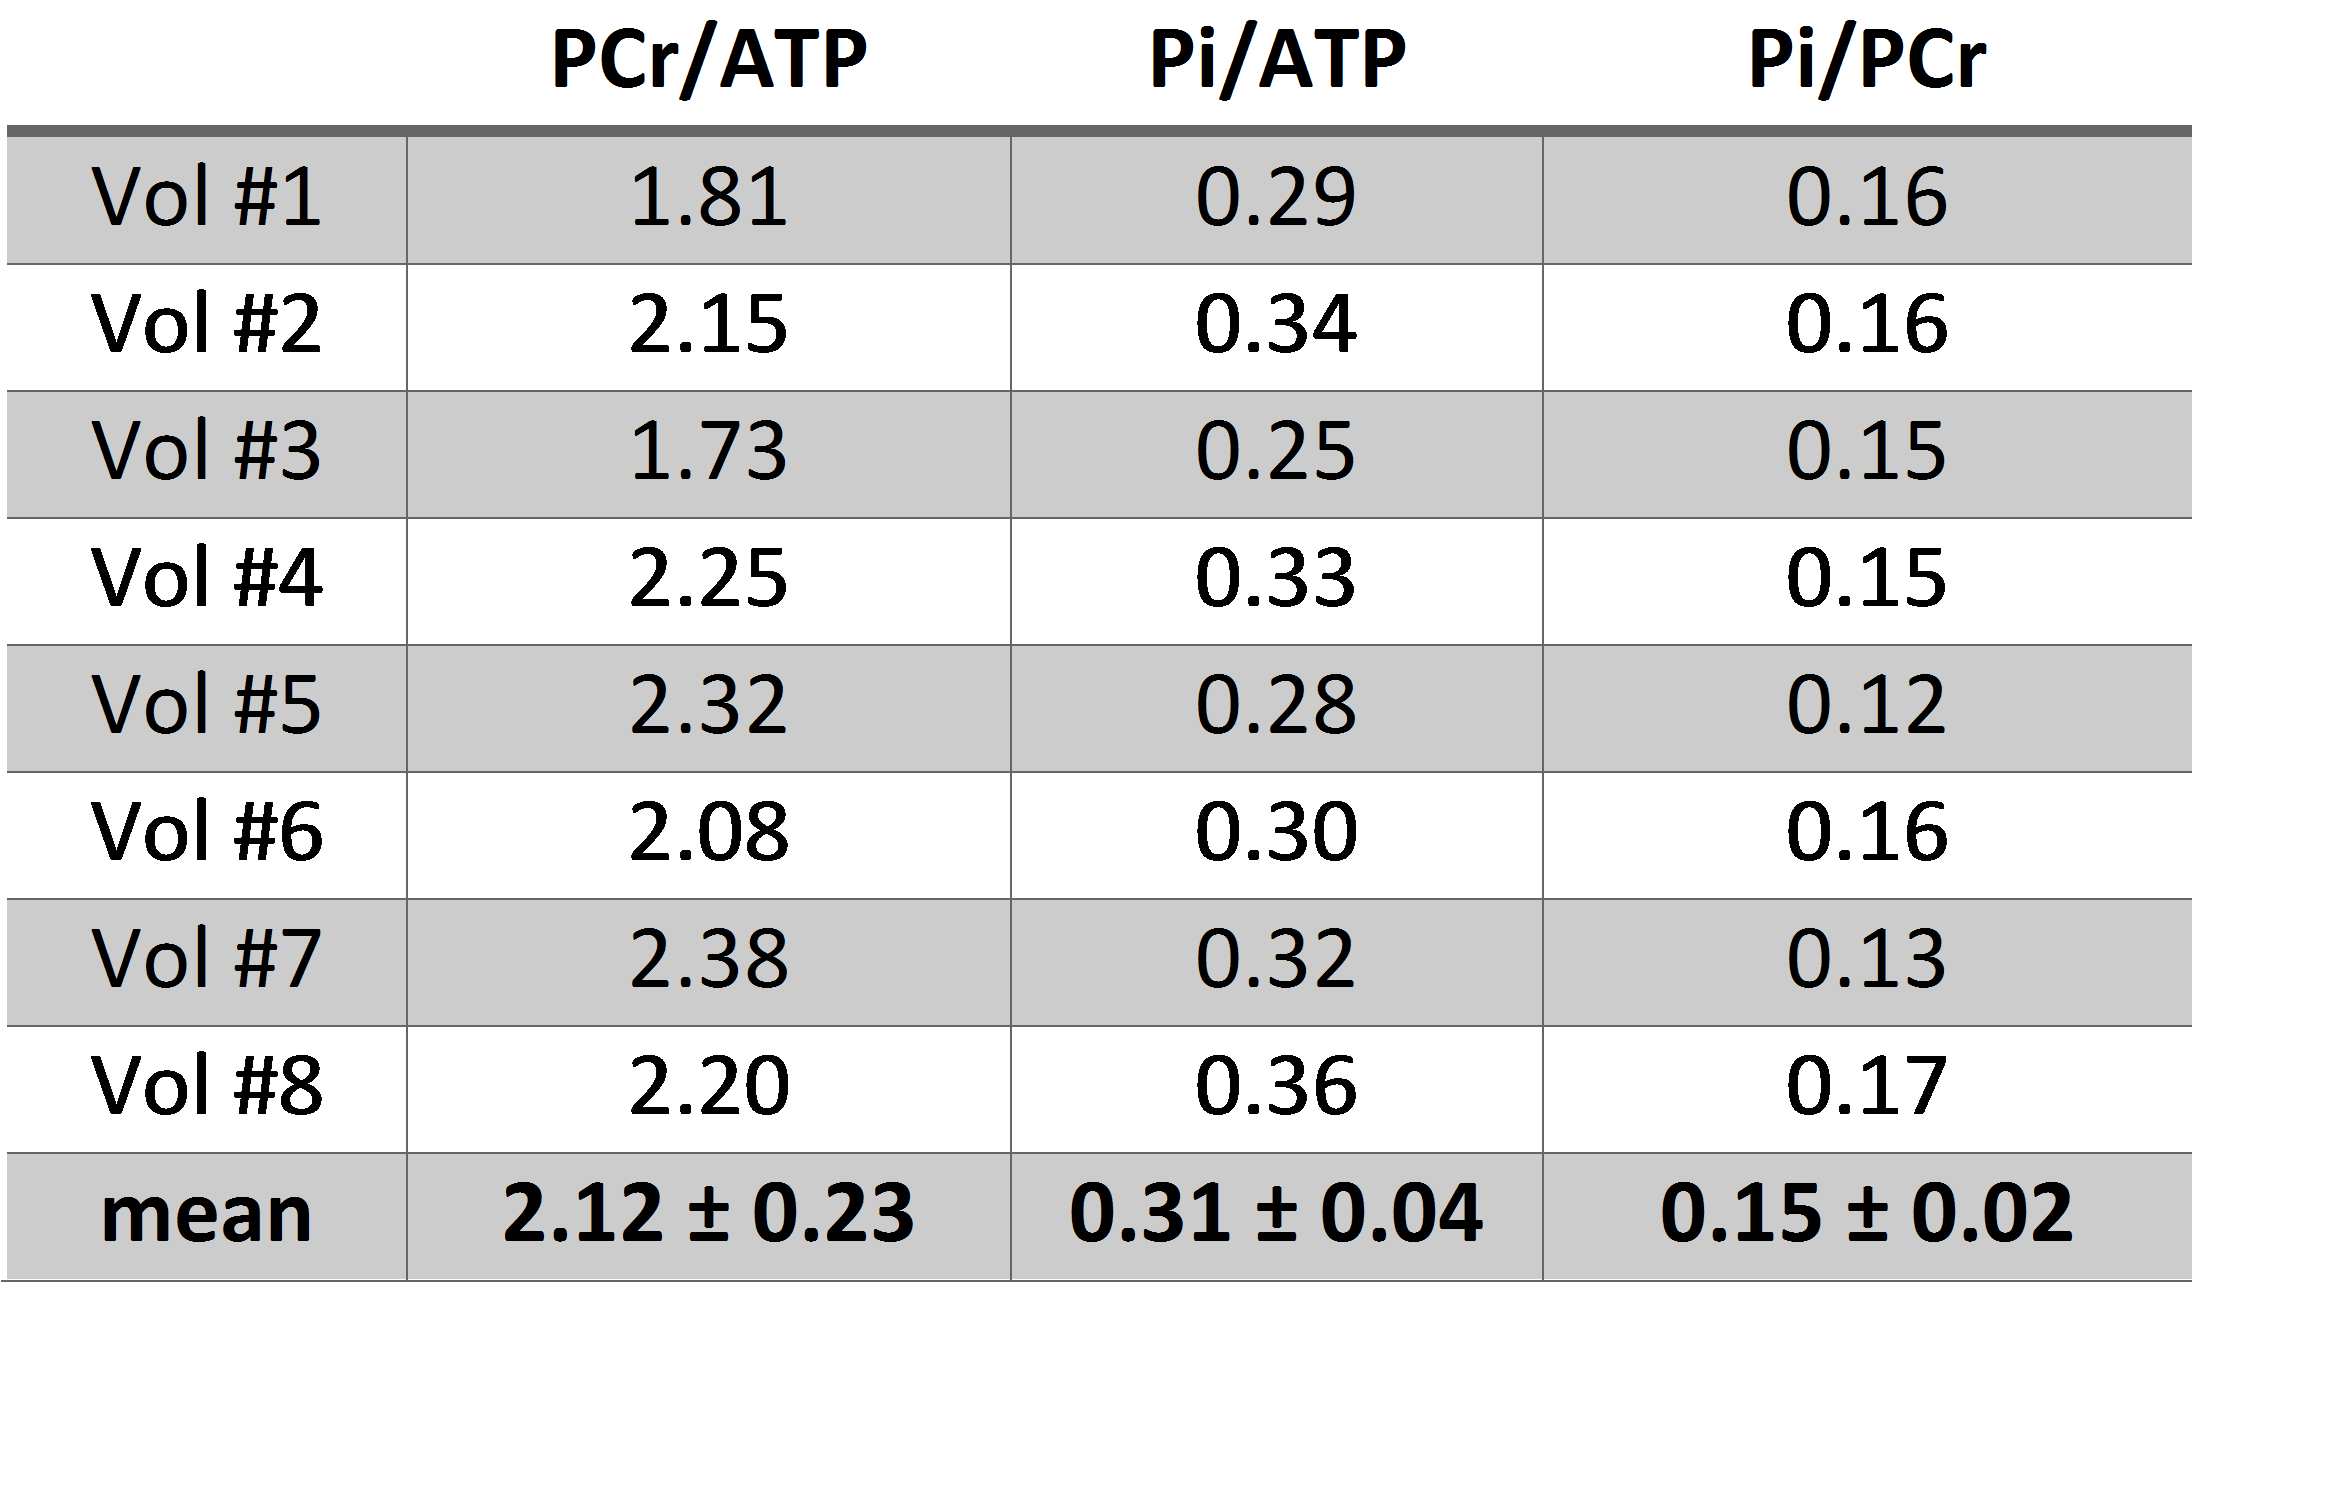
Table 2 shows the Pi ratios to ATP and PCr,
together with the PCr/ATP ratio, for each individual subject. The inter-subject
mean Pi/PCr ratio was 0.15±0.02, which is in good agreement with literature
values of 0.12±0.03 determined at 1.5T using proton decoupling to separate Pi
from 2,3-DPG signals (success rate in healthy volunteers was ~50% in these
studies)11,12.Conclusion
This study provides a longitudinal relaxation time of cardiac Pi at 7T measured by the dual-TR technique with adiabatic excitation. The measured T1 enables us to report the saturation-corrected Pi/PCr ratio for the first time in the human heart at 7T.Acknowledgements
We acknowledge financial support from the Sir Henry Dale Fellowship awarded jointly by the Wellcome Trust and the Royal Society (098436/Z/12/Z), and Slovak Grant Agencies VEGA (2/0001/17) and APVV (15-0029).References
1.
Bottomley P, et al. Radiology 1987;165:703-7
2.
Neubauer S, et al. Circulation 1992;86:1810-8
3.
Valkovič L,
et al. Proc ISMRM 2017;2933
4.
Bogner W, et al. Magn Reson Med 2009;62:574-82
5.
Rodgers CT, et al. Magn Reson Med 2014;72:304-15
6.
El-Sharkawy AM, et al. Magn
Reson Med 2009;61:785-95
7.
Schaller B, et al. Proc. ISMRM 2016;24:4006
8.
Robson MD, et al. Magn Reson Med 2005; 53:267-74.
9.
Yarnykh VL, Magn Reson Med 2007;57:192-200
10. Purvis LAB, et al. PLoS ONE
2017;12:e0185356
11. Luyten PR, et al. NMR Biomed
1989;1:177-83
12. Sieverding L, et al. Am J
Cardiol 1997;80:A34-40
Figures