3994
T1 values of phosphorus metabolites in the human visual cortex at 9.4 T1Magnetic Resonance Center, Max Planck Institute for Biological Cybernetics, Tübingen, Germany, 2Furtwangen University, Schwenningen, Germany, 3Biomedical Magnetic Resonance, University Tübingen, Tübingen, Germany
Synopsis
Ultra-high field has the potential to improve the quality of 31P spectroscopic applications due to the increased SNR and spectral dispersion. In addition, previous studies have reported a decreasing T1 with increasing field strength, which would further contribute to an improved quantification quality. In this study, we have measured the longitudinal relaxation time T1 in the visual cortex of healthy human subjects at 9.4 T, using an inversion-recovery technique. The values obtained were consistently lower than published data at 7 T, confirming observations of a decreasing T1 with field strength.
Introduction
31P spectroscopy offers the unique possibility to directly observe the major metabolites involved in the energy metabolism in vivo and non-invasively. However, the low NMR sensitivity of the 31P nucleus and the low concentration of the phosphorus metabolites, together with their short T2 and long T1 values, make 31P spectroscopy challenging, requiring large voxel sizes and long scan durations for often still noisy measurements. Ultra-high field has the potential to improve the quality of 31P spectroscopic applications due to the increased SNR and spectral dispersion. In addition, previous studies have reported a decreasing T1 with increasing field strength, which would further contribute to an improved quantification quality. In this study, we have measured the longitudinal relaxation time T1 in the visual cortex of healthy human subjects at 9.4 T to verify the T1 reduction at higher fields and to enable sequence optimization and metabolite quantification.Methods
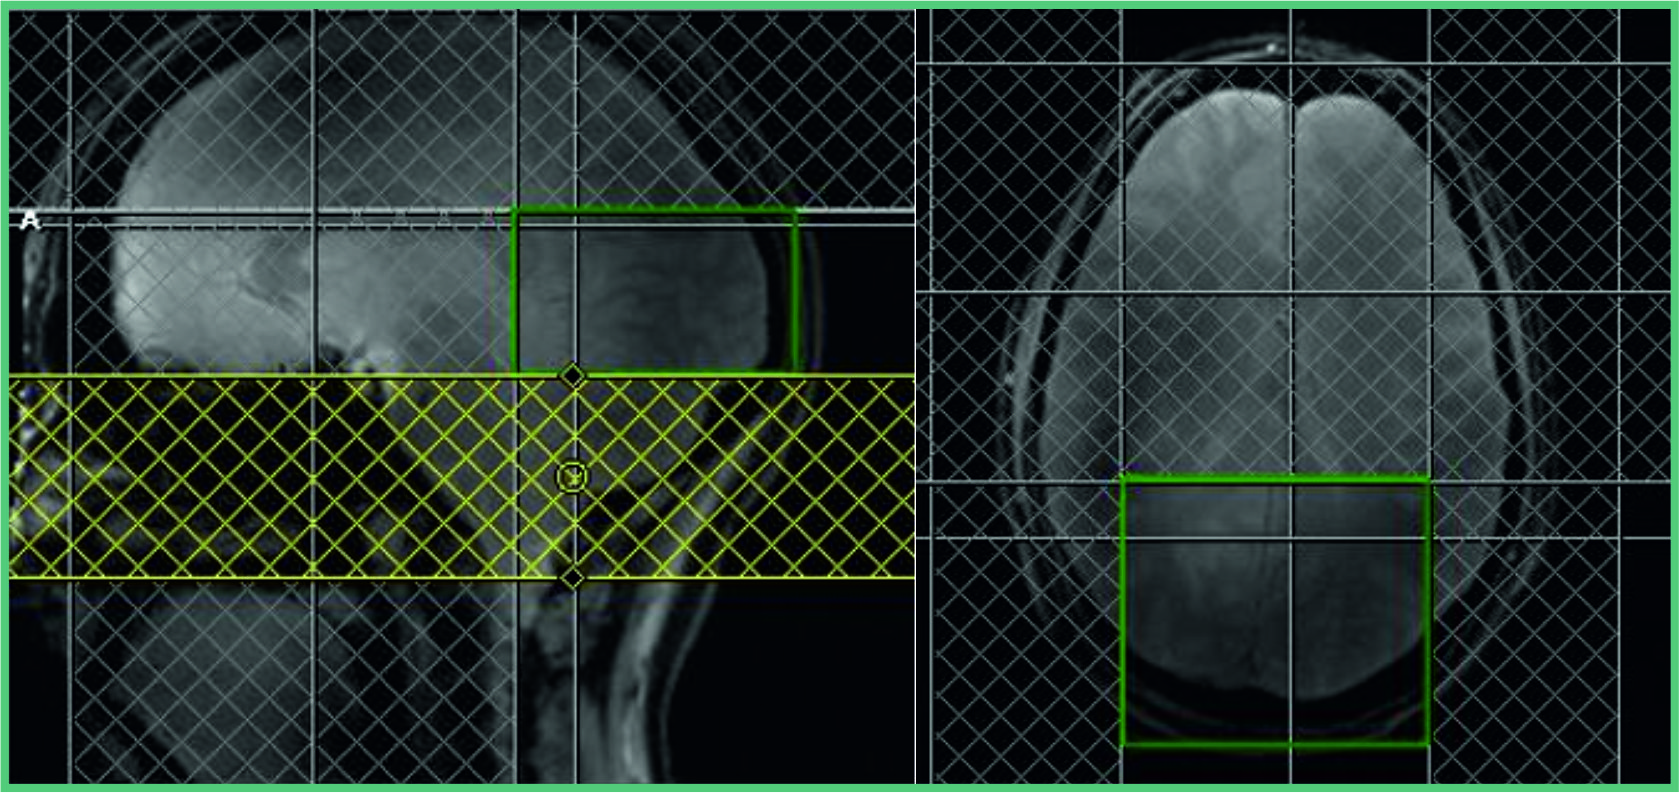
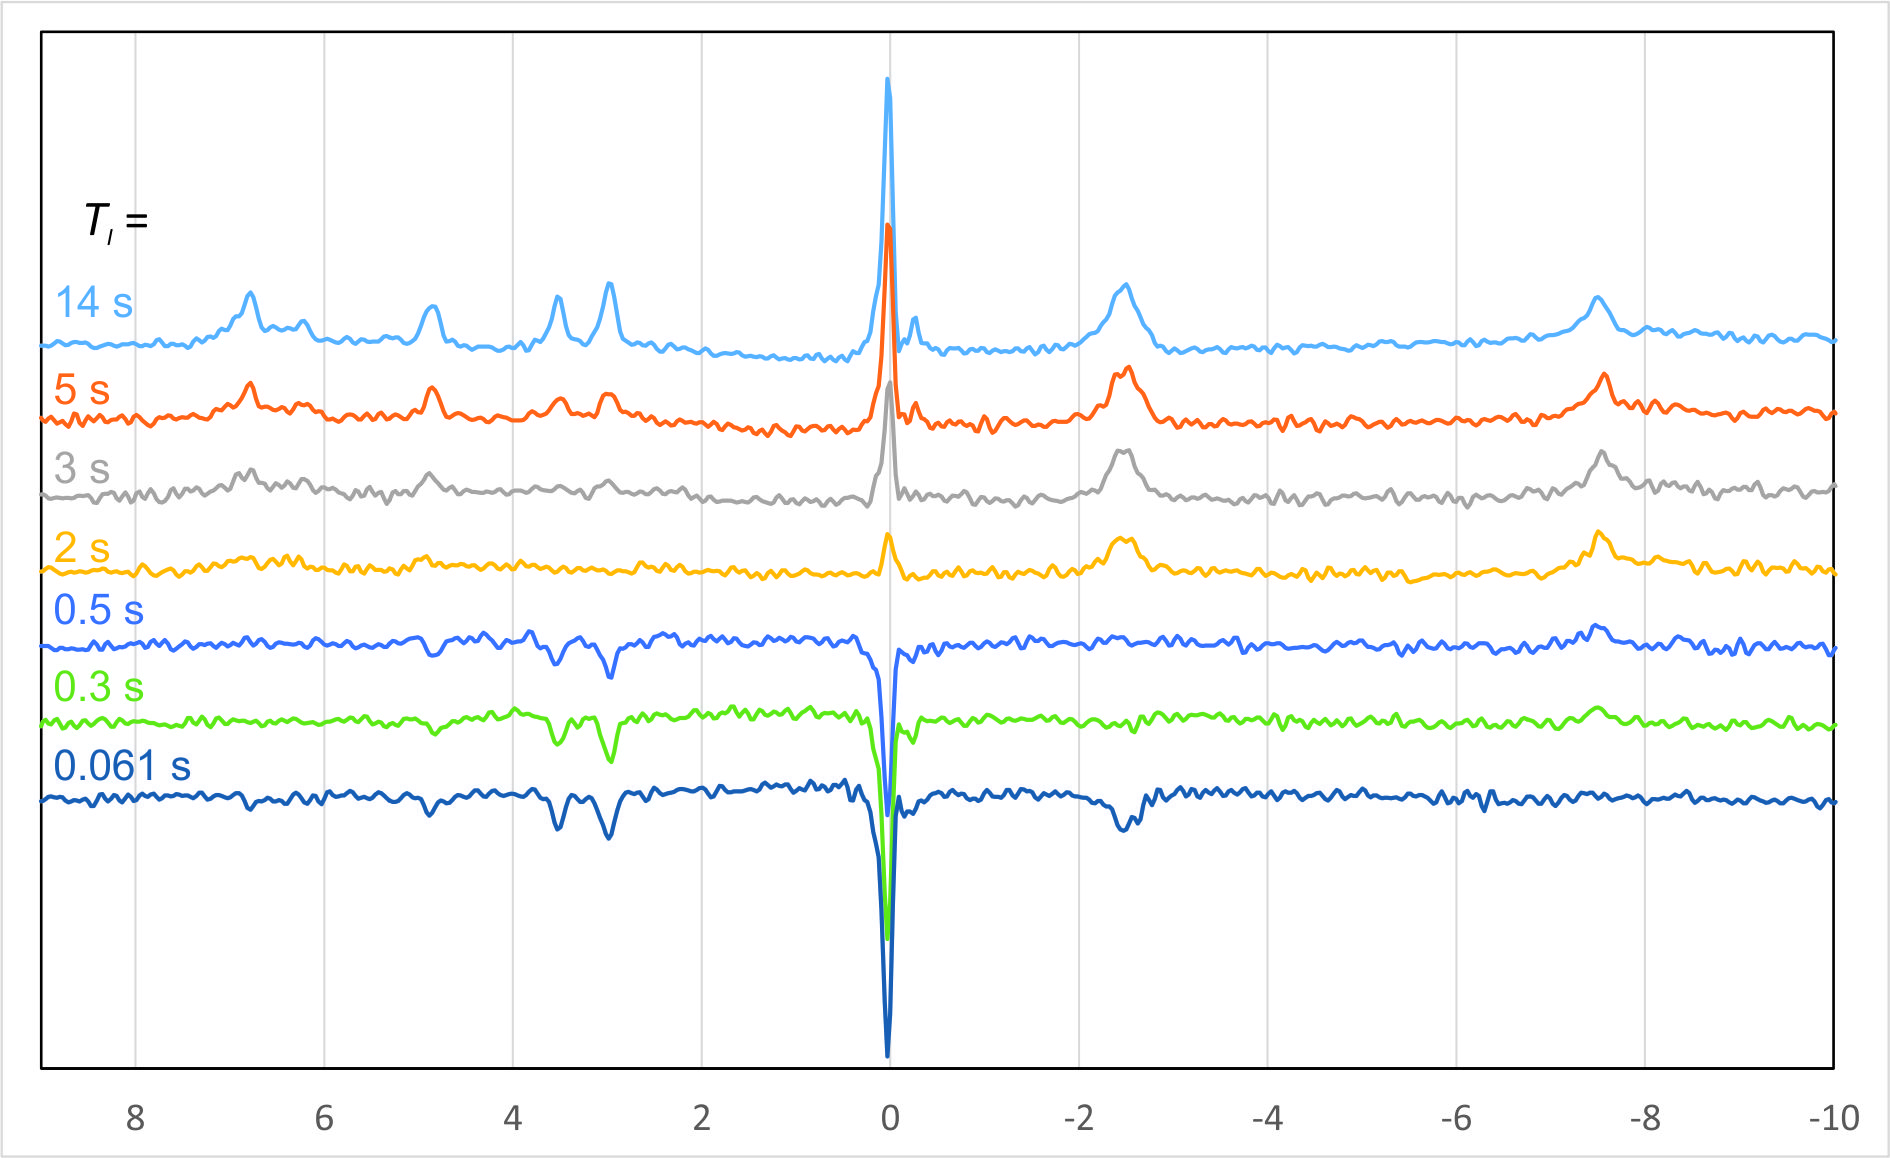
Five healthy subjects were examined at a field strength of 9.4 T, using a home-built 31P array coil, consisting of four 1H dipole antennae for shimming and localizer images, four 31P transmit loops and 27 31P receive coil elements positioned on a tight fitting helmet1. Since we are only interested in the visual cortex, only signals from the two receive coil elements just below the visual cortex were used. T1 is measured using an inversion-recovery technique consisting of a simple pulse-acquire sequence, preceded by an inversion pulse. Seven saturation slices around the visual cortex are used to further define a region of interest and suppress signal contributions from outside. The positions of the saturation slices and the ROI are shown in Fig. 1. For inversion, a 15 ms TR-FOCI pulse was used, while the FID was acquired after a 0.3 ms nonselective block pulse. 512 samples were recorded within 51 ms with a bandwidth of 10000 Hz. Seven inversion times TI between 61 ms and 14 s were applied, each measured with 20 averages (except for the TI = 14 s measurement, for which 40 averages were acquired) and a TR of 15 s. For analysis, the signals from the two coil elements were phased and added manually and the AMARES algorithm in the jMRUI software package was used to obtain signal amplitudes. The TI = 14s scan, which was acquired with a larger number of averages and thus has a high SNR, was used to determine the prior knowledge for optimal fitting. The amplitudes found in jMRUI are then used to fit an exponential relaxation curve, taking into account that the relaxation delay is not always larger than 5 T1.Results
For all subjects, all spectra had excellent quality and could be fitted in jMRUI with high precision. Spectra from one subject and all seven inversion times are shown in Fig. 2. The resulting values for the T1 times of 9 metabolite peaks in comparison to previously published 7T data2 are shown and listed in Fig. 3. In addition, the linewidths obtained from the TI = 14 s measurements can be used to determine the T2*-values of the 31P metabolites (Fig. 4).Discussion
Due to the high SNR, the increased spectral dispersion of 31P metabolite peaks at 9.4 T and the correspondingly high spectral quality, T1 times could be determined with high accuracy in all subjects. The T1 values found here were lower than previously published data from 7 T, which might be attributed to a strong contribution of chemical shift anisotropy to the relaxation process. A literature review over a larger range of field strengths, including also data from rat brain and muscle spectroscopy, also points towards a decrease of the T1 of PCr with increasing field strength (Fig. 5).Conclusion
At 9.4 T, 31P spectra with excellent quality can be acquired within reasonable time. The lower T1 values at higher field strength are another advantage of ultra high field for 31P spectroscopy.Acknowledgements
No acknowledgement found.References
1. Mirkes C, Shajan G, Chadzynski G, Buckenmaier K, Bender B, Scheffler K. (31)P CSI of the human brain in healthy subjects and tumor patients at 9.4 T with a three-layered multi-nuclear coil: initial results. Magn Reson Mater Phy 2016;29(3):579-589.
2. Ren J, Sherry AD, Malloy CR. (31)P-MRS of healthy human brain: ATP synthesis, metabolite concentrations, pH, and T1 relaxation times. NMR Biomed 2015;28(11):1455-1462.
Figures