3993
Functional phosphorus spectroscopy of the human visual cortex at 9.4 T1Magnetic Resonance Center, Max Planck Institute for Biological Cybernetics, Tübingen, Germany, 2Furtwangen University, Schwenningen, Germany, 3Biomedical Magnetic Resonance, University Tübingen, Tübingen, Germany
Synopsis
Functional 31P spectroscopy has been investigated in several studies with greatly varying results, which may be due to the low sensitivity of the 31P nucleus. We have taken advantage of the high SNR at 9.4 T to acquire spectra from the human visual cortex under stimulation. Experiments were performed with different localization volumes, defined by saturation pulses. In spite of the excellent quality of the obtained data, no stimulation-related changes in metabolite concentrations or resonance frequencies could be detected.
Introduction
The effect of stimulation on the amplitudes, linewidths or chemical shifts of the MR-visible 31P metabolites in the human brain has been investigated in several publications with highly varying results1-4. A major reason for this discrepancy may be the low SNR and the correspondingly high uncertainties in the quantification as well as the large voxel volumes. The increased SNR and spectral dispersion at ultra-high field can help to acquire improved functional 31P data to determine potential changes in metabolite concentrations during brain activity.Methods
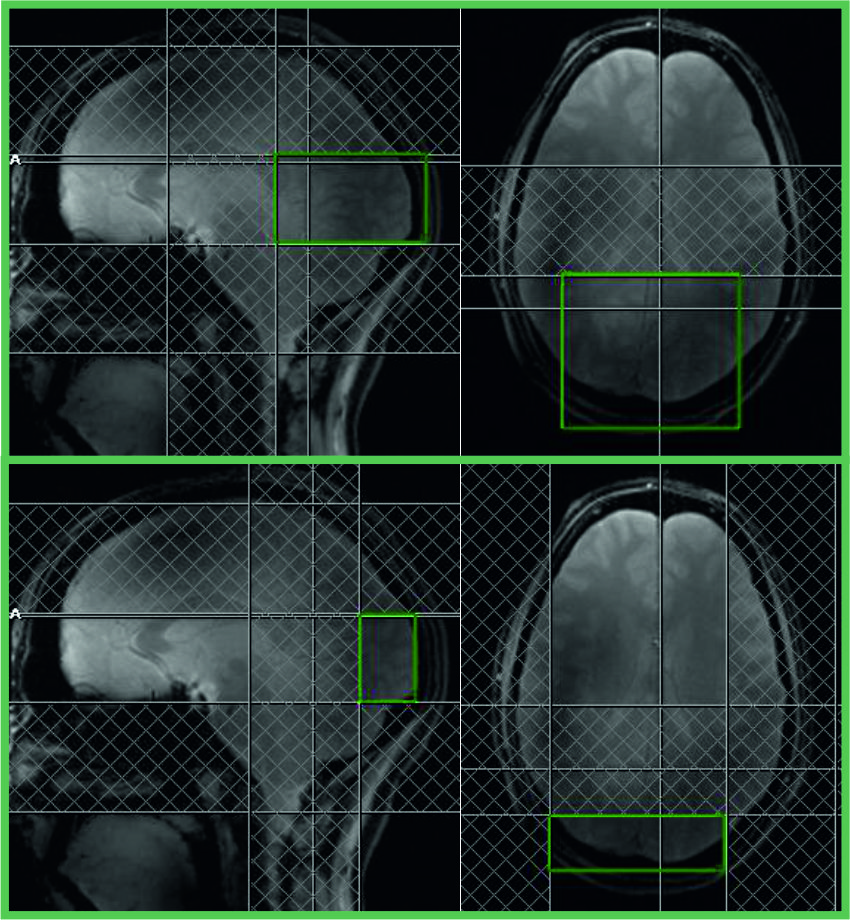
Five healthy subjects were examined at 9.4 T with a home-built 31P coil array, consisting of four 1H dipole antennae for shimming and localizer images, four large 31P transmit loops and 27 31P receive coils on a close fitting helmet5. To obtain localized signals from the visual cortex, only signals from those two receive coil elements that are positioned right below the visual cortex were used. A rotating checkerboard was projected onto the eyes of the subjects with the aid of a mirror placed above the subject’s eyes. For spectroscopy, a simple pulse-acquire sequence was applied to record 512 samples with a bandwidth of 10000 Hz within 51 ms. Three different protocols were used: A first protocol was optimized for highest possible SNR by acquiring spectra with the shortest possible TR of 60 ms. In the second protocol, the spatial localization was improved by positioning three saturation slices around a brain region containing the visual cortex. Due to the high SAR of the saturation pulses, the TR had to be increased to 320 ms. In the third protocol, the localization was further improved by applying five saturation pulses and reducing the unsaturated volume by 70%, yielding a shortest possible TR of 500 ms. The size and positions of the ROIs and the saturation slices are visualized in Fig. 1. In all experiments, the Ernst angle was used for excitation. The stimulus consisted of around 20 s rest to reach a steady state signal amplitude, followed by a series of 30 s stimulus / 30 s rest, repeated eight times in the first two protocols and ten times in the third one. For analysis, the signals from the two receive coil elements were phased and added manually in Matlab. Only signals from the second half of the stimulus and rest periods were taken into account to allow for 15 s to reach a physiological steady state. All stimulus and rest signals were added, yielding just one spectrum for stimulus and one for rest per experiment. These spectra were analyzed with the AMARES algorithm in the jMRUI software package. Peak amplitudes, linewidths and frequencies of all five subjects for each protocol were then compared by a paired t-test to detect stimulation-induced changes.Results
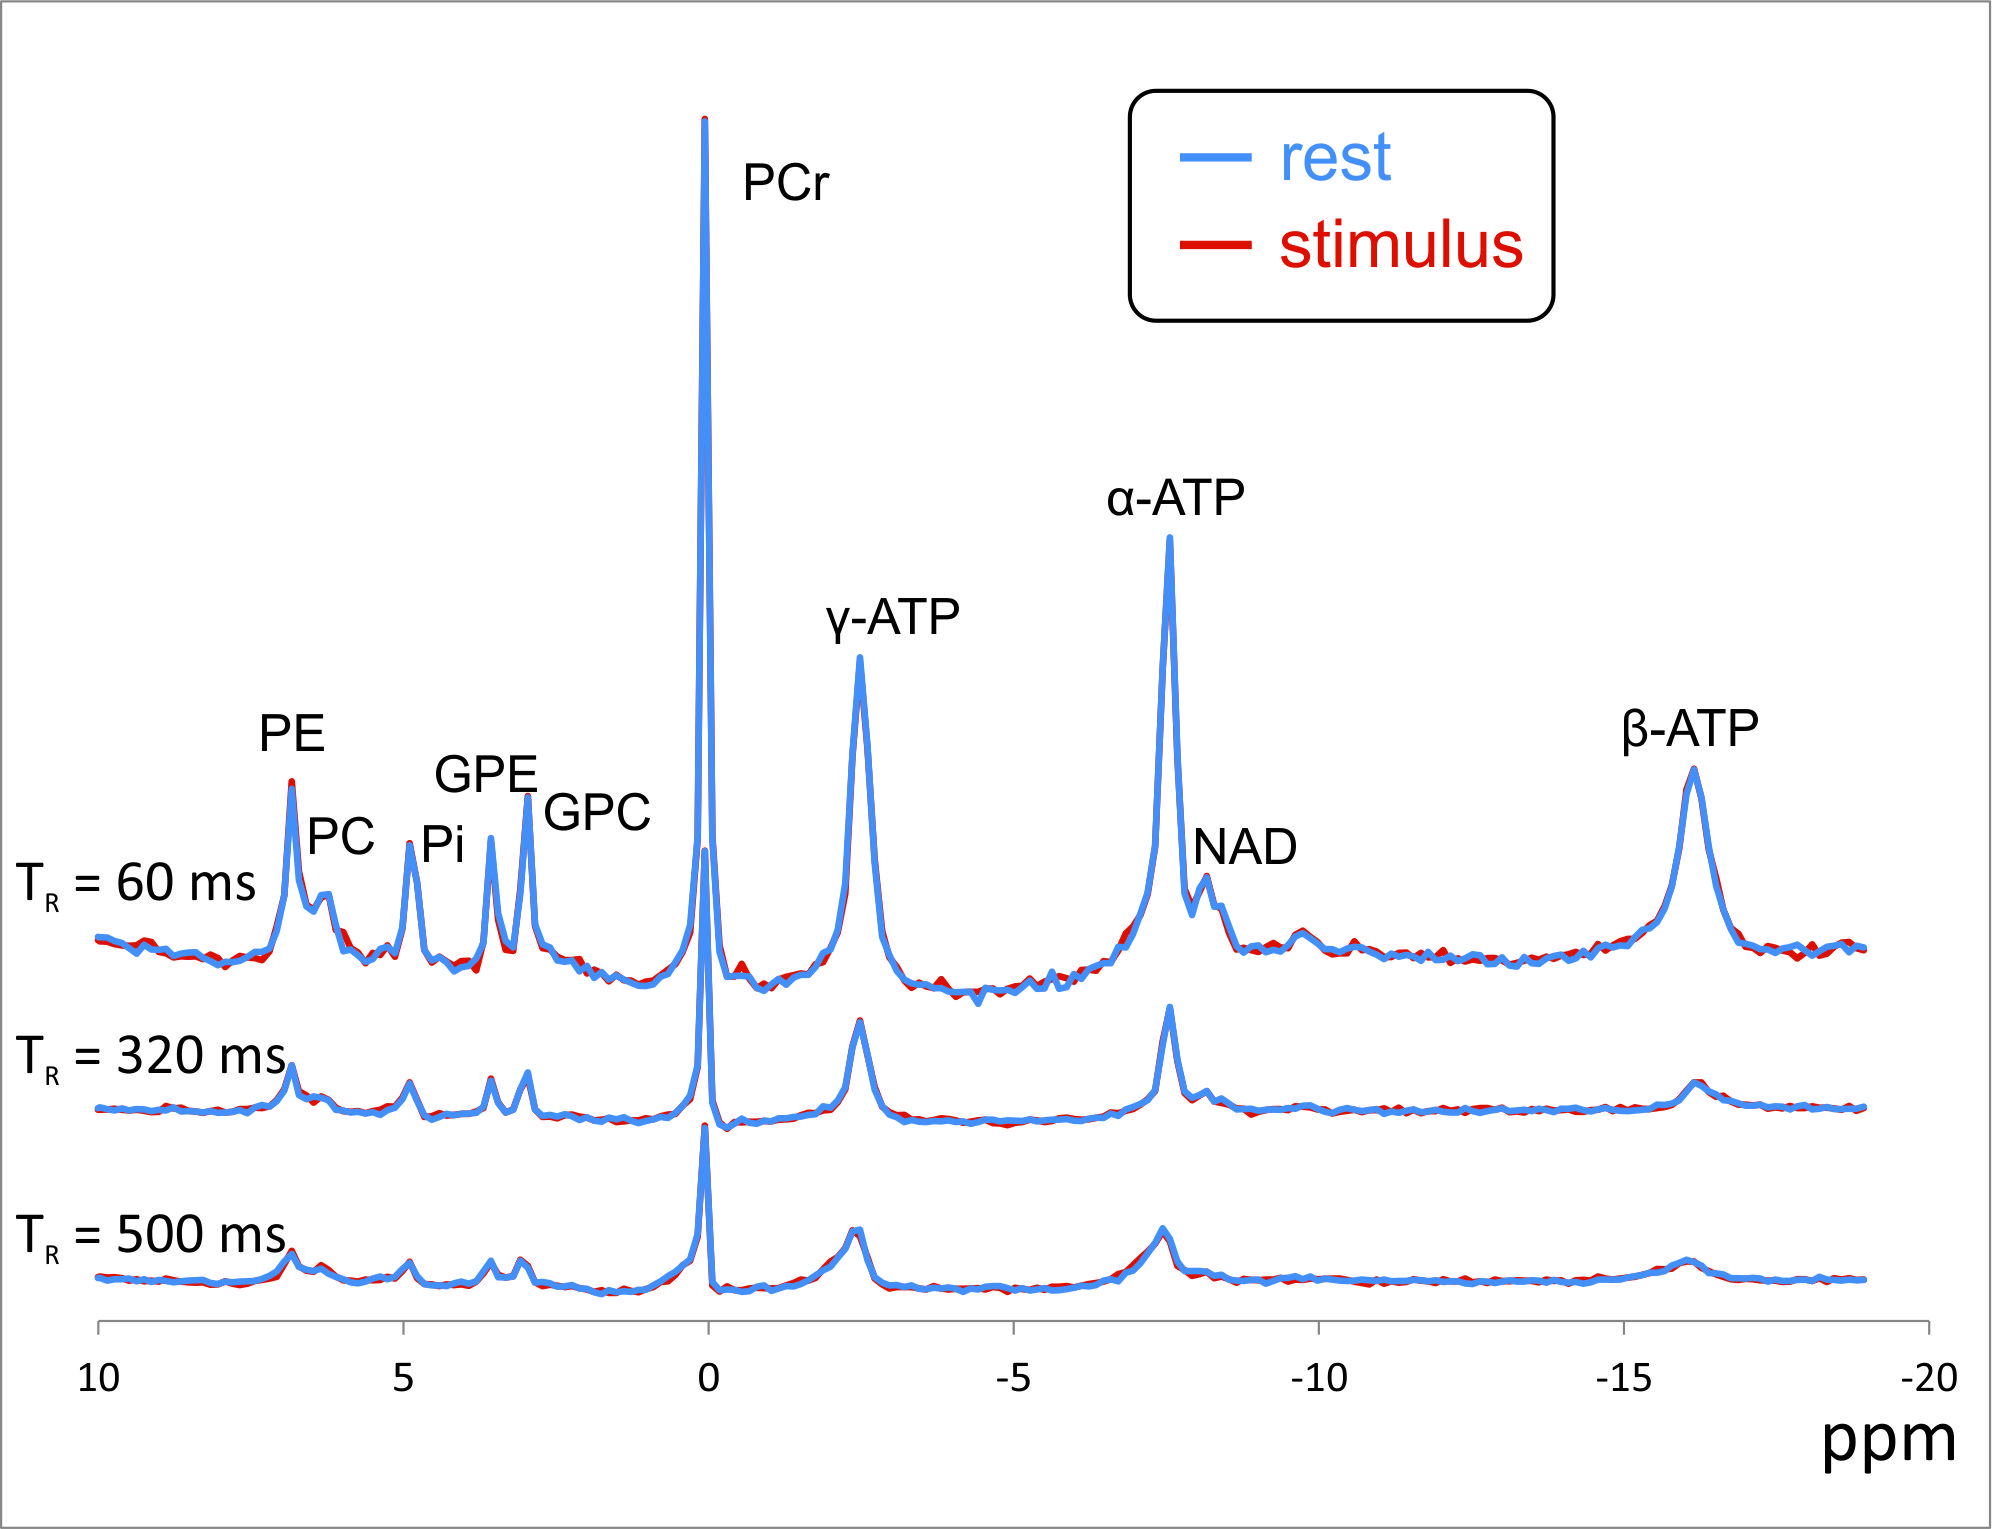
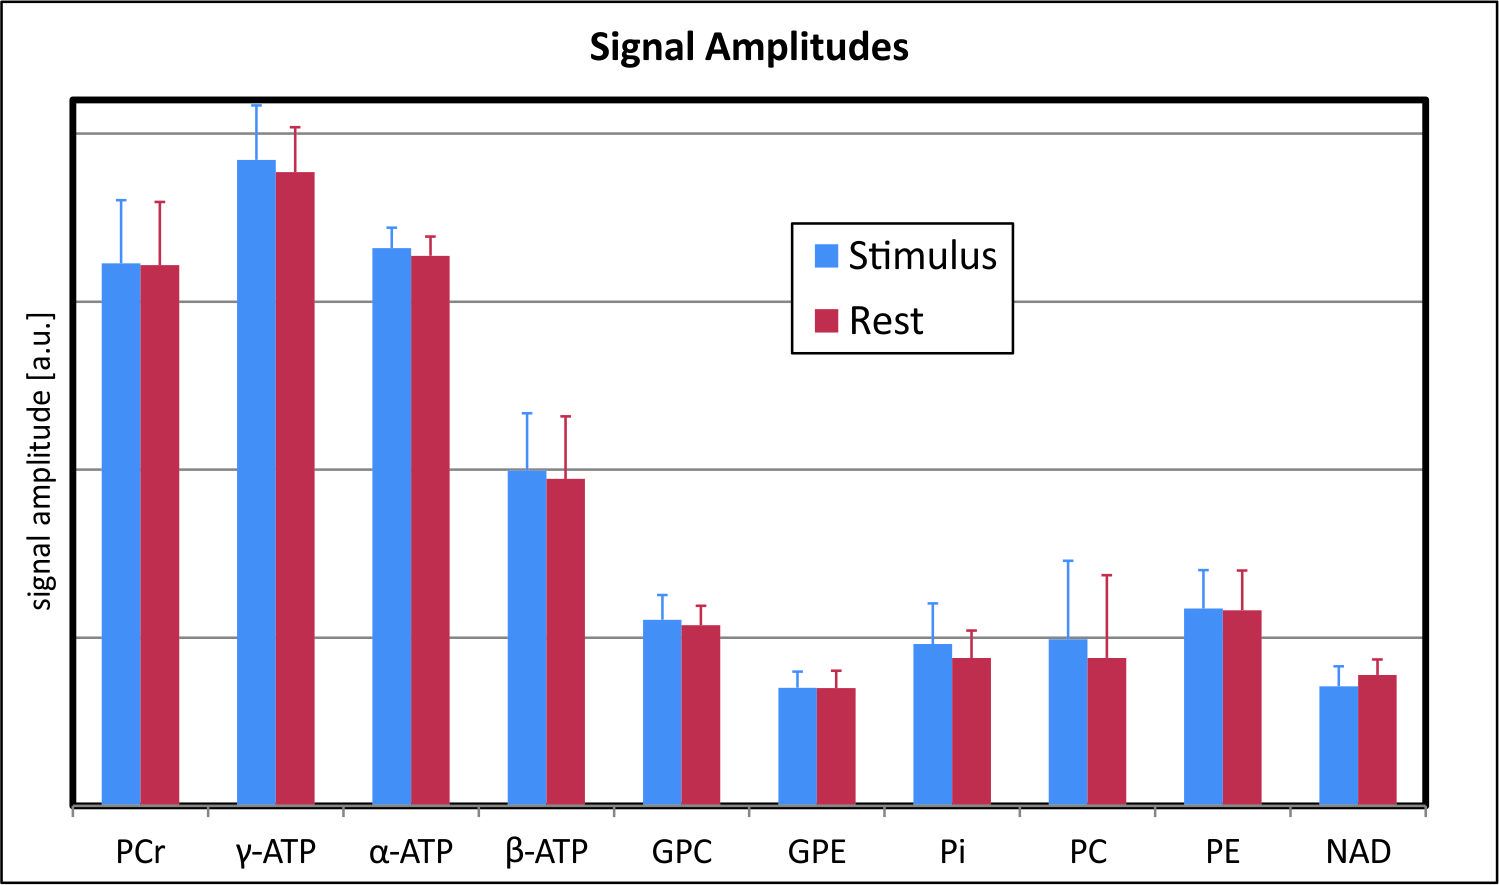
All experiments resulted in excellent spectra (Fig. 2), in which 10 metabolite peaks could be fitted with high quality. No significant differences in peak amplitudes (Fig. 3) or frequency shifts were found. For the protocols with improved localization, the linewidth of the PCr peak was slightly, but significantly (p ≤ 0.05) higher during stimulus as compared to rest.Discussion
Previous studies have found contradictory results on the effect of visual stimulation on the spectroscopic profile of 31P-visible metabolites. Here, we used the improved SNR and spectral dispersion at 9.4 T to obtain functional data of the visual cortex. In spite of the high quality of the resulting 31P spectra, we were not able to see significant differences in the amplitudes or the frequencies of the observed resonance peaks. One possible reason for the lack of metabolic changes during stimulation might be the still relatively large size of the observed volume, which, in spite of the relatively small ROI in the third protocol, may still be much larger than the really activated region.Conclusion
In spite of the high quality of 31P spectra from the visual cortex at 9.4 T, no variations of metabolite peaks could be observed for visual stimulation. Further experiments, using still smaller VOIs may be necessary to determine if changes in metabolite concentrations or pH can be found.Acknowledgements
No acknowledgement found.References
1. Rango M, Castelli A, Scarlato G. Energetics of 3.5 s neural activation in humans: a 31P MR spectroscopy study. Magn Reson Med 1997;38(6):878-883.
2. Vidyasagar R, Kauppinen RA. 31P magnetic resonance spectroscopy study of the human visual cortex during stimulation in mild hypoxic hypoxia. Exp Brain Res 2008;187(2):229-235.
3. Barreto FR, Costa TB, Landim RC, Castellano G, Salmon CE. (31)P-MRS using visual stimulation protocols with different durations in healthy young adult subjects. Neurochem Res 2014;39(12):2343-2350.
4. Kato T, Murashita J, Shioiri T, Hamakawa H, Inubushi T. Effect of photic stimulation on energy metabolism in the human brain measured by 31P-MR spectroscopy. J Neuropsychiatry Clin Neurosci 1996;8(4):417-422.
5. Mirkes C, Shajan G, Chadzynski G, Buckenmaier K, Bender B, Scheffler K. (31)P CSI of the human brain in healthy subjects and tumor patients at 9.4 T with a three-layered multi-nuclear coil: initial results. Magn Reson Mater Phy 2016;29(3):579-589.
Figures