3989
Influence of BMI and hepatic lipids on absolute quantification of 31P metabolites at 7T1Division of Endocrinology and Metabolism, Department of Medicine III, Medical University of Vienna, Vienna, Austria, 2High-field MR Centre, Department of Biomedical Imaging and Image-guided Therapy, Medical University of Vienna, Vienna, Austria, 3Center for Biomedical Imaging, Department of Radiology, New York University School of Medicine, New York, NY, United States, 4Christian Doppler Laboratory for Clinical Molecular MR Imaging, Vienna, Austria, 5Faculty of Healthcare, University of Prešov, Prešov, Slovakia, 6Department of Radiology, General Hospital of Levoča, Levoča, Slovakia
Synopsis
This study focuses on absolute quantification of hepatic 31P metabolites at ultra-high field (7T) and the possible influence of BMI and hepatocellular content of lipids (HCL) on the calculated metabolite concentrations. Significant differences were found in γ- and α-ATP as well as in Pi content for population groups with normal and high BMI. With the assessment of HCL it is possible to correct for those differences and no significances could be reported after.
Purpose
Diffuse liver diseases often manifest in changes of phosphorus (31P) metabolite concentrations1. Concentrations of the liver 31P metabolites can be affected by wrong assumption of a reference signal, signal from gall bladder and contents of hepatocytes2-5. Absolute quantification offers a possibility to support diagnosis and help understanding pathologies on a molecular basis1. The quantification is based on reciprocity calibration using a reference phantom. Compared to quantification using an internal reference, the phantom replacement technique does not depend on the assumption of a metabolite with constant concentration2 – which can be affected by pathology in the tissue of interest. In particular adenosine triphosphate (ATP) resonances since it is commonly used metabolite as internal reference standard. Measurements of 31P metabolite concentrations on clinical MR scanners with sufficient spectral resolution and SNR requires good B0 homogeneity and long acquisition times. An additional signal enhancement methods such as proton decoupling or NOE, require sophisticated hardware and sequence. Ultra-high field MR spectroscopy (MRS) improves spectral resolution and SNR per time unit3 and for achieving higher resolution or shorter scan times does not require special hardware. Magnetic field of 7T enables to reliably quantify 10 hepatic 31P metabolites from large portion of the liver tissue in less than 20min3. This study focuses on the influence of body mass index (BMI) and hepatic lipid accumulation on the 31P concentrations and on a possible differences between population groups.
Subjects/Methods
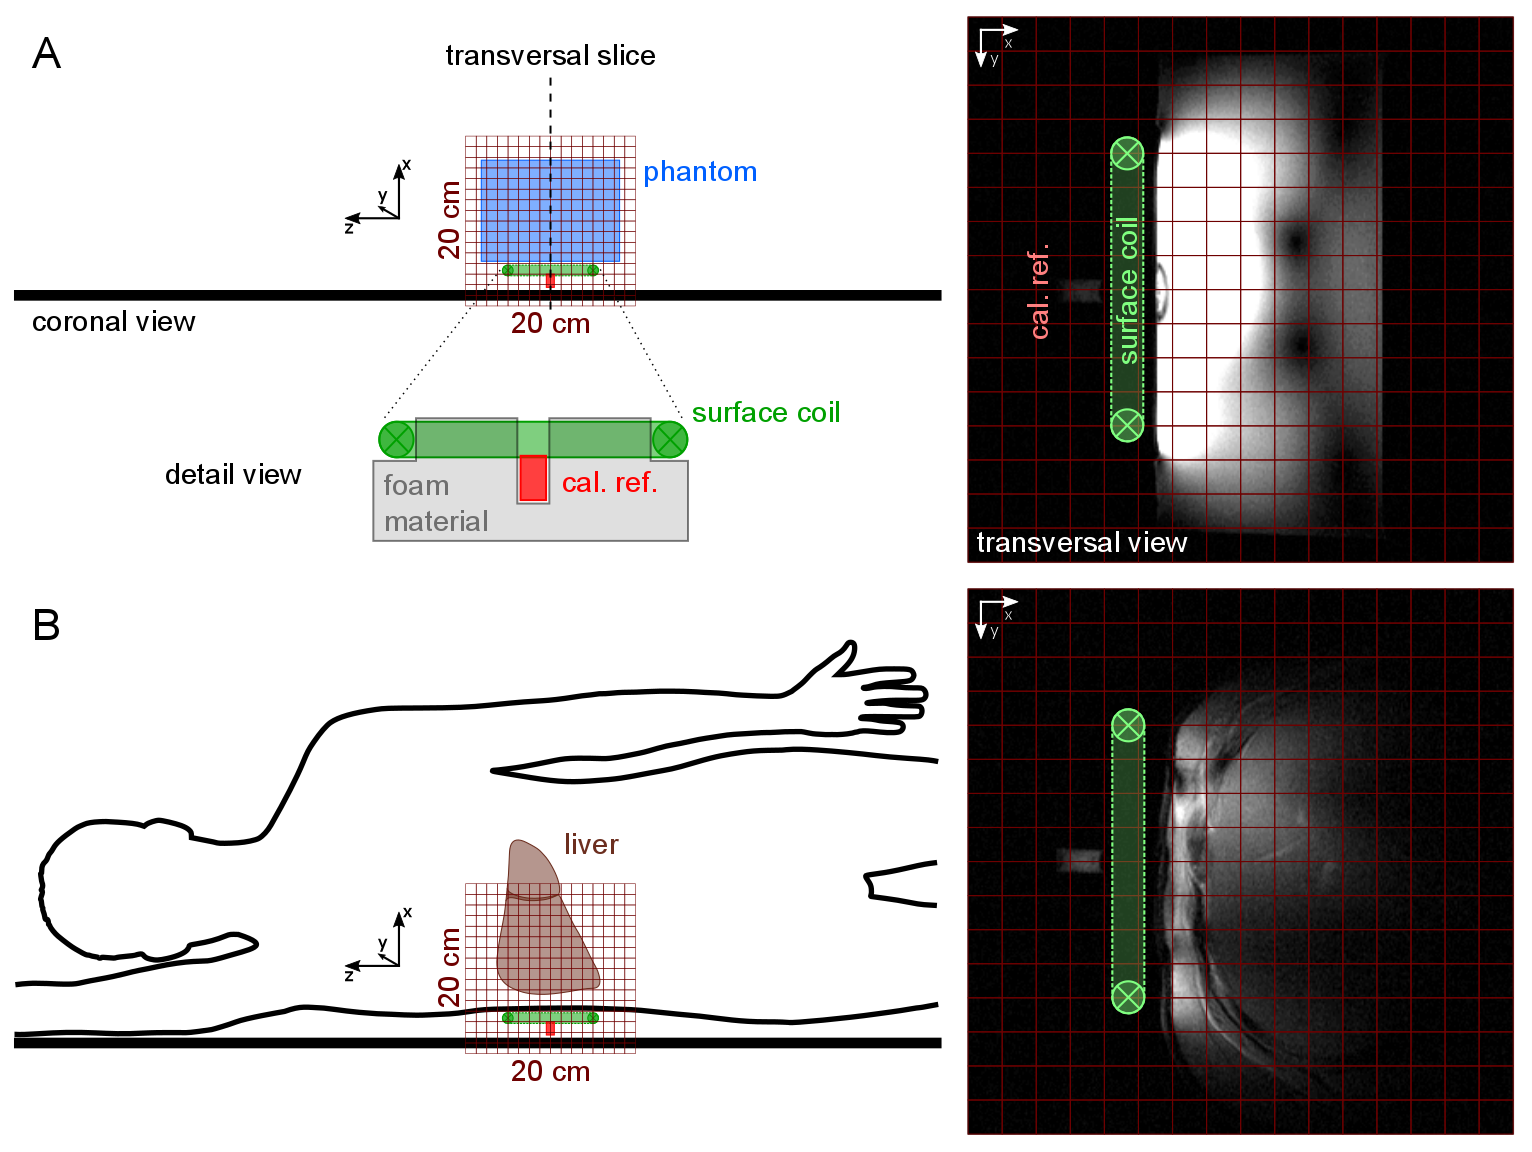
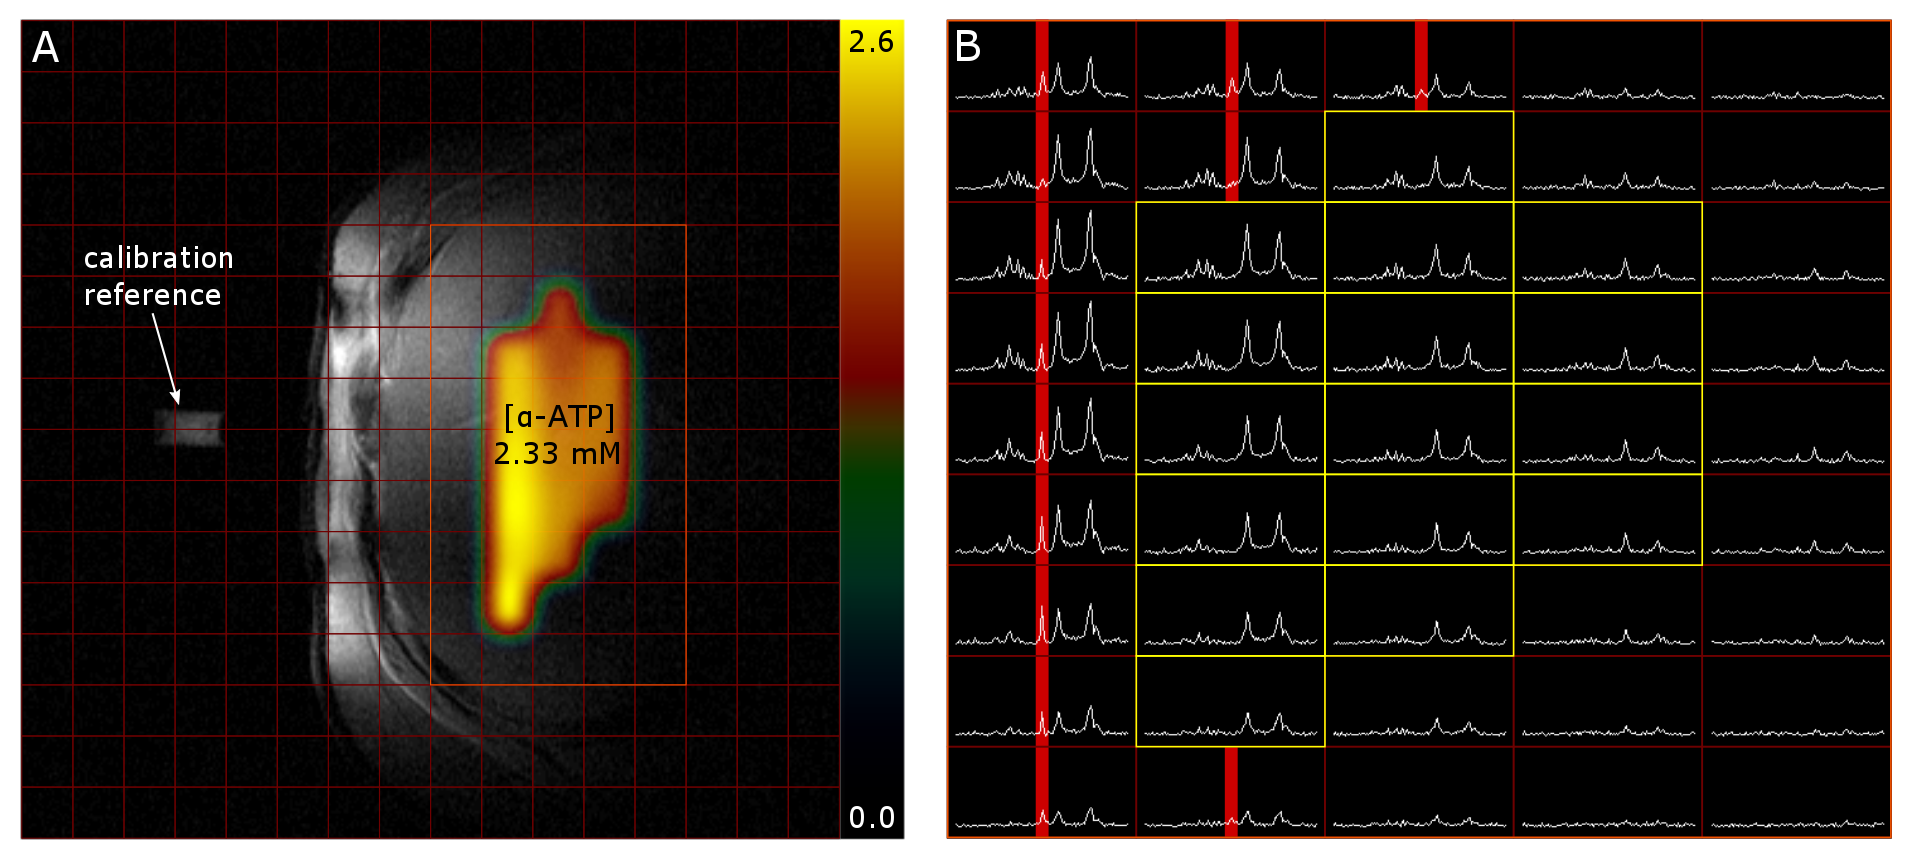
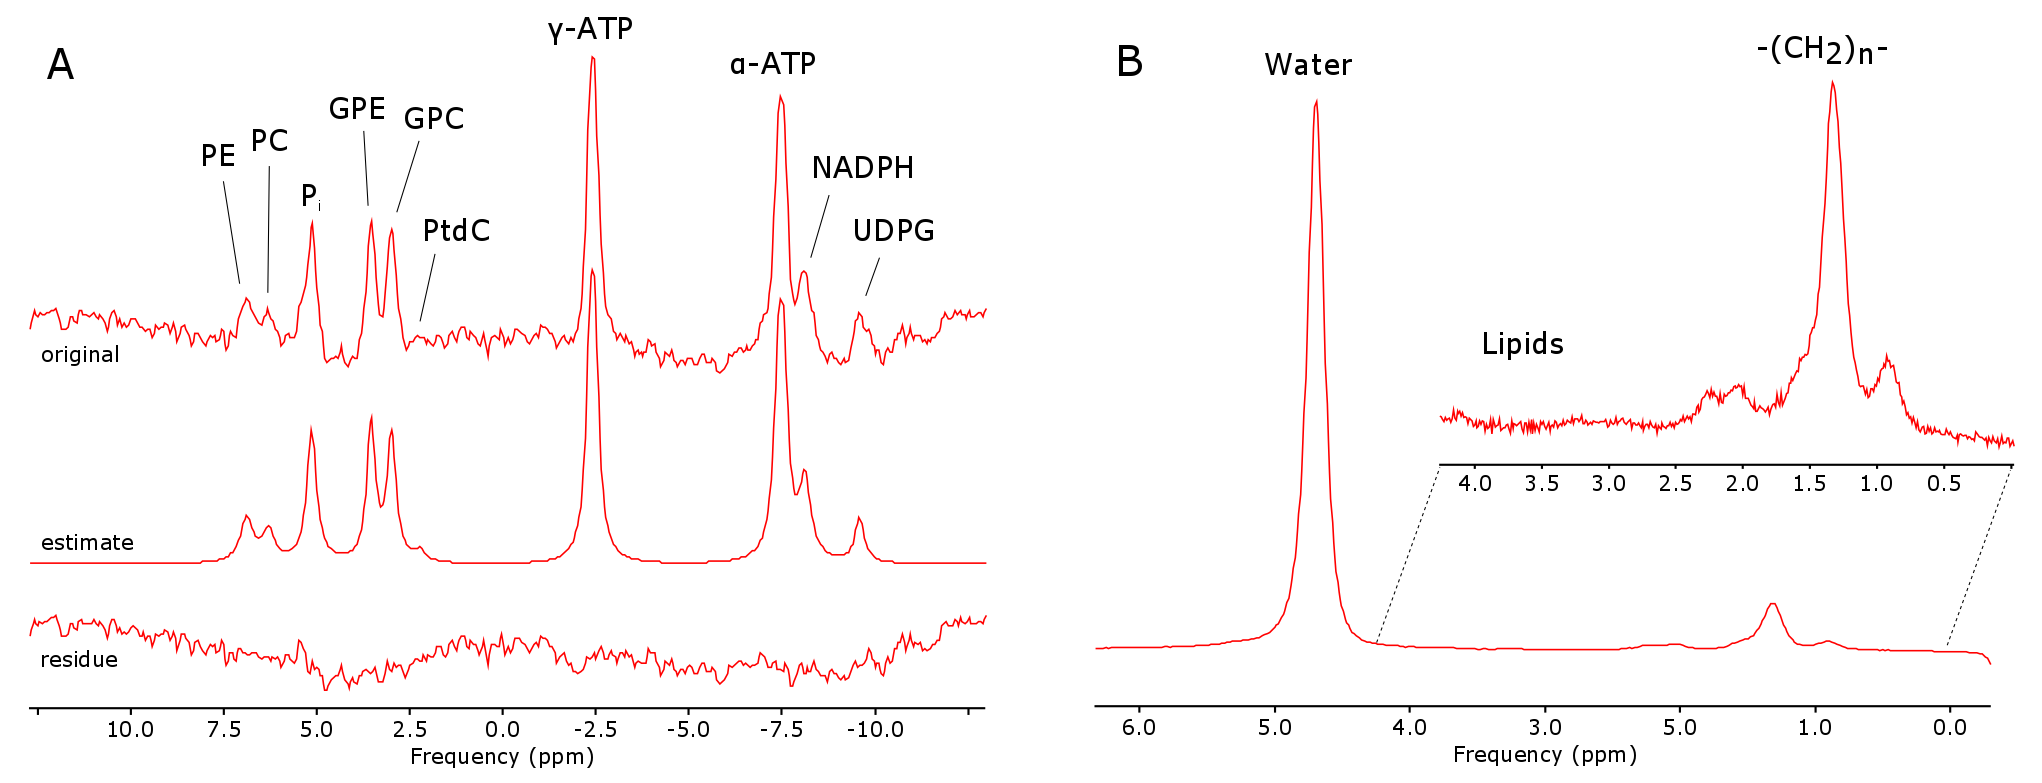
14 healthy volunteers (9m/5f, age: 58.9±7.3y, range: 48.1—71.4y) were arranged in 2 groups according to their BMI with cut-off threshold of 25kg.m-2 (n=7/7, BMI=21.5±1.2kg.m-2/ 28.5±2.2kg.m-2). Measurements were performed on a 7T MR system (Siemens Healthineers, Erlangen, Germany) using a double-tuned 1H/31P surface coil (10cm, RAPID Biomedical, Rimpar, Germany). We used 3D-MRSI sequence based on FID acquisition (TE=0.9ms, TR=1.8s, FOV: 20x20x20cm³, 12x12x12 matrix zero-filled to 16x16x16, 600µs block pulse). 31P containing reference sample was fixed in space relative to the coil and served for coil load correction and guidance for MRSI volume placement. A Hamming filter was applied in k-space on each dataset to reduce voxel bleeding. In order to create correction maps for the B1 field distribution of the coil a MRSI with phantom containing 15mmol/L 31P (in the form of KH2PO4 dissolved in water) was measured with various frequency offsets on the corresponding 31P metabolite resonances. In vivo MRSI data were assessed from volunteers in a right lateral position on top of the RF-coil (Fig.1). Spectra of selected voxels (located in the liver, with sufficient SNR and no obvious phosphocreatine (PCr) contamination (Fig.2)) were fitted with jMRUI using AMARES6. Prior knowledge consisted of spectral lines for phosphoethanolamine (PE), phosphocholine (PC), inorganic phosphate (Pi), glycerolphosphoethanolamine (GPE), glycerophosphocholine (GPC), phosphatidylcholine (PtdC), γ- and α-ATP, nicotinamide adenine dinucleotide-phosphate (NADH) and uridine diphosphate-glucose (UDPG) (Fig.3A). The results were compared to the corresponding voxel position and frequency offset of the phantom MRSI dataset in order to calculate the absolute metabolite concentrations. Weighted means based on signal intensity of the quantified voxels were calculated for each volunteer. Additionally, the hepatocellular content of lipids (HCL) was assessed by ultra-short echo 1H MRS (TE=6ms, TR=4s, NA=16) on a single voxel (3x3x3cm³) placed well within hepatic parenchyma7 (Fig.3B). HCL was used to correct the 31P concentrations for the volume captured by lipid droplets according to Szendroedi et al.5. Total measurement time was about 40min. The grouped data were statistically analyzed using SPSS (v24, IBM, New York, USA) with significance level of 0.05.Results
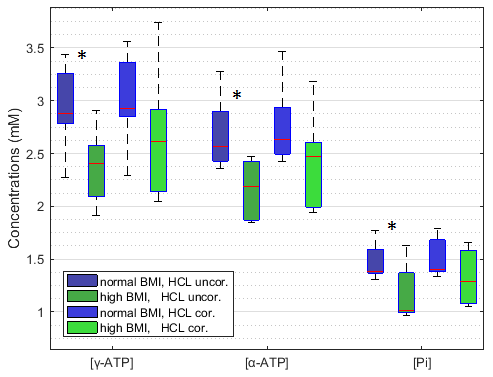
In total 16 to 79 voxels (on average 48±19 voxels covering a nominal volume of 94.4±36.5cm³) were quantified per volunteer. Independent two-sample t-tests of the HCL uncorrected metabolite concentrations showed significant differences in γ- (p=0.018) and α-ATP (p=0.008) as well as in Pi concentrations (p=0.026) between the two BMI groups. HCL reached in total from 1.11 to 12.36% with an average of 2.85±2.14% for the normal BMI (<25kg.m-2) and 10.12±7.49% for high BMI (>25kg.m-2) respectively. Using HCL and the hepatic lipid volume corrections, no significant differences in the metabolites between the BMI groups were found (Fig.4).Discussion/Conclusion
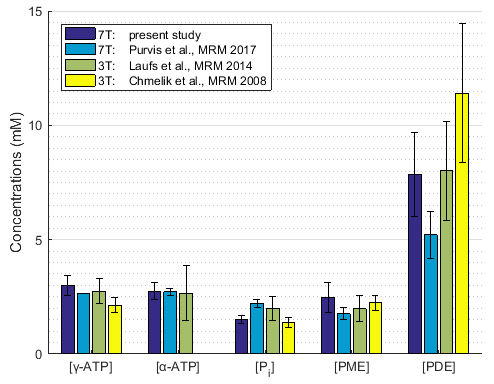
Overall concentration of 31P containing hepatic metabolites measured here are within the range of previously reported hepatic metabolite concentrations2,4,8 (Fig.5). According to the analysis between population groups BMI could have an influence on measured absolute 31P concentrations. Correcting these values for volume captured by lipid droplets as measured by HCL can compensate for this differences. A special care must be taken when comparing hepatic pathologies with tendency to higher HCL with healthy population by either adapting the control group or correcting for HCL as previously described5.Acknowledgements
The study was supported by the Anniversary Fund of the Austrian National Bank #15363.References
- Valkovič L, Chmelík M, Krššák M. In-vivo 31P-MRS of skeletal muscle and liver: A way for non-invasive assessment of their metabolism. Anal. Biochem. 2017;529:193–215.
- Chmelík M, Schmid AI, Gruber S, et al. Three-dimensional high-resolution magnetic resonance spectroscopic imaging for absolute quantification of 31 P metabolites in human liver. Magn. Reson. Med. 2008;60(4):796–802.
- Chmelik M, Považan M, Krššák M, et al. In vivo 31 P magnetic resonance spectroscopy of the human liver at 7 T: an initial experience. NMR Biomed. 2014;27(4):478–485.
- Purvis LAB, Clarke WT, Valkovič L, et al. Phosphodiester content measured in human liver by in vivo 31 P MR spectroscopy at 7 tesla. Magn. Reson. Med. 2017;0:00–00.
- Szendroedi J, Chmelik M, Schmid AI, et al. Abnormal hepatic energy homeostasis in type 2 diabetes. Hepatology. 2009;50(4):1079–1086.
- Vanhamme, van den Boogaart A, Van Huffel S. Improved method for accurate and efficient quantification of MRS data with use of prior knowledge. J. Magn. Reson. 1997;129(1):35–43.
- Gajdošík M, Chadzynski G, Hangel G, et al. Ultrashort-TE stimulated echo acquisition mode (STEAM) improves the quantification of lipids and fatty acid chain unsaturation in the human liver at 7T. NMR Biomed. 2015;28(10):1283-1293.
- Laufs A, Livingstone R, Nowotny B, et al. Quantitative liver 31 P magnetic resonance spectroscopy at 3T on a clinical scanner. Magn. Reson. Med. 2014;71(5):1670–1675.
Figures