3987
Mapping Brain Tissue Sodium Parameters Using Fast 3D Multi-Echo Radial Imaging1Radiology, Univ. of Iowa, Iowa City, IA, United States, 2New York University, New York City, NY, United States, 3lectrical-Computer Engin, Univ. of Iowa, Iowa City, IA, United States, 4GE Healthcare, Madison, WI, United States
Synopsis
We have developed 3D Multi-Echo Radial Imaging and Tikhonov reconstruction techniques for mapping brain tissue sodium concentration and R2* relaxation rate. The total acquisition time is about 6 minutes. Intra- and inter-cellular sodium concentrations and R2* relaxation rates were simultaneous estimated. Our long term aim is to develop 23Na imaging techniques for studies of brain function and diseases.
Introduction
Sodium (23Na) plays a crucial role in cellular physiology. The distribution of intra-cellular and inter-cellular sodium concentrations depend on the cellular metabolism and cell membrane integrity. The changes in sodium concentration in tissues can be indications of developing or existing disease conditions. In-vivo sodium imaging is potentially a powerful tool for clinical applications.Methods
Data collection- Images were collected using a 1H/23Na dual tuned head coil (Rapid Biomedical) on a 7T human scanner (GE MR950) from two subjects after written informed consent was obtained in accordance with the local IRB. Data was acquired using a 3D radial multi-echo free induction decay (fid) sequence similar to the one used by Blunck et al (2). Imaging parameters were TR=50ms, TE1=455µs, Flip Angle = 15o, FOV=20cm isotropic, and acquisition matrix is 7333 spokes with 33 points per spoke. Eight echoes with a 2.716ms echo spacing were collected after each excitation pulse. The total acquisition time for the 3D radial acquisition was 6.07 minutes. The k-space data was re-grinded to a 48 x 48 x 48 isotropic matrix and image reconstruction performed using the Tikhonov method (3,4). Image processing- A two-component model, I(t)=Cf*exp(-R2f*t)+Cs*exp(-R2s*t) ,was fit to the signal decay for each voxel to estimate the fast decay (Cf & R2f*) and slow decay (Cs & R2s*) sodium concentrations and relaxation rates. Least squares fitting was used to estimate the relaxation times and compartment concentrations. Specifically, we used a two-step bi-exponential fitting: 1) The last six echoes were used to estimate R2s* and Cs for each voxel; 2) The R2s* and Cs values were then used to seed a global fit for Cf, R2f*, Cs, and R2s* using all echoes and additional constraints limiting the allowed range of values for Cf, Cs, R2f*, and R2s*. Concentrations were normalized to a 51mM NaCl signal from an external reference standard. Voxel-specific concentrations and rates were then assigned to each voxel and regional of interest measures were obtained for the following tissue types: white matter (WM), gray matter (GM), cerebral spinal fluid (CSF), and fat tissue types.Results
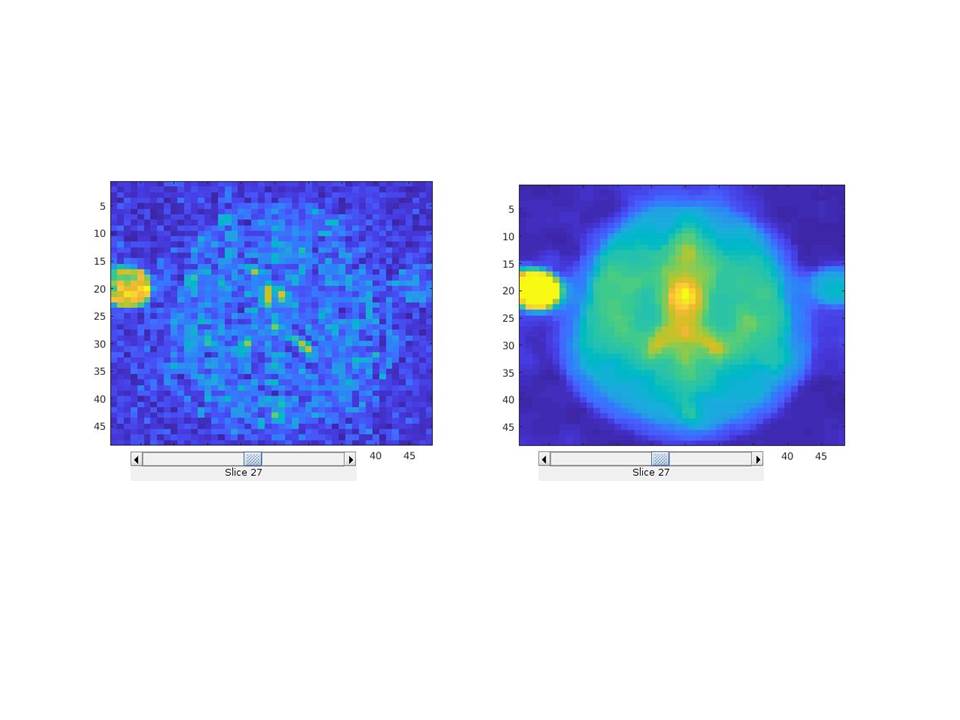
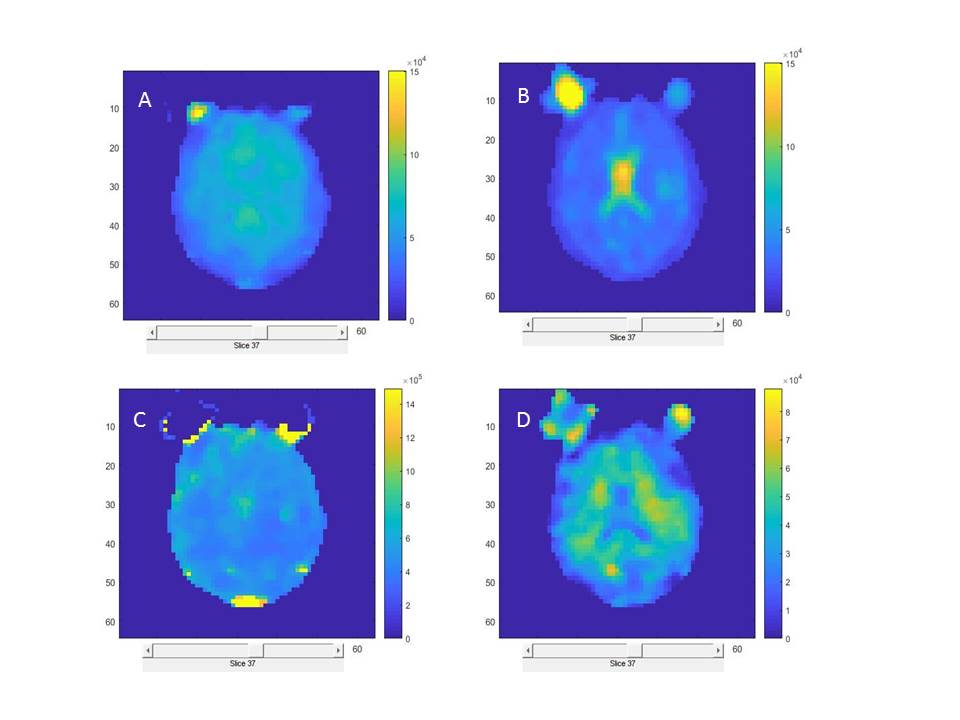
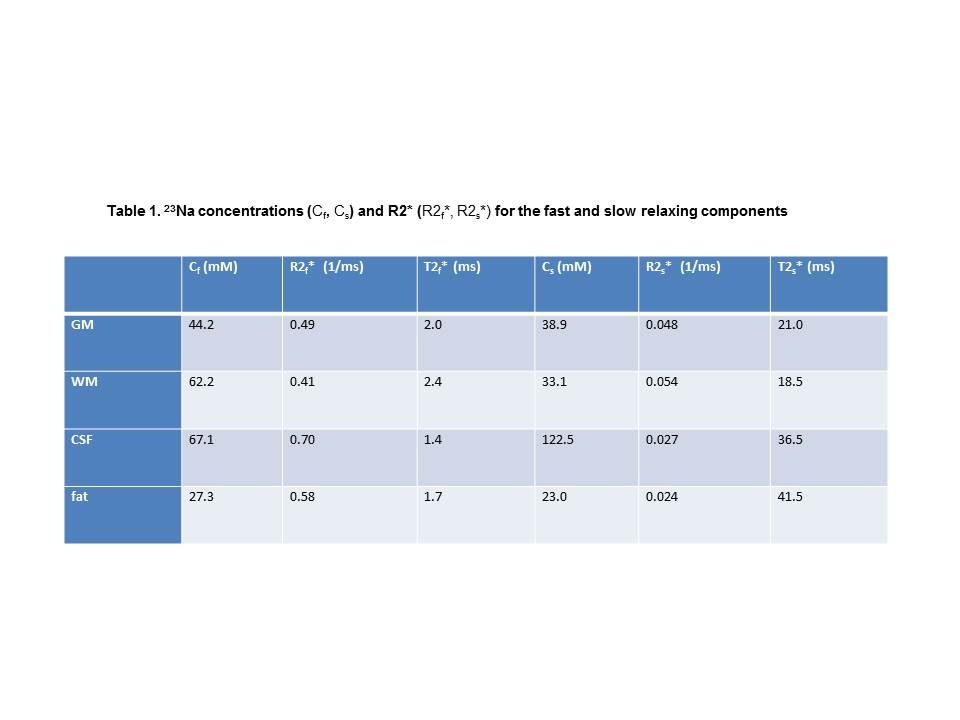
Figure 1 shows 23Na images constructed using standard regridding followed by Fourier transform and Tikhonov based regularization. Tikhonov reconstruction generates an image with higher signal-to-noise ratio (2.7 times increase) while increasing the spatial smoothness of the reconstructed images. Figure 2 shows the sodium concentration and R2* relaxation rate maps estimated from the images reconstructed using Tikhonov method for both the fast and slow relaxation components of the signal. As expected, the CSF regions show the highest Cs and lowest R2s* since there is no intracellular component for the signal within this region. The intra-cellular and inter-cellular sodium concentrations and R2* relaxation rates are reported in Table 1 for grey, white, CSF, and fat.Discussion and Conclusions
The present work provides a general reconstruction and bi-exponential fitting method for the simultaneous estimation of intra- and inter-cellular sodium concentrations and R2* relaxation rates. Based on multi-echo 3D radial acquisitions, the total acquisition time of our method is reasonably short (about 6 minutes). The images generated using Tikhonov reconstruction show higher SNR. The estimated sodium concentrations and R2* relaxation rates are reasonable for grey matter, white matter, CSF, and fat.Acknowledgements
No acknowledgement found.References
1. Hilal SK, Maudsley AA, Ra JB, Simon HE, Roschmann P, Wittekoek S, Cho ZH, Mun SK. In vivo NMR imaging of sodium-23 in the human head. J Comput Assist Tomogr. 1985;9(1):1-7. Epub 1985/01/01. PubMed PMID: 3968256.
2. Blunck Y, Josan S, Taqdees SW, Moffat BA, Ordidge RJ, Cleary JO, Johnston LA. 3D-multi-echo radial imaging of 23 Na (3D-MERINA) for time-efficient multi-parameter tissue compartment mapping. Magn Reson Med. 2017. Epub 2017/07/29. doi: 10.1002/mrm.26848. PubMed PMID: 28752556.
3. Tikhonov AN, Arsenin VI. Solutions of ill-posed problems. Washington/New York; Winston, distributed by Halsted Press. 1977.
4. Ying L, Xu D, Liang ZP. On tikhonov regularization for image reconstruction in parallel mriConf Proc IEEE Eng Med Biol Soc. 2004;2:1056-9
Figures