3986
Comparison of quantitative imaging methods of sodium concentration in leg muscle1Beckman Institute, University of Illinois at Urbana-Champaign, Urbana, IL, United States, 2Division of Nutritional Sciences, University of Illinois at Urbana-Champaign, Urbana, IL, United States, 3The Department of Kinesiology and Community Health, University of Illinois at Urbana-Champaign, Urbana, IL, United States, 4Center for MR Research, University of Illinois at Chicago, Chicago, IL, United States, 5Department of Bioengineering, University of Illinois at Urbana-Champaign, Urbana, IL, United States
Synopsis
Quantitative imaging of tissue sodium content requires corrections for coil loading. This can be done by introducing external calibration standards within the scan, or by employing the principle of reciprocity to normalize the signal by the voltage required to obtain a signal maximum. A direct comparison of these two quantification methods shows that they are highly consistent.
Introduction
Quantitative imaging of tissue sodium content requires corrections for several factors that affect signal intensity, including coil loading. This can be done by introducing calibration standards within the scan [1]. Alternatively it is possible to employ the principle of reciprocity and to normalize the signal by the voltage required to obtain a signal maximum [2]. Here we perform a direct comparison of these two quantification methods in human leg muscle.Methods
Quantification using the principle of reciprocity involves the measurement of the voltage, $$$V_{max}$$$, required to obtain a 90° flip angle. When the signal, $$$S$$$, is multiplied $$$V_{max}$$$, the resulting normalized signal, $$$c_{rec}$$$ is proportional to the concentration [3, 4]. We first demonstrate this method on phantoms of known concentration. We then compare it to quantification performed with external standards.
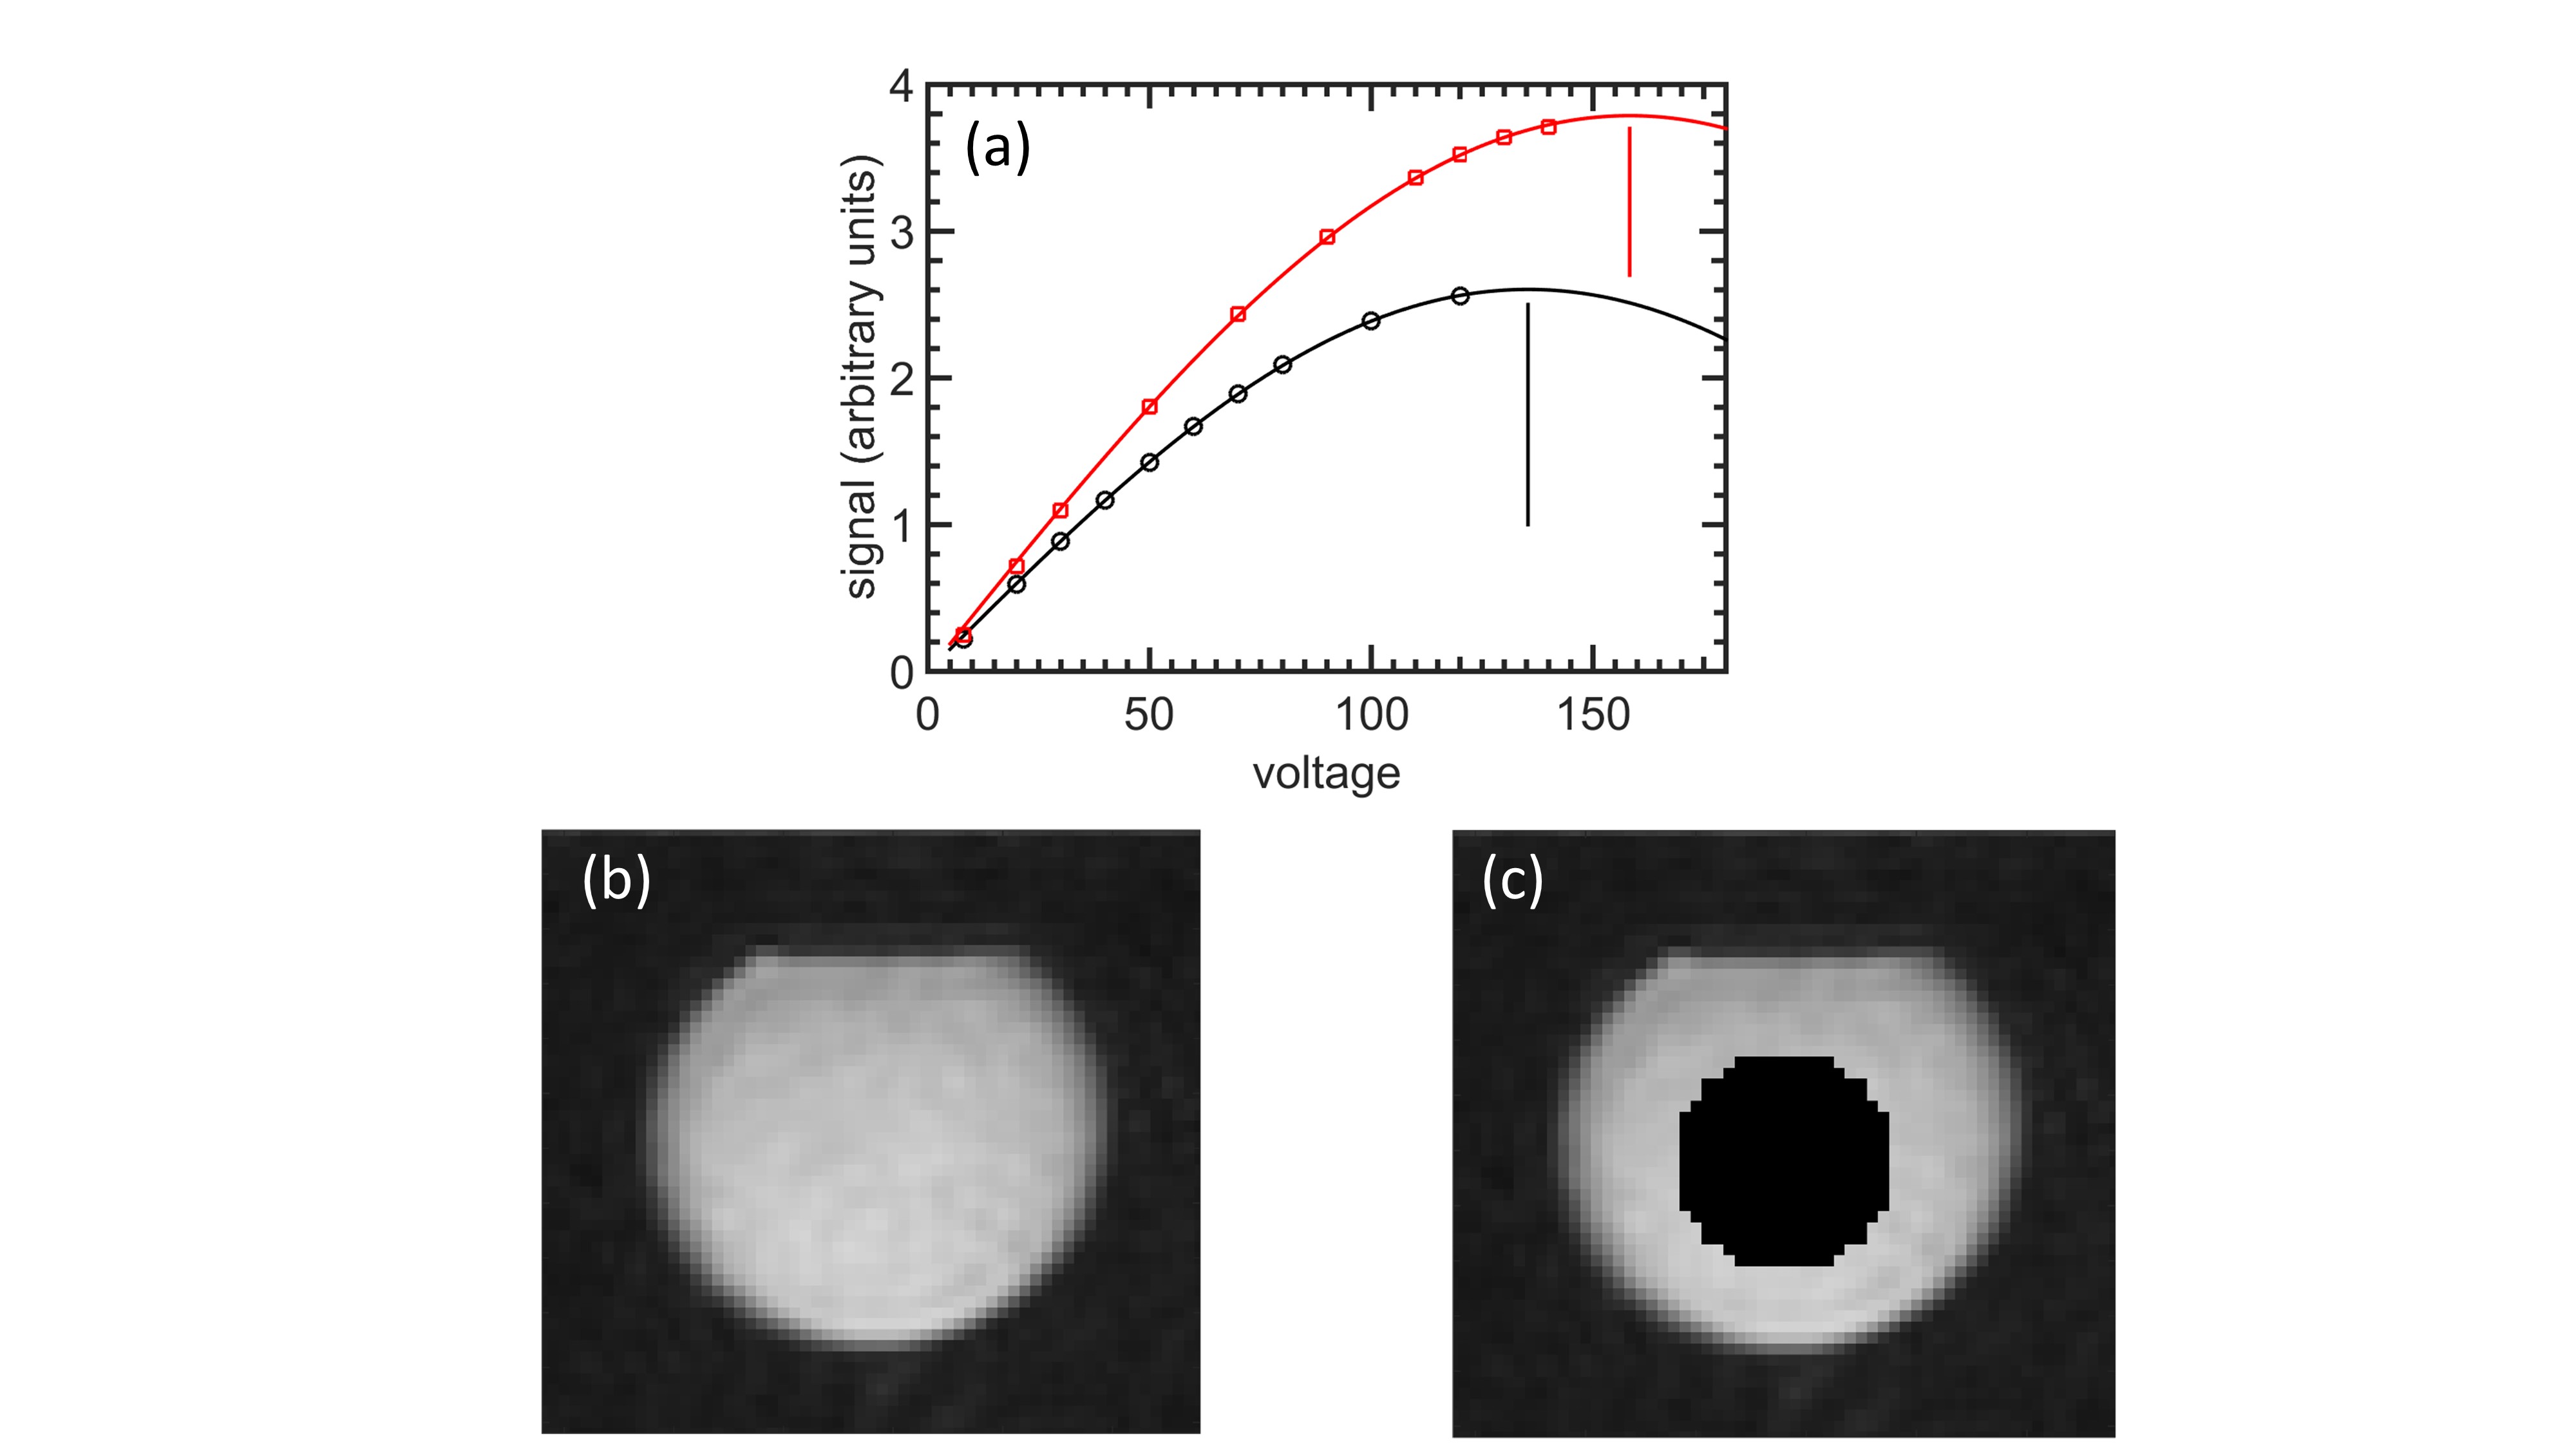
Our validation experiments were performed on Siemens TIM Trio 3 T system with a custom, birdcage sodium coil with RF interface. Our phantom experiments were performed on 2 L aqueous phantoms of concentration 120 mM and 200 mM NaCl. To measure coil loading, we played a series of hard pulses at various voltages. The signal as function of voltage was fit to a sine curve to estimate the voltage required for a 90° flip angle (see Fig. 1(a)). Imaging was performed using flexible twisted projection imaging (flexTPI) sequence [2], consisting of a hard pulse followed by twisted gradient waveforms (TE = 0.4 ms, TR = 200 ms, 43° flip angle, 22 x 22 x 22 cm FOV with an effective matrix size of 44 x 44 x 44, radial fraction of 0.25, maximum gradient of 4 mT/m, maximum slew rate of 150 mT/m/ms, 1 average). The images were reconstructed on a 76 x 76 x 76 matrix using gridding. A composite image was made by summing over all slices (Fig 1(b)), and the signal, $$$S_{pht}$$$, was taken to be the average of all points within a circular mask (Fig. 1(c)).
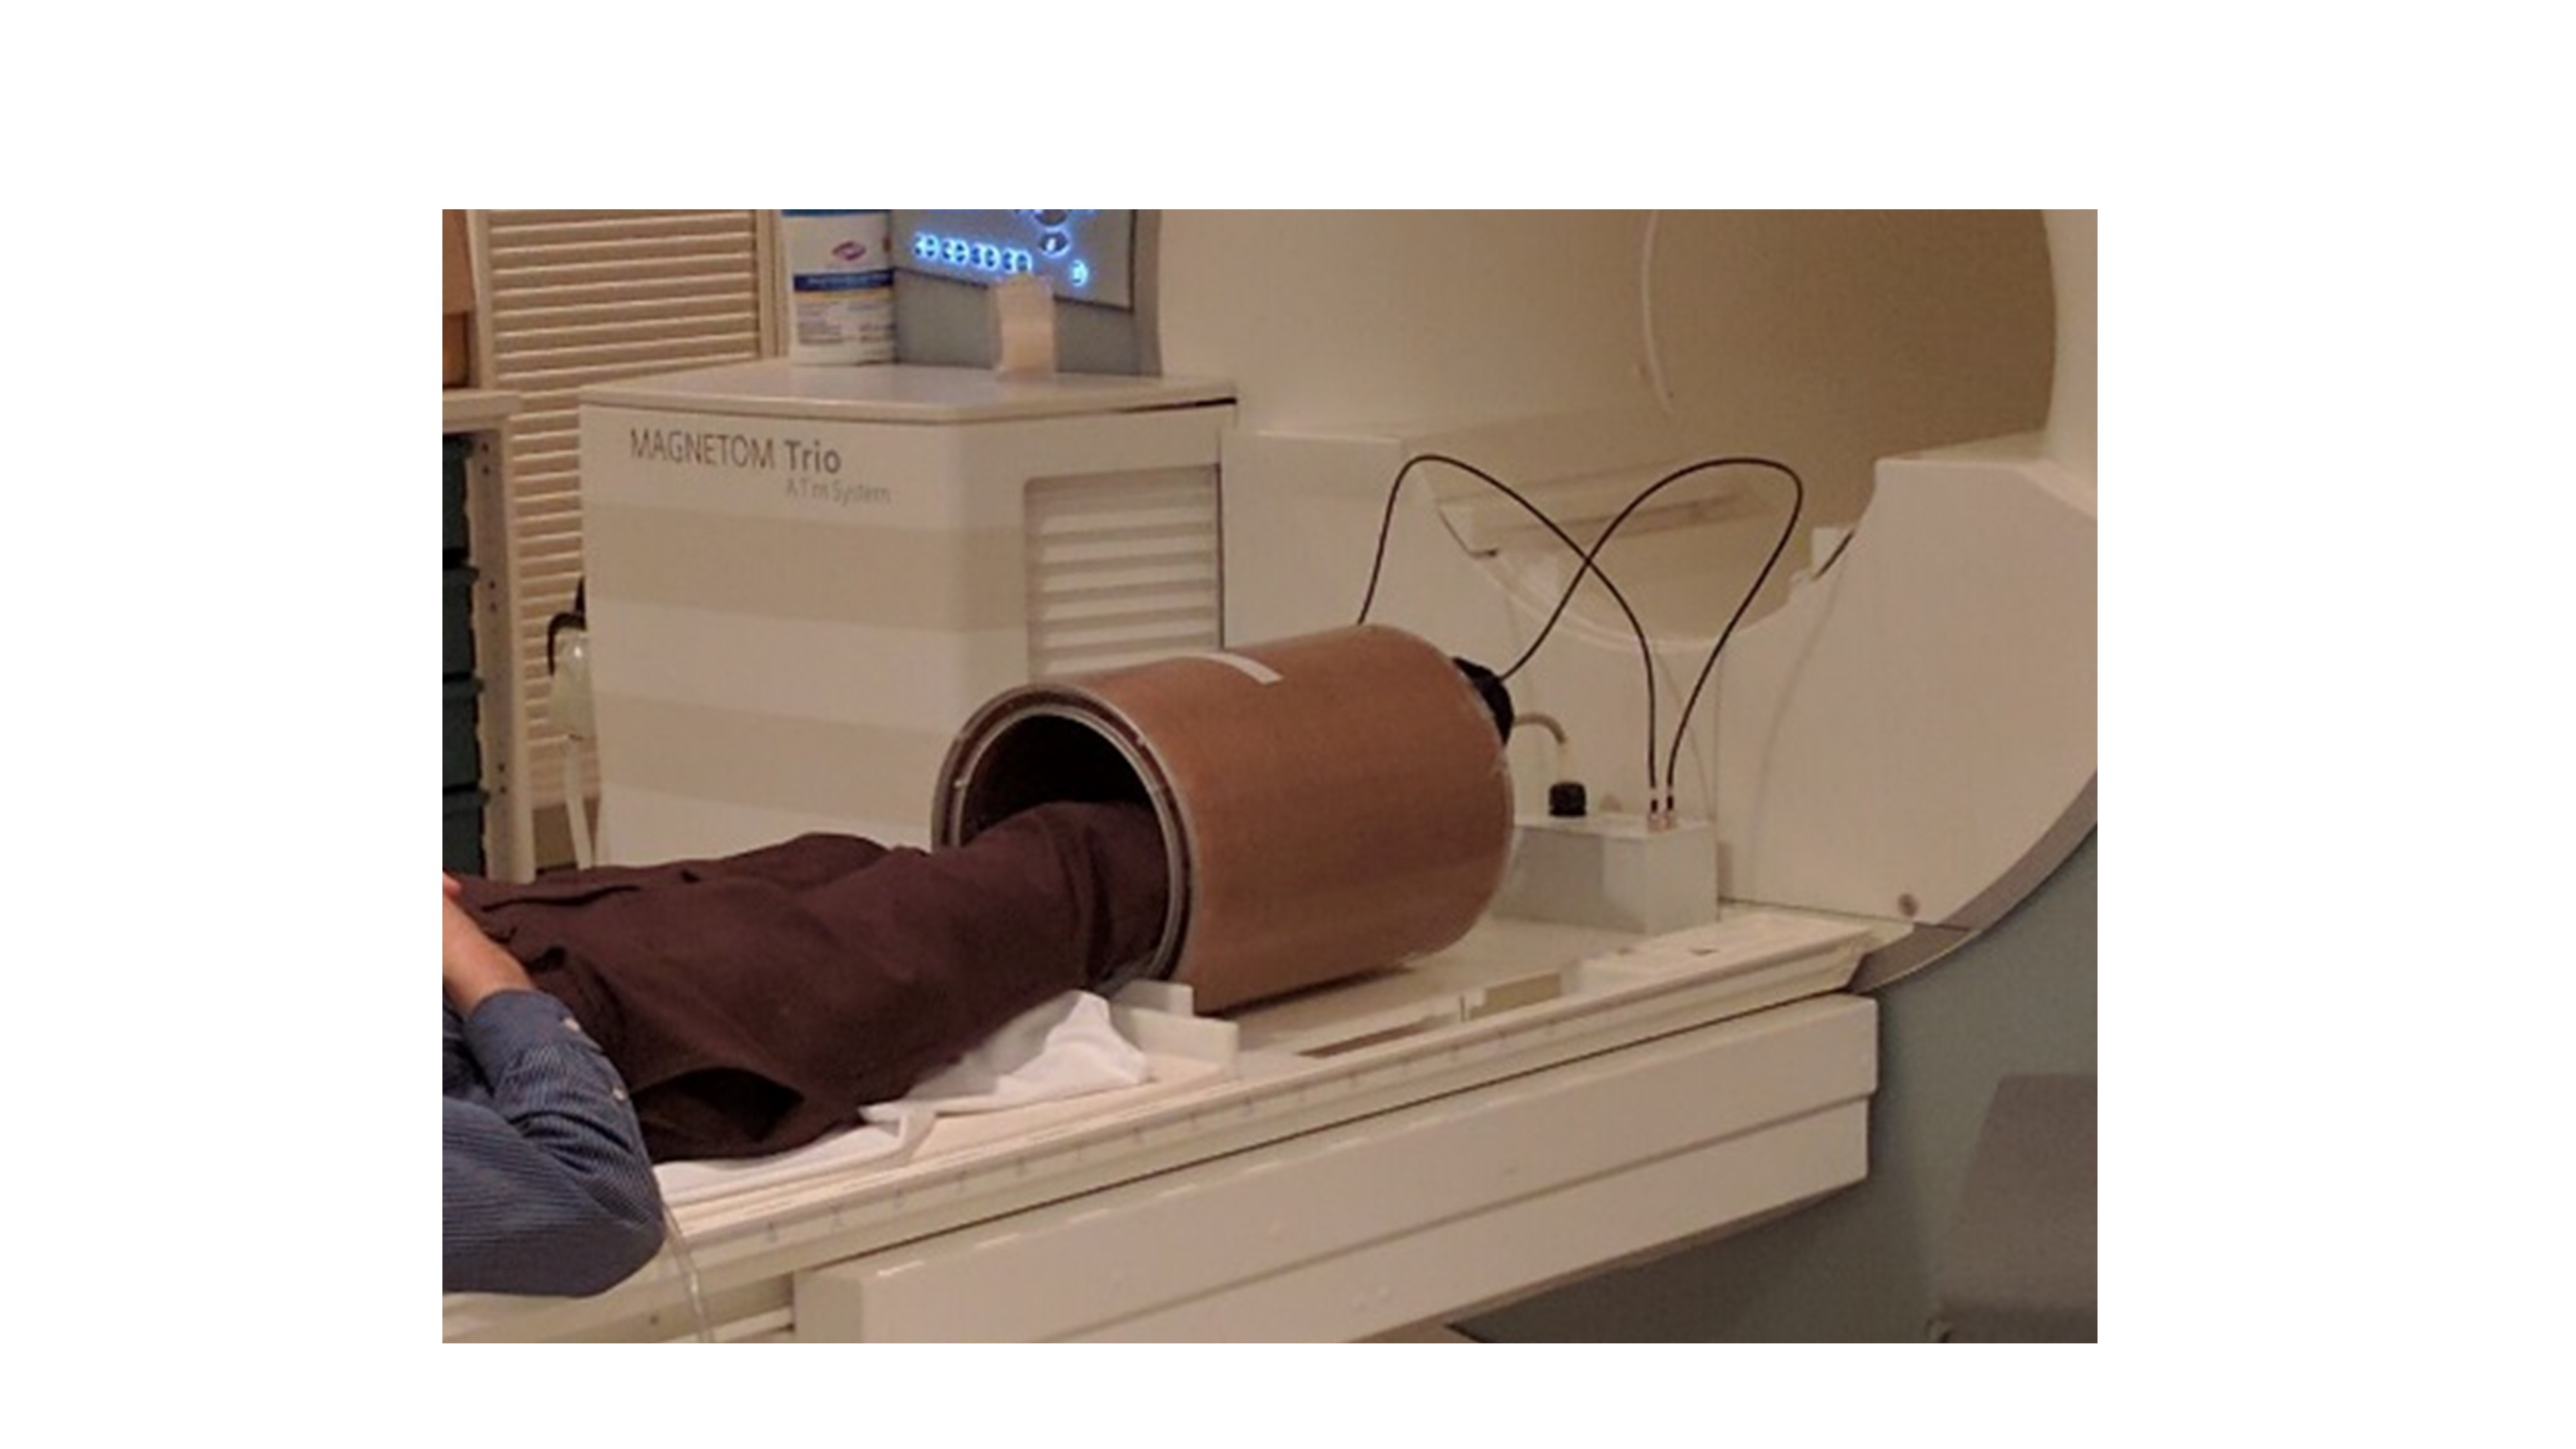
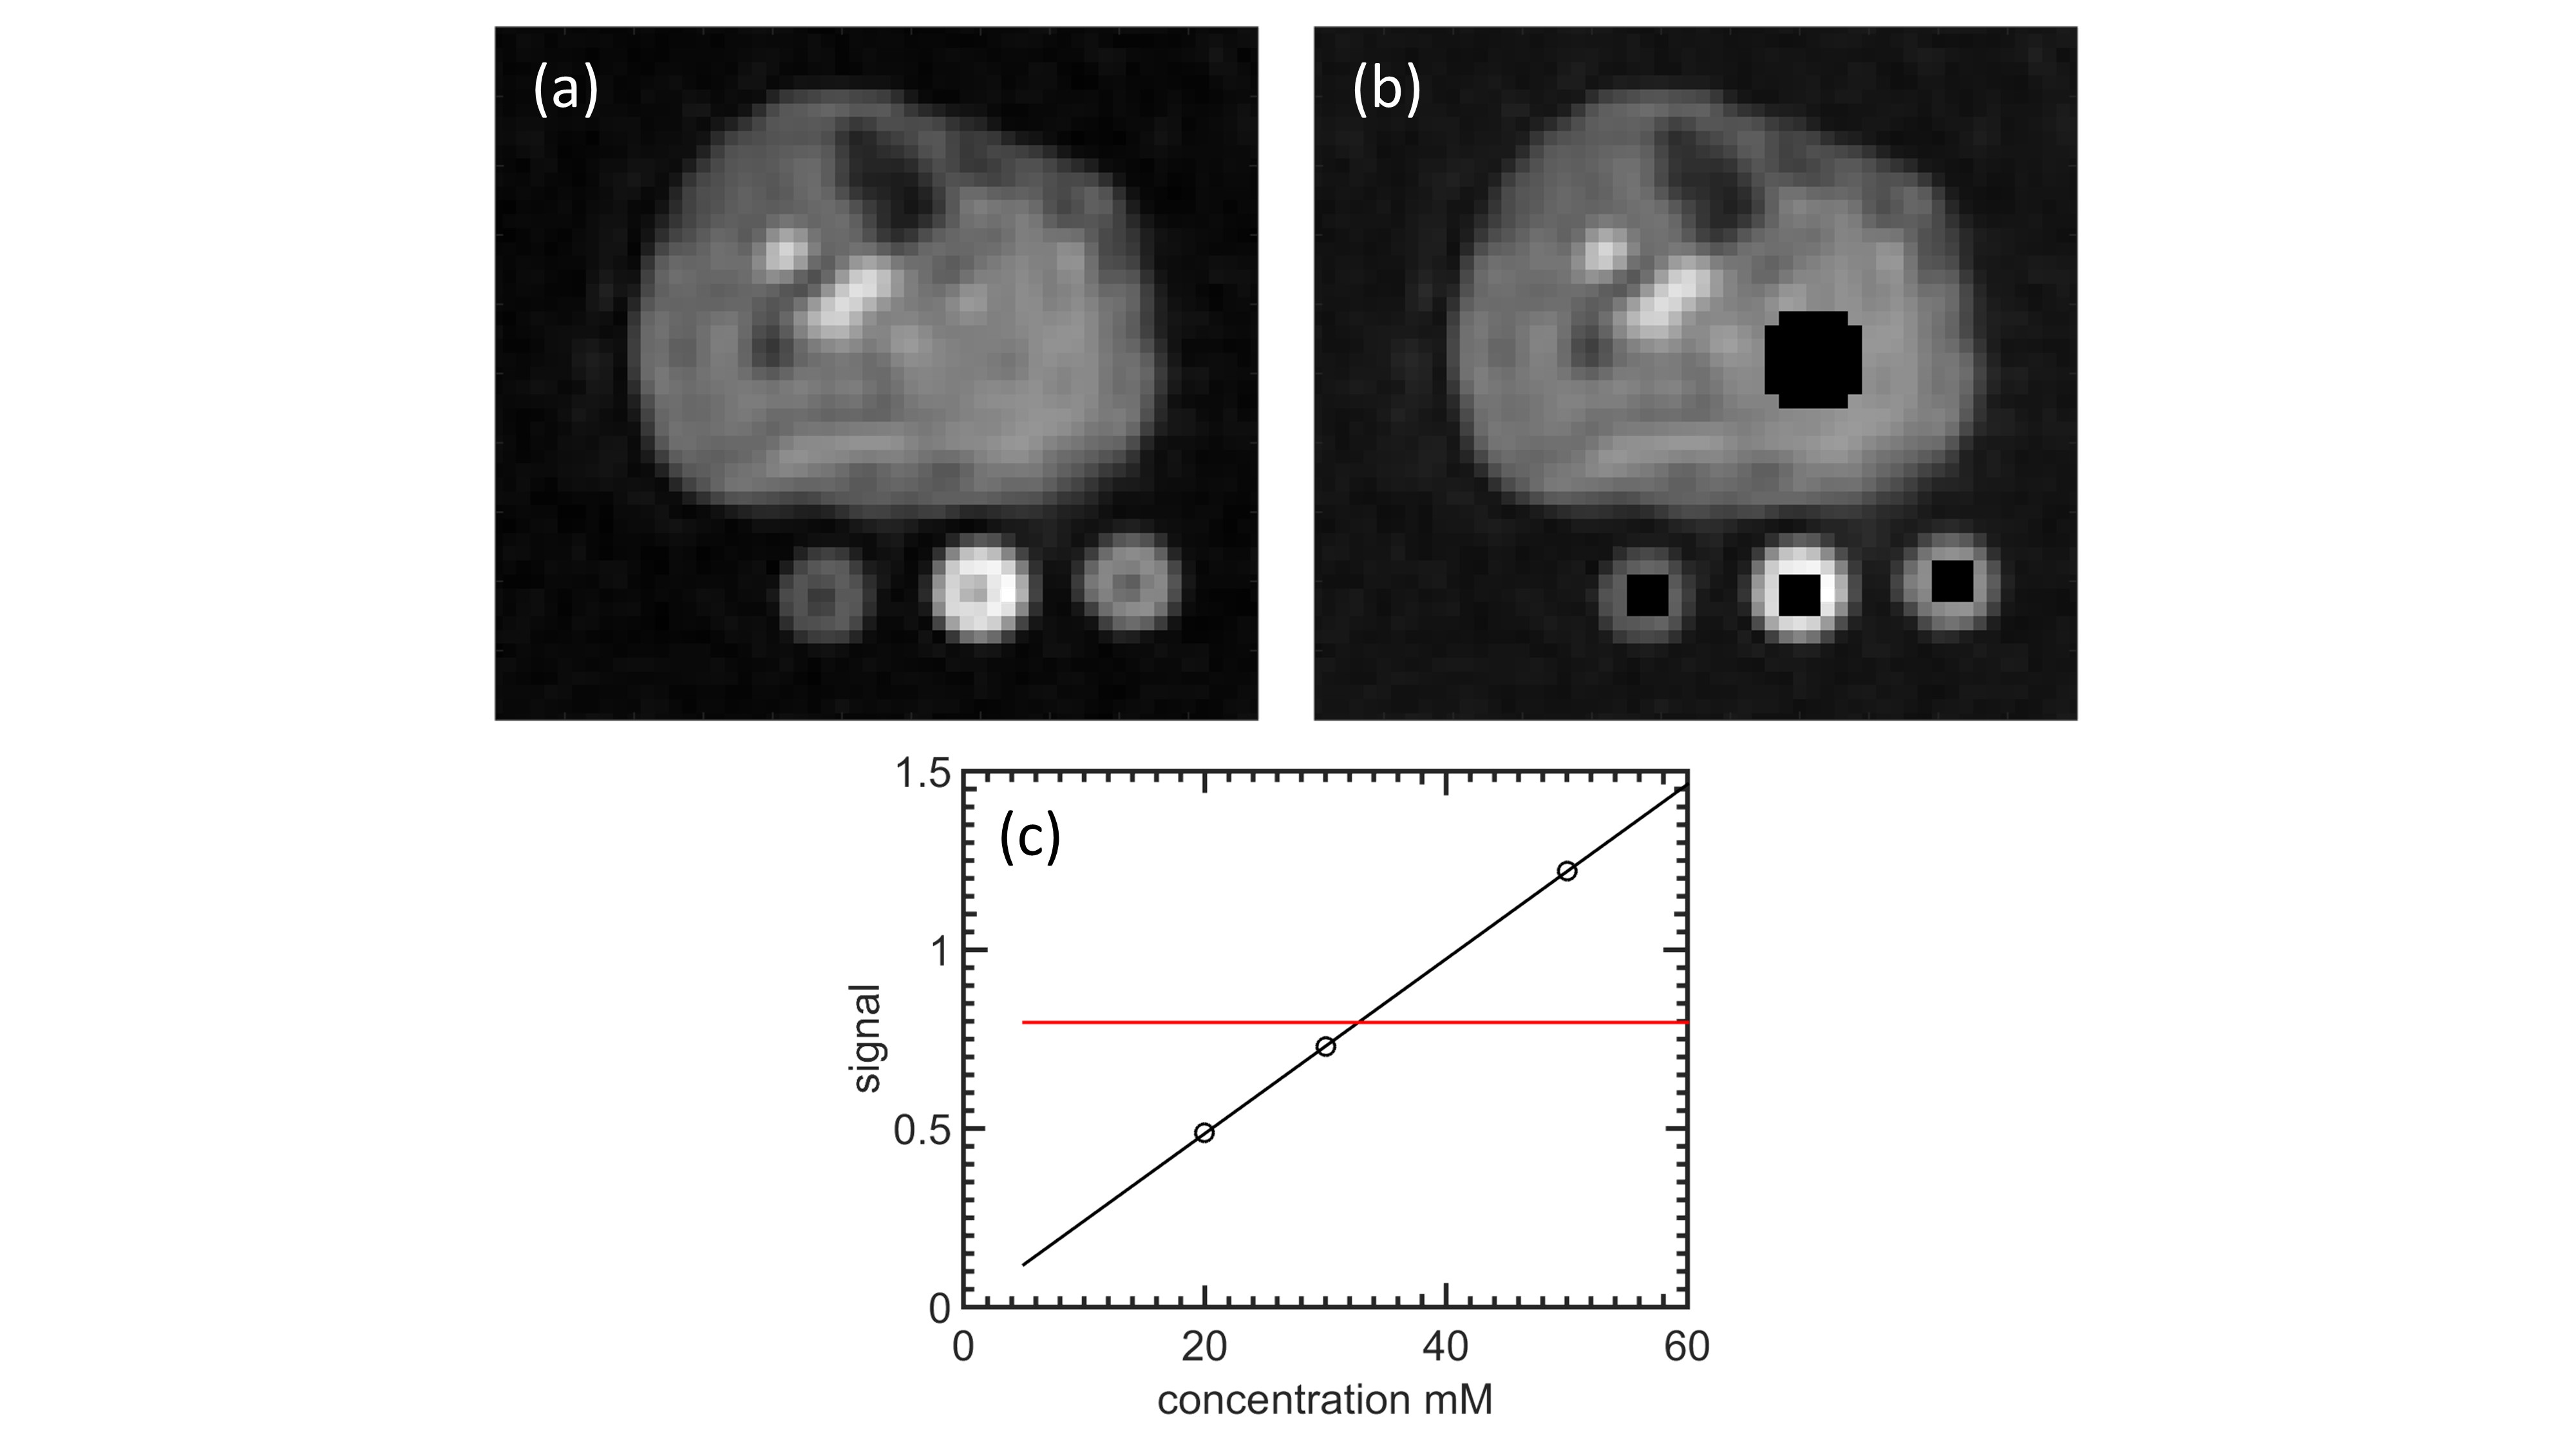
Scans of 16 human volunteers were obtained with IRB approval. The right leg was inserted into the coil as shown in Fig. 2. The leg was supported by a rigid platform containing 3 standards of 20, 30 and 50 mM aqueous NaCl in 1 inch PVC pipes that extended the length of the coil. We measured $$$V_{max}$$$ using the same procedure used for the phantoms. The flexTPI sequence was performed using the same sequence used for phantom imaging, except with a FOV of 28 cm, a flip angle of 70°, and 3 averages for a total scan time of 15 min 45 s. From the reconstruction, we retained only the center 72 slices, and summed them into 8 composite slices of 9 slices each. The signal from leg muscle, $$$S_{leg}$$$, and from each standard was calculated by averaging all points within a circular mask (Fig. 3(a-b)). The concentration, $$$c_{stand}$$$, within each composite slice was interpolated from a linear fit to the signals of the standards as a function of concentration (Fig. 3(c)). Average values $$$\bar{c}_{stand}$$$ and $$$\bar{S}_{leg}$$$ were obtained by averaging the two center composite slices. Concentration values $$$\bar{c}_{rec} = \bar{S}_{leg}V_{max}$$$ were calculated using the reciprocity principle. Values of $$$\bar{c}_{rec}$$$ from all participants were multiplied by a single factor so that the group-level average would match that of $$$\bar{c}_{stand}$$$.
Results
In the phantom experiments, $$$S_{pht}$$$ of the 200 mM phantom is greater than that of the 120 mM phantom by a factor of 1.40. Similarly the ratio of $$$V_{max}$$$ is 1.17. Application of the reciprocity principle therefore predicts that the concentration ratio is 1.63, which is within 2% of the true value, 200/120 = 1.67.
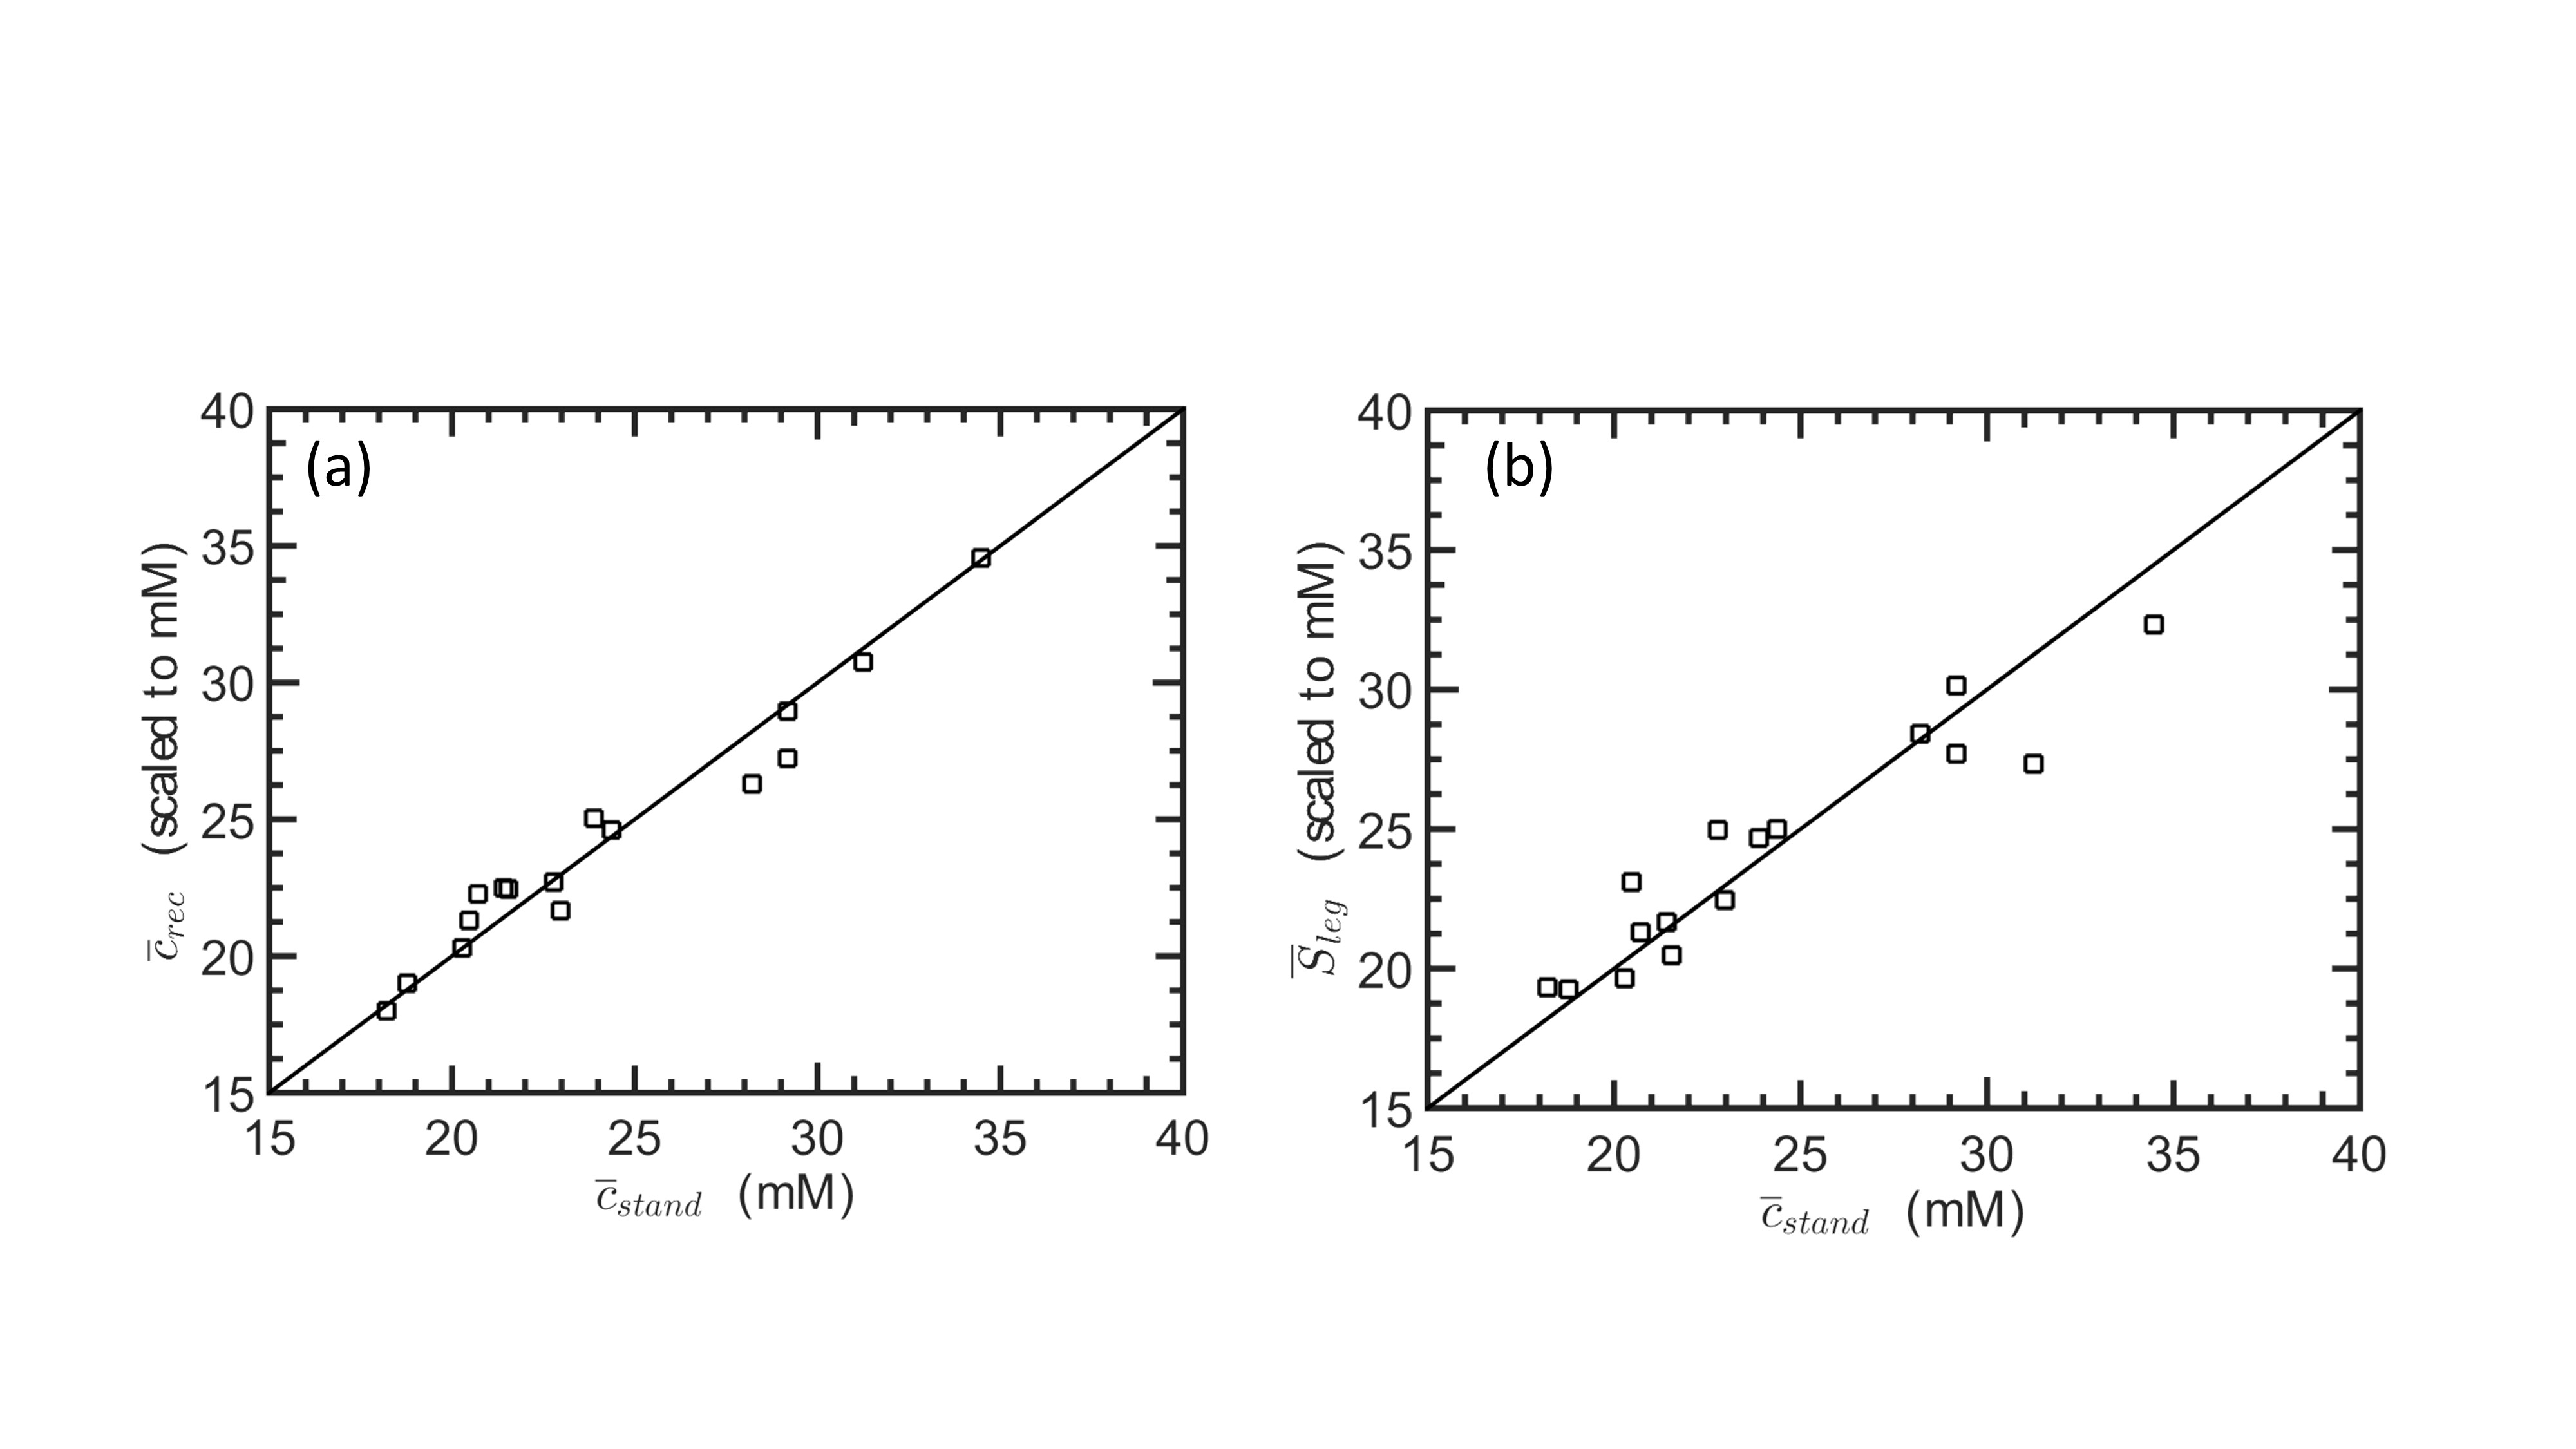
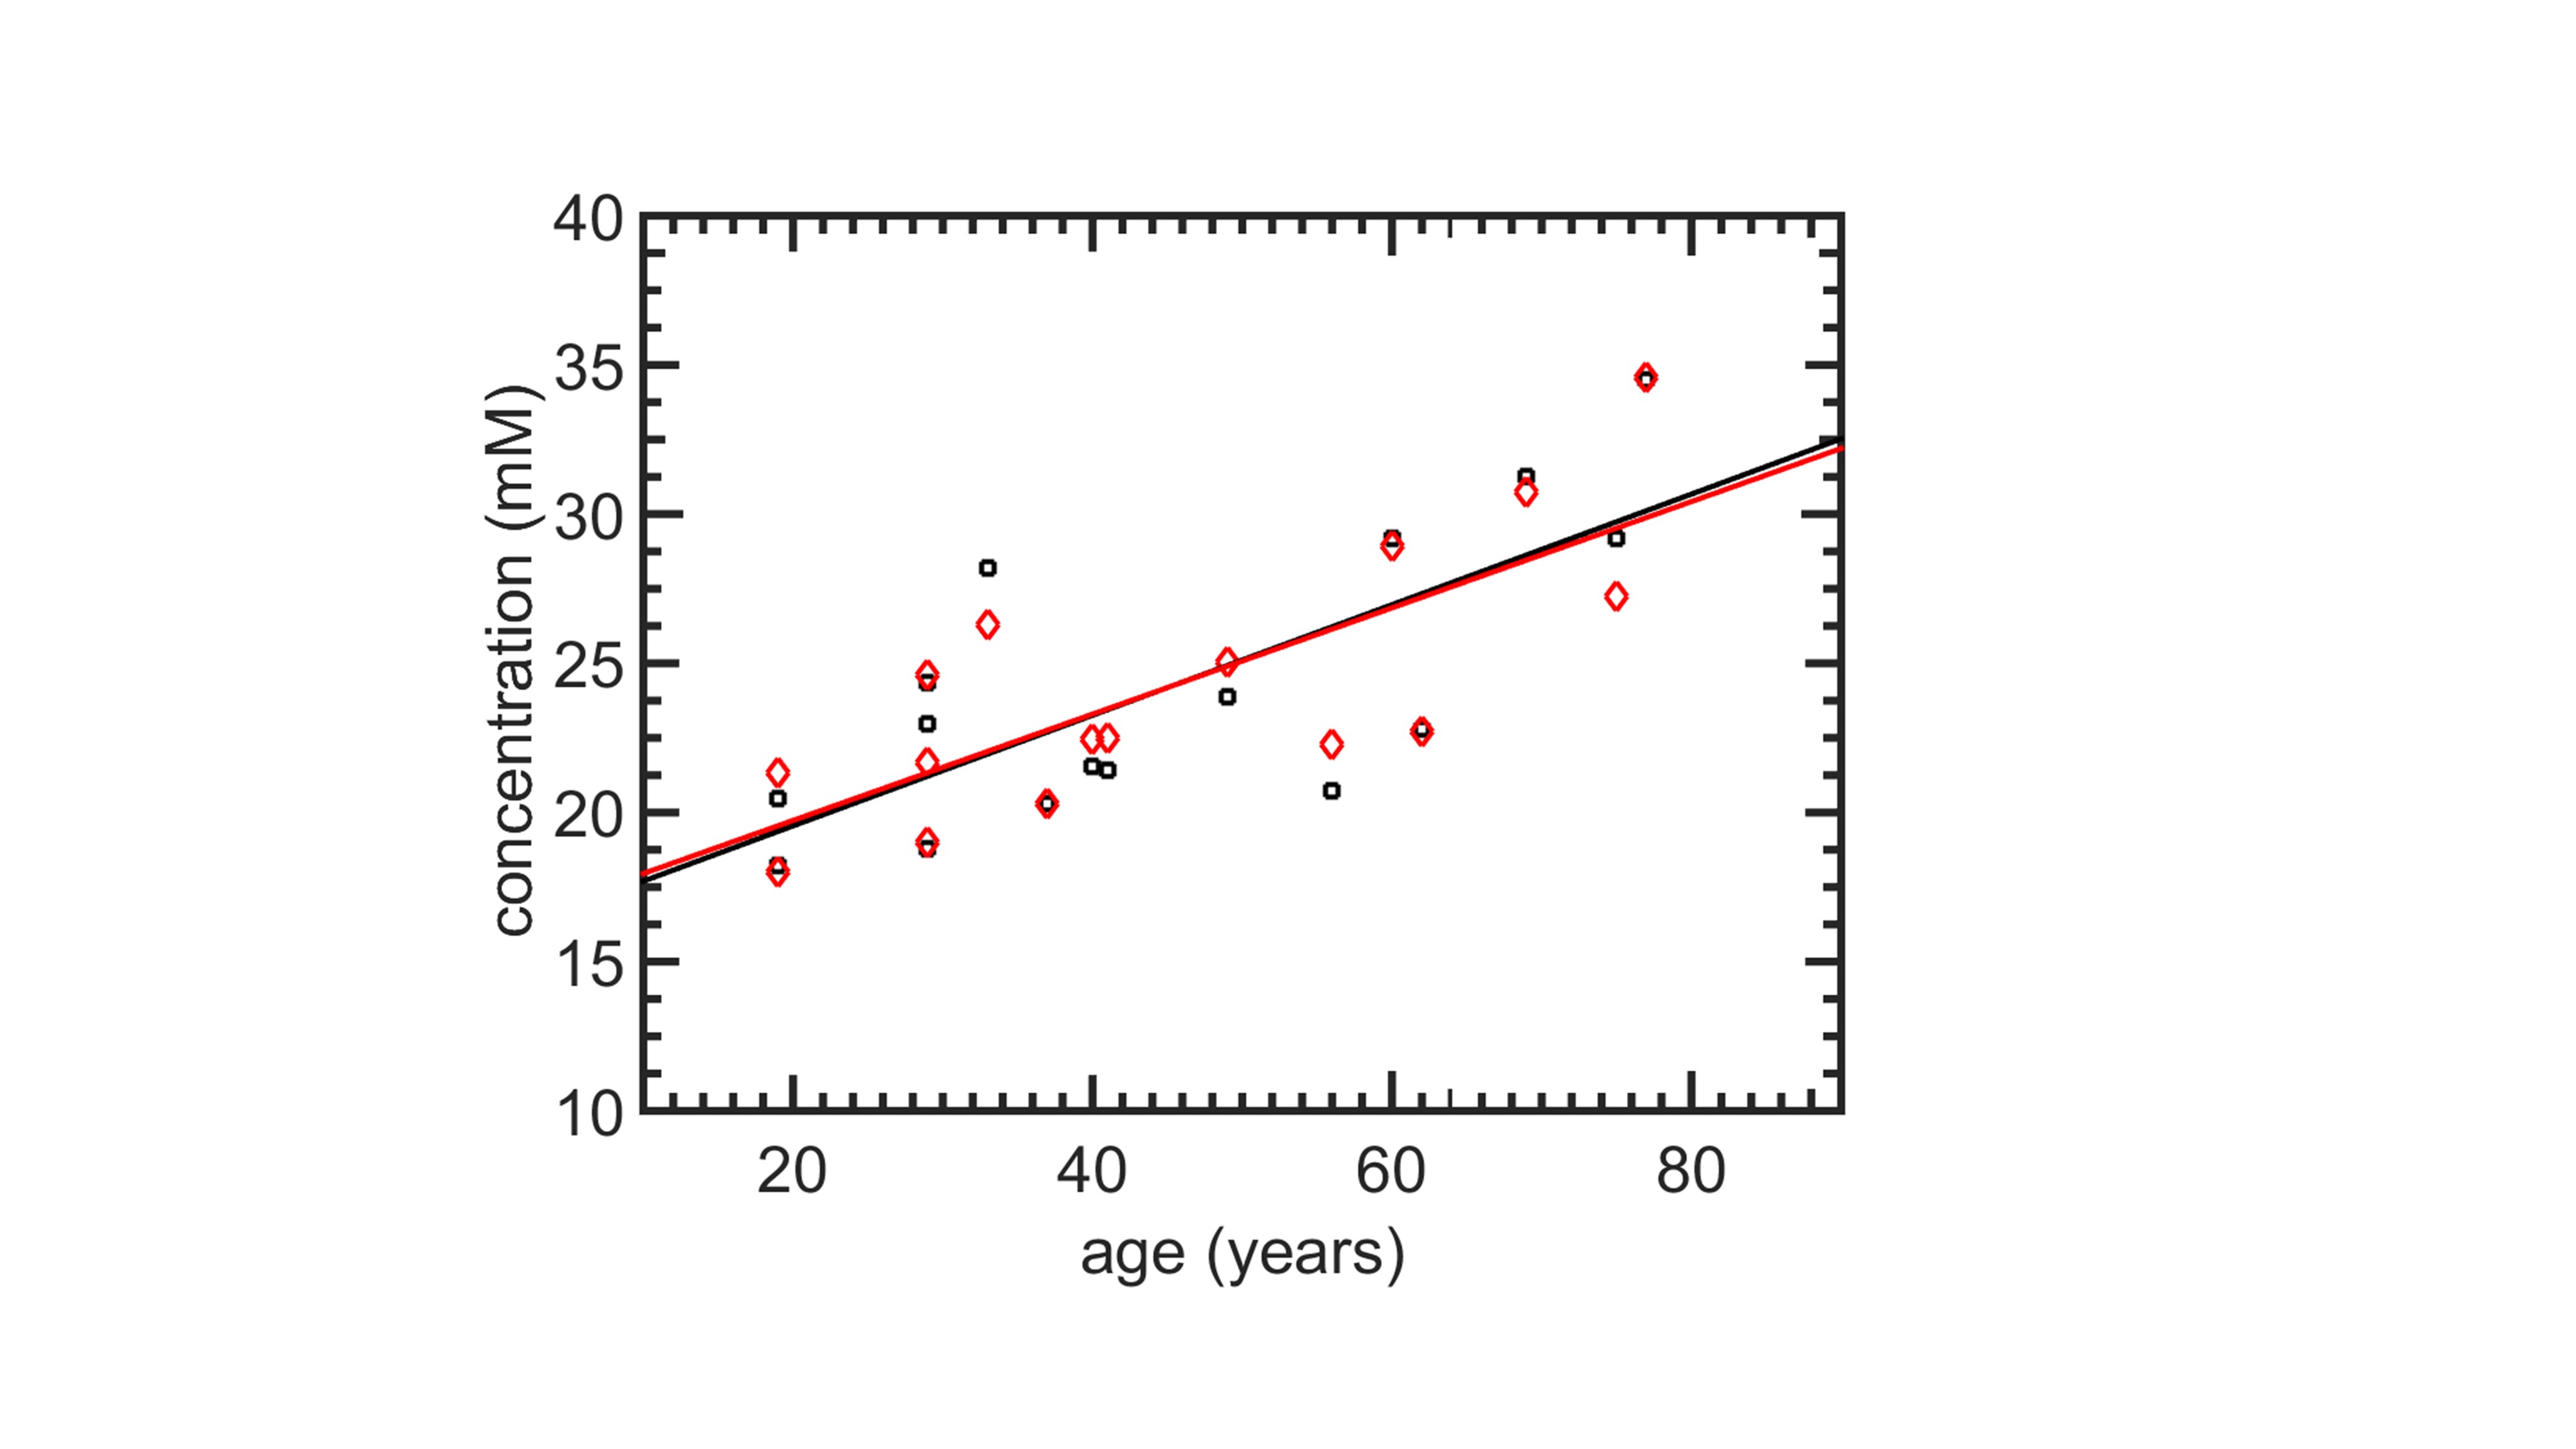
In human experiments, the interclass correlation coefficient (ICC) between $$$\bar{c}_{stand}$$$ and $$$\bar{c}_{rec}$$$ was 0.987 (Fig. 4(a)). By contrast, the ICC between $$$\bar{c}_{stand}$$$ and $$$\bar{S}_{leg}$$$ was only slightly lower, 0.965 (Fig. 4(b)). Both $$$\bar{c}_{stand}$$$ and $$$\bar{c}_{rec}$$$ show the expected increase with age (Fig. 5).
Discussion
Here we have demonstrated the use of the reciprocity principle in quantification of sodium MRI in both phantoms and human leg. In principle, this correction is important because changes to salt concentration also modify the coil loading. In the human experiments concentration measurements using the reciprocity principle were shown to be consistent with those obtained with calibration standards.Conclusion
Quantification of sodium MRI using a global measure of coil loading produces results that are consistent with those obtained using calibration standards. The disadvantage of quantification using the reciprocity principle is the lack of absolute units, which are useful for comparisons of data obtained at different sites. When this is not critical, our result implies that by using of the reciprocity principle it may be possible to simplify experiments by not including calibration standards.Acknowledgements
This work was funded by the Beckman Institute at the University of Illinois Urbana-ChampaignReferences
1. Kopp, C., et al., Na-23 Magnetic Resonance Imaging of Tissue Sodium. Hypertension, 2012. 59(1): p. 167-172.
2. Lu, A., et al., Quantitative sodium imaging with a flexible twisted projection pulse sequence. Magn Reson Med, 2010. 63(6): p. 1583-93.
3. Jost, G., I. Harting, and S. Heiland, Quantitative single-voxel spectroscopy: The reciprocity principle for receive-only head coils. Journal of Magnetic Resonance Imaging, 2005. 21(1): p. 66-71.
4. Helms, G., The principles of quantification applied to in vivo proton MR spectroscopy. Eur J Radiol, 2008. 67(2): p. 218-29.
Figures