3983
Relative quantification of the 23Na MRI signal of human intervertebral lumbar discs1HFMR, Department of Biomedical Imaging and Image-guided Therapy, Medical University of Vienna, Vienna, Austria, 2Research Unit of Medical Imaging, Physics and Technology, University of Oulu, Oulu, Finland, 3Clinical Division for Endocrinology and Metabolism, Department of Medicine III, Medical University of Vienna, Vienna, Austria, 4CD Laboratory for Clinical Molecular MR Imaging, Vienna, Austria
Synopsis
23Na MRI was applied in five healthy volunteers to determine the feasibility of intervertebral discs sodium signal quantification using the cerebrospinal fluid signal from the spinal column as an internal reference. There were no significant differences between the five measured volunteers, or between the different discs (L1/2 – L5/S1), that were analysed. Therefore, internal referencing using CSF has the potential for sodium content quantification in intervertebral discs, which may be used as an indicator of disc degeneration.
Introduction
It was shown, that the sodium concentration measured with 23Na MRI highly correlates with the proteoglycan concentration in intervertebral discs. 1 Therefore, lower 23Na MRI signal may indicate early stage intervertebral disc degeneration. To assess the concentration of sodium ions from 23Na MRI, one possibility is to use an external phantom placed close to the patient. Furthermore, the knowledge of 23Na T1 and T2 relaxation times of the tissue and of the phantom is needed for reliable quantification. Moreover, a reference phantom will require B0 and B1 field corrections, in particular, if a surface coil is used.
The purpose of this abstract was to evaluate and compare the 23Na signal from intervertebral discs of healthy volunteers using CSF as an internal reference.
Material and Methods
After giving written and oral consent, five volunteers (2 f/3 m, 29+/-7 years old) had been measured using 7 T MRI (Magnetom, Siemens Healthineers, Erlangen, Germany) with a dedicated six channel 23Na-tuned spine coil (Quality Electrodynamics, Mayfield Village, Ohio). After the 90 degrees pulse adjustment using a 2D spectroscopic sequence, a 3D gradient echo sequence with variable echo time train (vTE-GRE) optimized for 23Na signal was acquired with the following parameters: resolution 2.6⨯2.6 mm2 in sagittal plane, 8.0 mm slice thickness, field of view 380x380x128 mm3, 8 averages, repetition time of 135 ms, echo time of 0.78 ms at the center of the k-space, pulse bandwidth 130 Hz/Px, pulse duration 650 μs, flip angle 90°, acquisition time of 19:47 minutes. For B1 field correction, each in-vivo measurement was followed by measuring a homogeneous torso phantom (1% agar and 0.9% NaCl) using the same parameters and position as in the volunteer measurement.
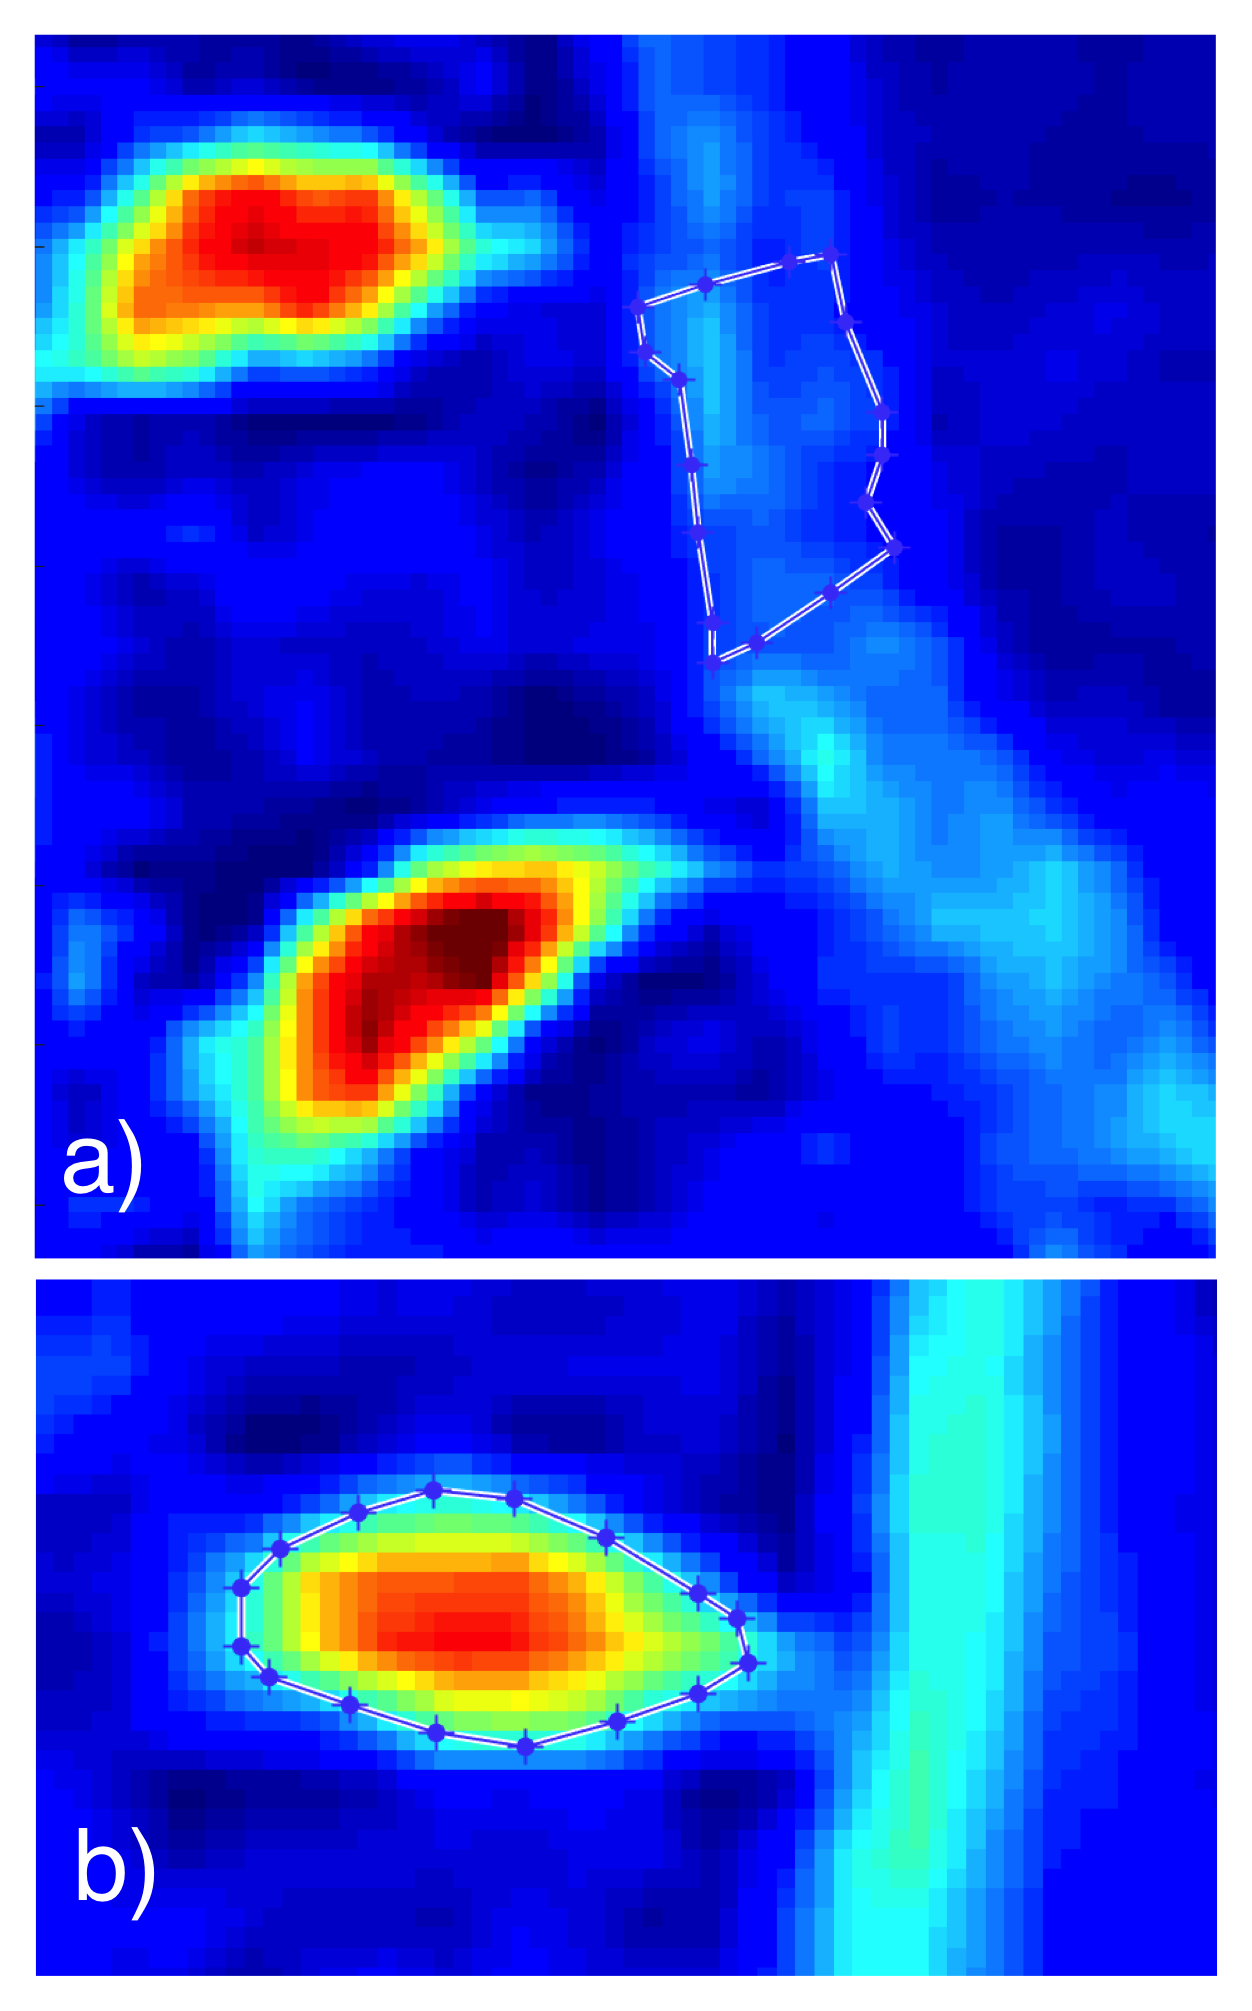
Volunteer images were corrected by the normalized phantom measurement data. CSF region of interest (ROI) placement was chosen behind L5 vertebra, because of its central placement and relative homogeneity of the signal in all measured volunteers. Polygonal ROIs were created for the CSF and the five discs L1/2 – L5/S1. Example of ROI placement and form can be found in the Figure 1. Image processing and ROI positioning was done using an in-house script written in MATLAB (Mathworks Inc, Natick, MA).
One-way analysis of variance (ANOVA) was used to assess the signal differences between the quantified discs (L1/2 – L5/S1) and between all measured volunteers using IBM SPSS Statistics Version 22 (Armonk, NY).
Results
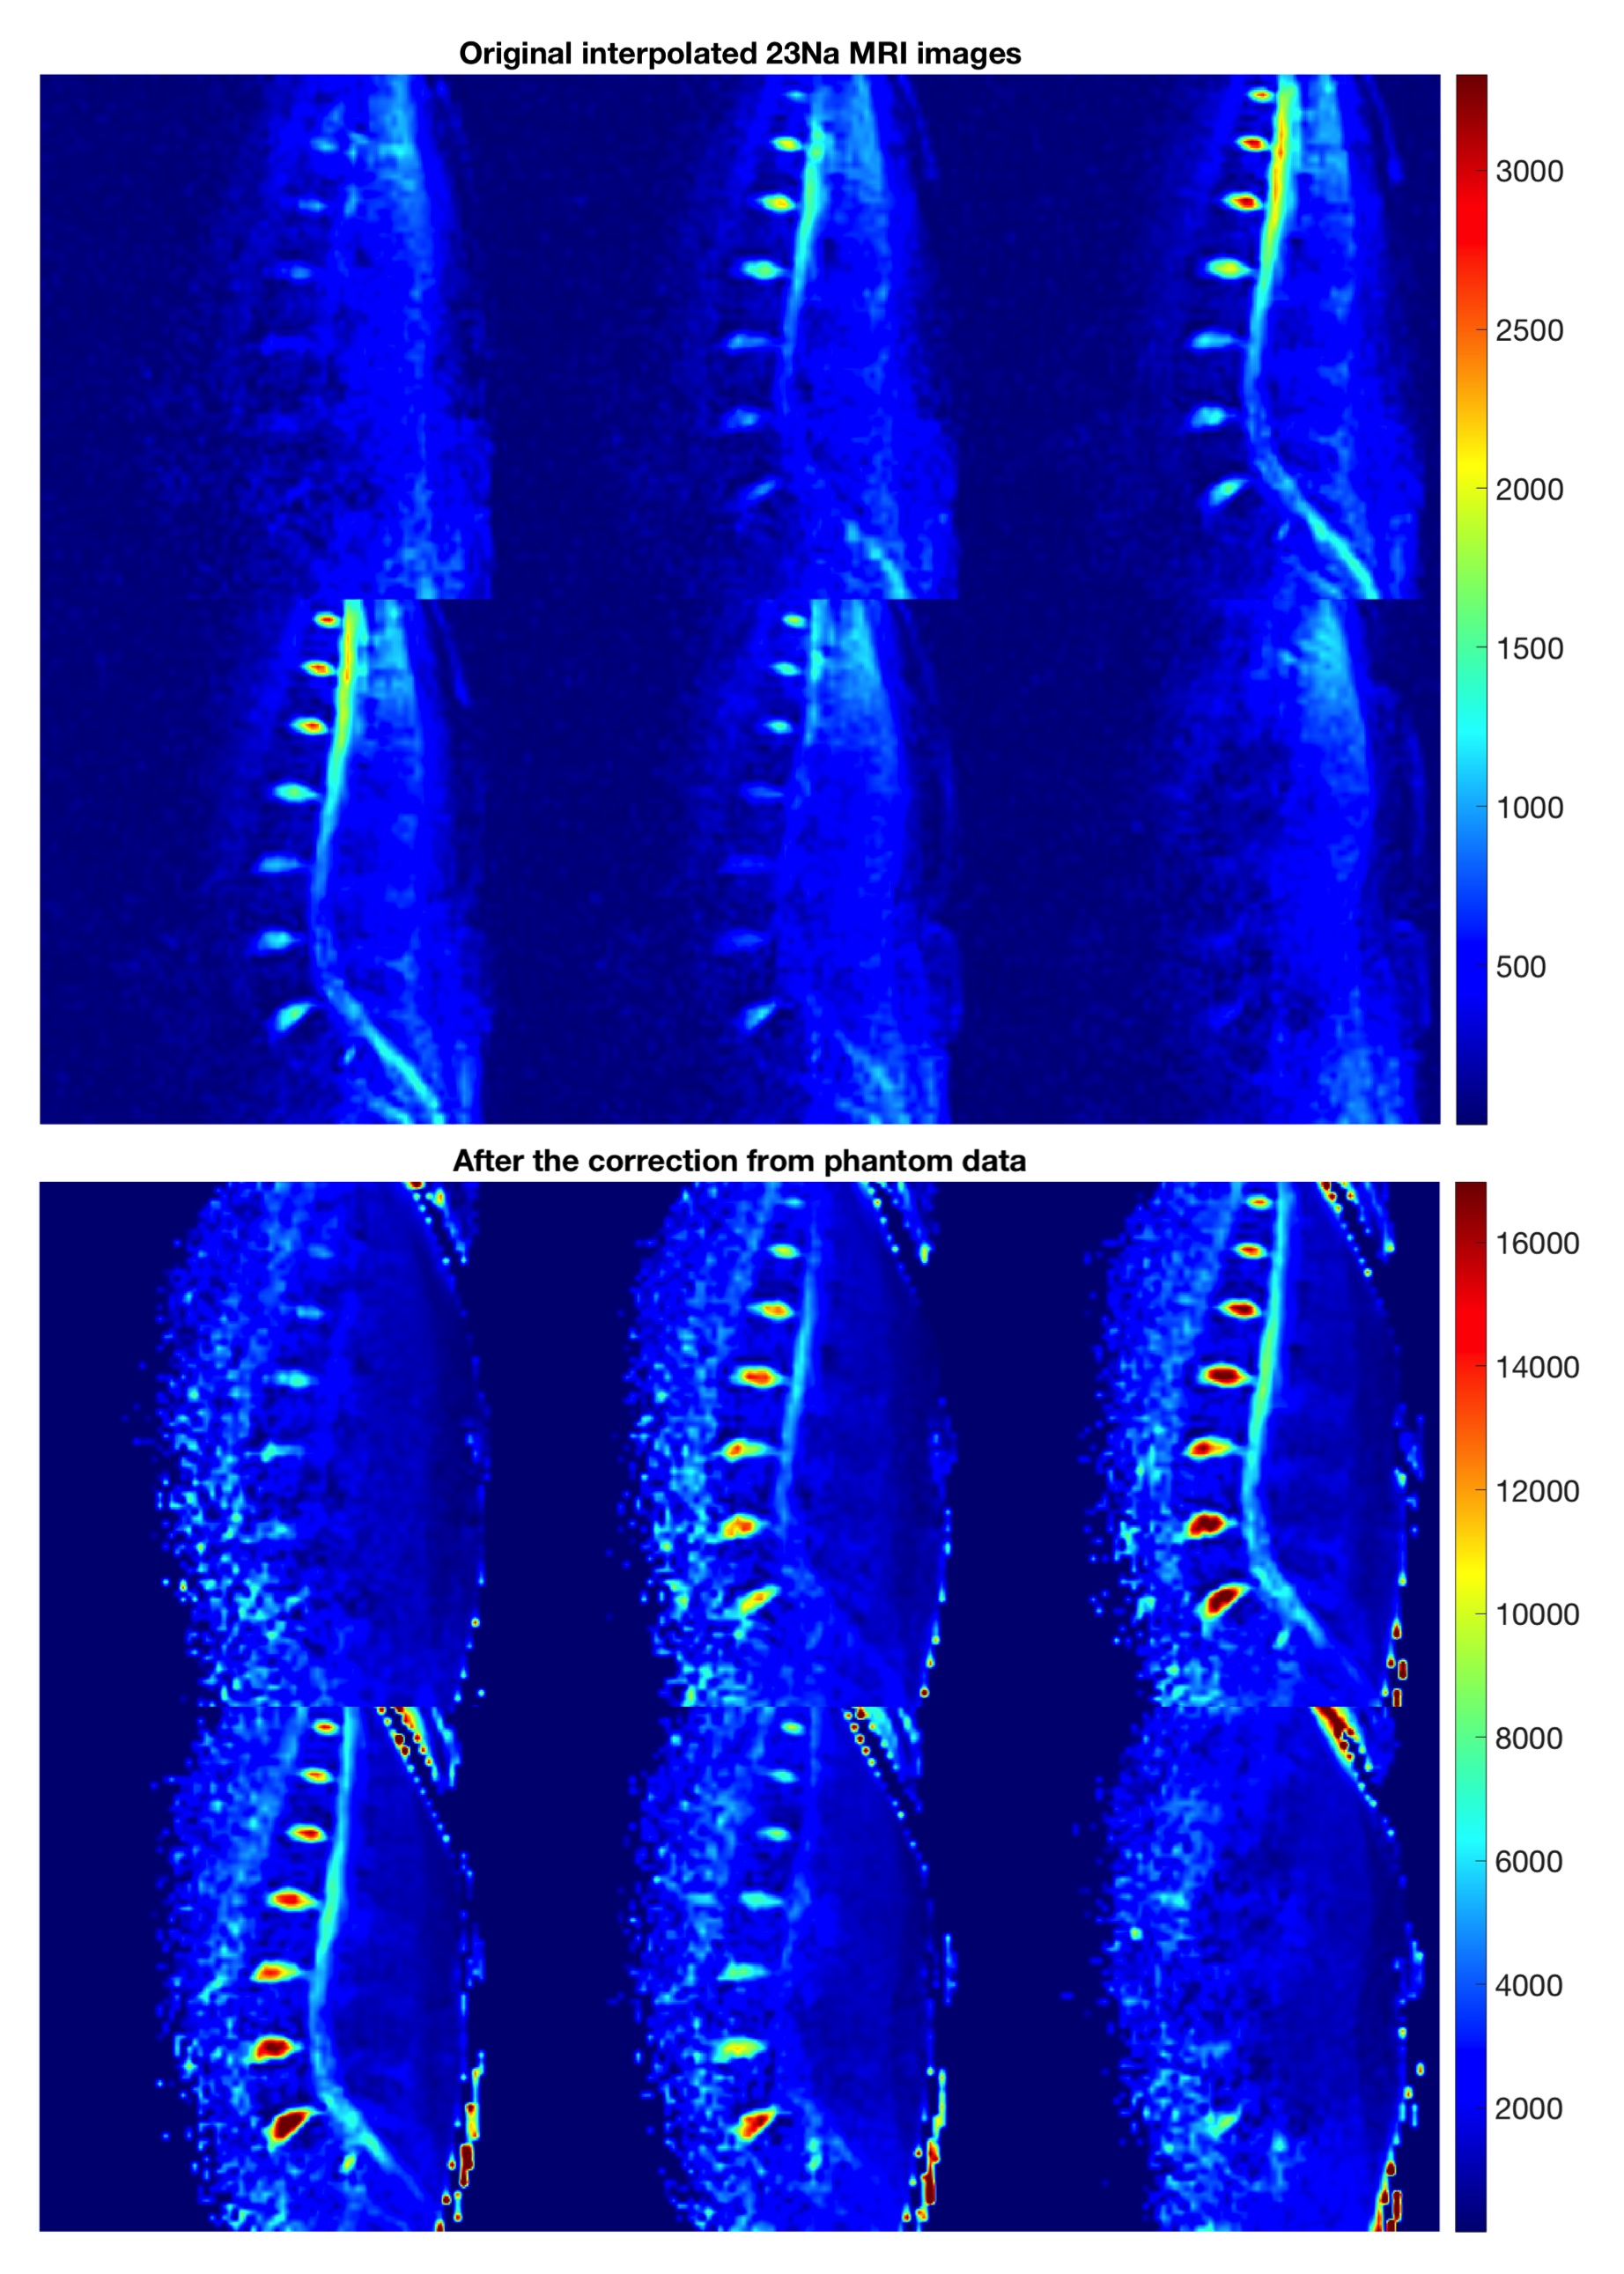
Figure 2 shows 23Na MR-images before (top) and after B1 field correction (bottom) based on the measured phantom.
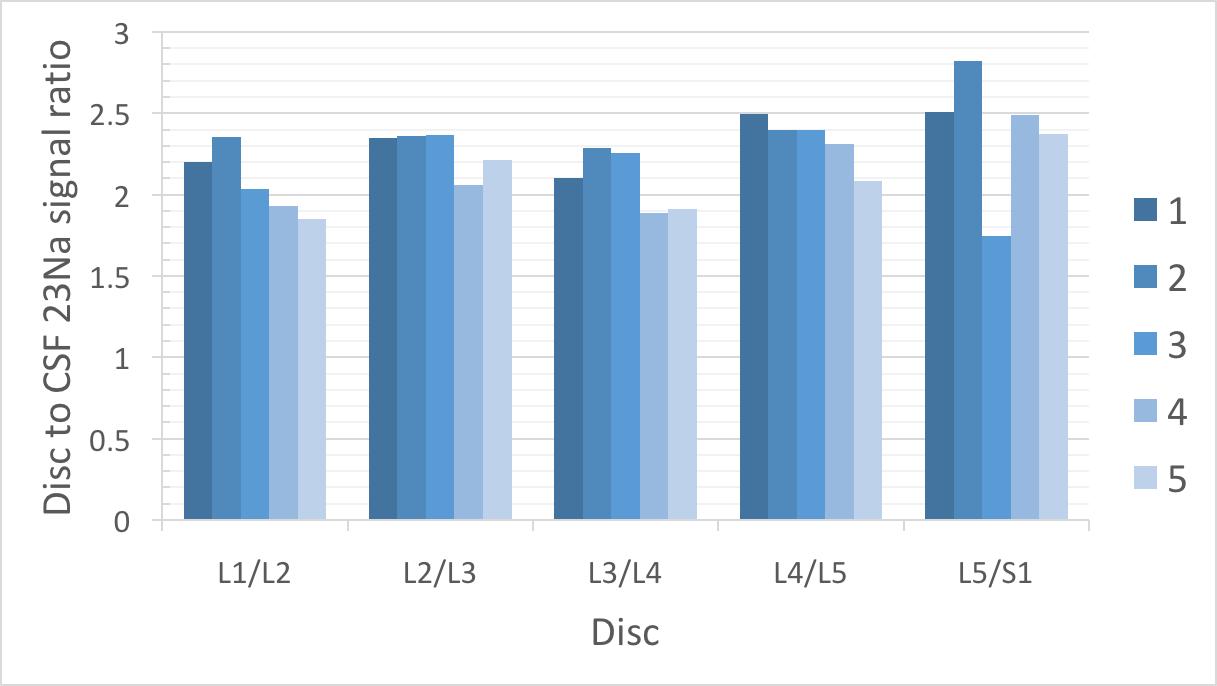
A plot giving the different values of average 23Na disc signal to CSF from all volunteers and lumbar discs is shown in the Figure 3. Average 23Na disc signal to CSF ratios were as follows: L1/L2 2.33 +/- 0.18, L2/L3 2.44 +/- 0.21, L3/L4 2.16 +/- 0.27, L4/L5 2.14 +/- 0.26 and L5/S1 2.09 +/- 0.22.
There was no significant difference found between the average discs to CSF signal for each volunteer (r = 0.114) and no significant difference between the average values from each specific discs (L1/2 – L5/S1) from all volunteers, meaning no significant difference depending on the disc position relative to the coil (r = 0.161).
Discussion and Conclusion
Internal referencing using CSF was already employed. Wang et al created 23Na maps of the intervertebral discs assuming a sodium CSF concentration of 150 mM in two volunteers. 1 For the assessment of 23Na in kidneys, Haneder et al measured the absolute concentration of CSF at different places along the spinal column and reported the lowest variability in CSF adjacent to L4/L5 if compared to other regions. 2 Their results were used for ROI placement (CSF adjacent to L5) in this work.
Our and the previous work show, that sodium signal of CSF is not homogeneous along the spinal column. This indicates, that referencing to CSF should be done standardized using one region with minimal partial volume effects coming from the spinal cord.
In conclusion, internal referencing using CSF has the potential for 23Na MRI content quantification in intervertebral discs, which may be used as an indicator of disc degeneration and, furthermore, as a proteoglycan biomarker in general.
Acknowledgements
We acknowledge financial support by the OeNB (grant #13418).References
1. Wang Ch, McArdle E, Fenty M et al. Validation of Sodium MRI of Intervertebral Disc. Spine. 2010; 35(5): 505–510.
2. Haneder S, Konstandin S, Morelli JN et al. Assessment of the Renal Corticomedullary 23Na Gradient Using Isotropic Data Sets. Acad Radiol. 2013;20:407-413.
Figures