3980
Frequency-dependent cortical plasticity via GABA modulation1University of Manchester, Manchester, United Kingdom, 2University of Valparaiso, Chile, Manchester, United Kingdom
Synopsis
Gamma-Aminobutyric acid (GABA) is the major inhibitory neurotransmitter in the human brain and is thought to underlie plasticity processes. We tested the effect of repetitive tactile stimulation using two driving frequencies on GABA concentration using functional magnetic resonance spectroscopy (
Introduction
Long-term potentiation (LTP) (1, 2) is the cellular mechanism thought to facilitate synaptic plasticity and has been observed across multiple animal and human models (3). At the cellular level, neuroplasticity involves modulation of synaptic activity via the regulation of neurotransmitters with growing evidence that GABA and glutamate (Glu) are critical to the process (4, 5). GABA is the main inhibitory neurotransmitter in the human brain and previous animal work has indicated that GABAergic neurons may underlie frequency-dependent plasticity (6). Using functional magnetic resonance spectroscopy (fMRS), we tested the effect of repetitive tactile simulation at- (23 Hz), and above- (39 Hz) the resonance frequency of the primary somatosensory cortex (SI) on GABA and Glx (glutamate+glutamine) concentrations and linked changes in GABA to behavioural markers of plasticity. fMRS allows us to detect dynamic changes in metabolite concentration related to cortical function as a result of ongoing stimulation or learning. In this study, we were able to detect changes within a single scan session at 3T making fMRS a valuable tool to assess the efficacy of plasticity interventions in healthy and clinical populations.
Methods
Ten healthy participants completed a tactile discrimination task before and after two separate scanning sessions. In each session, participants received 46 minutes of co-stimulation of two digits on the right hand at one of the two driving frequencies.
fMRS was obtained continuously for the first and last twelve minutes of the co-stimulation using a 3 Tesla Philips MRI scanner to assess the effects of co-stimulation on neurotransmitter concentrations within SI (see Fig. 1). We used a MEGA-PRESS pulse sequence to acquire the spectra with a voxel size of 20x30x20 mm^3 in the left primary somatosensory cortex, i.e. contralateral to the digit co-stimulation. The GABA optimised MEGA-PRESS spectra had the selective pulses set to the frequency of 1.89 ppm, coupled to the detected GABA signal at 3.01 ppm, and to 7.6 ppm symmetrically disposed about the water signal. The pulses were Gaussian with 14 ms duration and 106 Hz bandwidth. TE (=TE1+TE2) was 70 ms with a TE1 of 12.6 ms and the TE2 of 57.4 ms. The spectra were acquired in blocks of 4 averages when the MEGA pulse was set at 1.89 ppm (MEGA-on), referred to as a single dynamic, followed by 4 averages of MEGA pulse set at 7.6 ppm (MEGA-off). The dynamics were then repeated in an interleaved manner for 12 mins (90 dynamics). Repetition time (TR) was 2000 ms with 1024 samples. Receiver bandwidth was 2000 Hz, water suppression method was excitation with a window of 140 Hz and the shimming was second order pencil beam. The N-acetylaspartate (NAA) peak at 2.02 ppm was used for frequency referencing.
Analysis of the spectroscopic data to quantify GABA was performed in jMRUI software (7) using QUEST (8), a nonlinear least squares fitting algorithm which fits a weighted combination of metabolite signals directly to the data. An initial metabolite basis set for the sequence used as prior knowledge for QUEST quantification was obtained from the scanner using phantoms with a single metabolite of NAA, Glu, glutamine (Gln) or GABA (8, 9). For accurate frequency referencing and phase estimation of the spectrum, we summed all dynamics which had their MEGA frequency set at 1.89 ppm. The MEGA-PRESS phase was fixed at the NAA phase minus 180˚. Any residual water peak was removed using Hankel Lanczos Singular Values Decomposition. To quantify Glx, we used single resonance quantification at 3.75 ppm which was performed using AMARES. GABA and Glx were reported relative to the NAA signal.
Results
The tactile discrimination task is considered to be a marker of plastic change with worsening performance indicating the induction of LTP-like plasticity. Using fMRS, we observed that GABA levels decreased by more than 50% after co-stimulation with the above-resonance frequency only [p=0.030] (see Fig. 2). Glx levels remained stable for both conditions. Performance on the tactile discrimination task was impaired after above-resonance co-stimulation and the degree of impairment was correlated with the decrease in GABA (see Fig. 3), providing evidence that the GABA change predicts the degree of plasticity. (Pearson correlation coefficient = -0.56, p = 0.015).Discussion and Conclusion
In this study, we have successfully used fMRS to measure frequency-specific changes in GABA and Glx levels in vivo and relate these combined measurements to behavioural mechanisms of plasticity within a single scanning session. We suggest that fMRS is an important tool which can be used to determine the mechanisms of plasticity and the degree to which therapies are effective. The approach can be used to optimise rehabilitation strategies, for example, after stroke, by using GABA as a biomarker to determine the efficacy of treatments.Acknowledgements
CLC is funded by an MRC Fellowship, Reference MR/P014445/1.
NTB is funded by an EPSRC Fellowship, Reference: EP/N006771/1
References
1. Bliss TV, Lømo T, Long-lasting potentiation of synaptic transmission in the dentate area of the anaesthetized rabbit following stimulation of the perforant path. J Physiol (Lond) 232, 331-356. (1973).
2. Bliss TV, Collingridge GL, A synaptic model of memory: long-term potentiation in the hippocampus. Nature 361, 31-39 (1993).
3. Malenka RC, Bear MF, LTP and LTD: An embarrassment of riches. Neuron 44, 5-21 (2004).
4. Bachtiar V, Stagg CJ, The role of inhibition in human motor cortical plasticity. Neuroscience 278, 93-104 (2014).
5. Mattson MP, Glutamate and Neurotrophic Factors in Neuronal Plasticity and Disease. Annals of the New York Academy of Sciences 1144, 97-112 (2008).
6. Davies CH, Starkey SJ, Pozza MF, Collinridge GL, GABA(B) autoreceptors regulate the induction of LTP. Nature 349, 609-611 (1991).
7. Stefan D et al., Quantitation of magnetic resonance spectroscopy signals: the jMRUI software package. Measurement Science and Technology 20, 104035–104044 (2009).
8. Ratiney H et al., Time-domain semi-parametric estimation based on a metabolite basis set. NMR in Biomedicine 18, 1-13 (2005).
9. Ratiney H et al., Time-Domain Quantitation based on a Metabolite Basis Set in Magnetic Resonance Spectroscopy. in ProRISC, IEEE Benelux, Veldhoven, The Netherlands, 432–437 (2002).
Figures
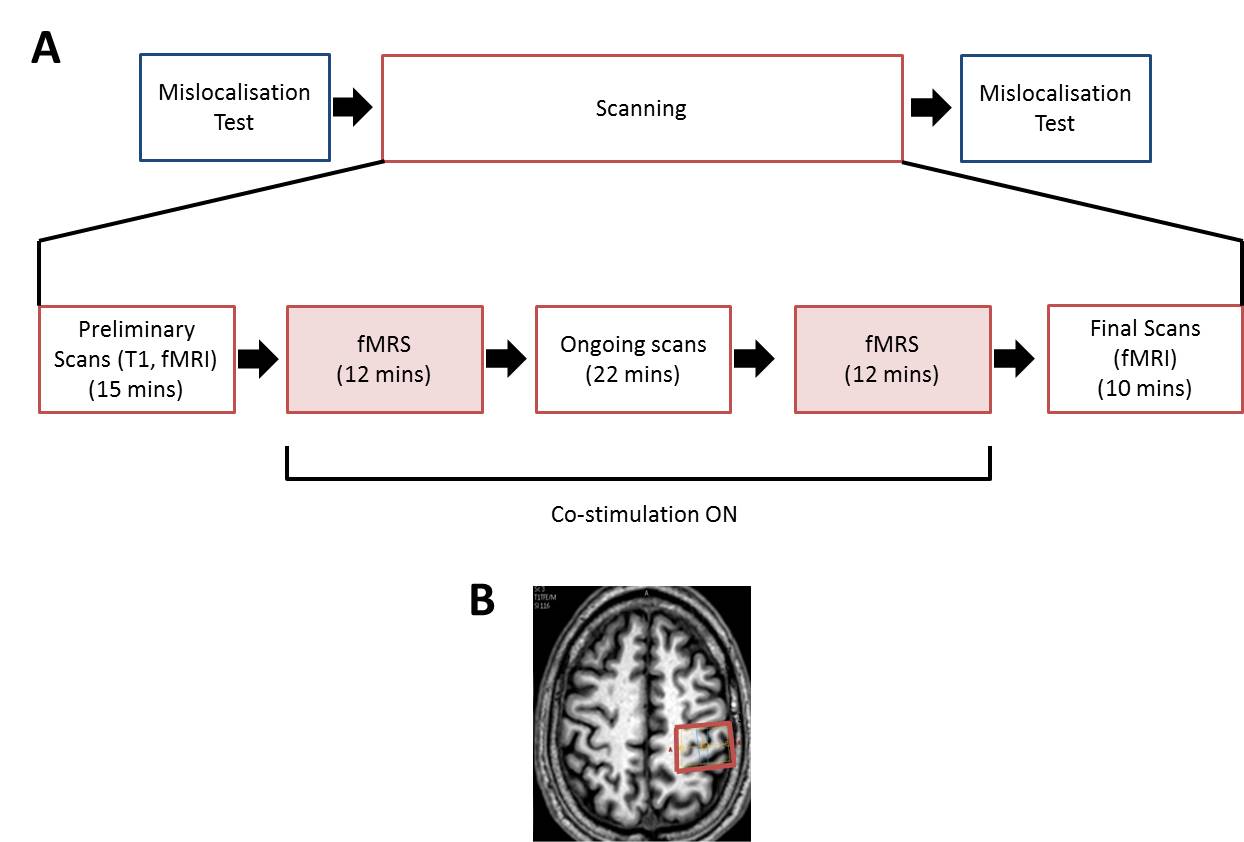
Figure 1: Schematic design of the study
(A) Schematic diagram of the experimental protocol. Initially, participants completed a mislocalisation test outside the scanner. Once inside the scanner, we acquired a high-resolution T1-weighted image which was used to guide placement of the spectroscopy voxels (B). This was followed by 10 mins of fMRI (not reported here), 12 mins of fMRS (shown in red) when the stimulation began, 22 mins of echo-planar imaging (not reported here), 12 mins fMRS after which the stimulation ceased, and a final 10 mins fMRI (not reported here). Once participants left the scanner, they immediately repeated the mislocalisation test a final time.
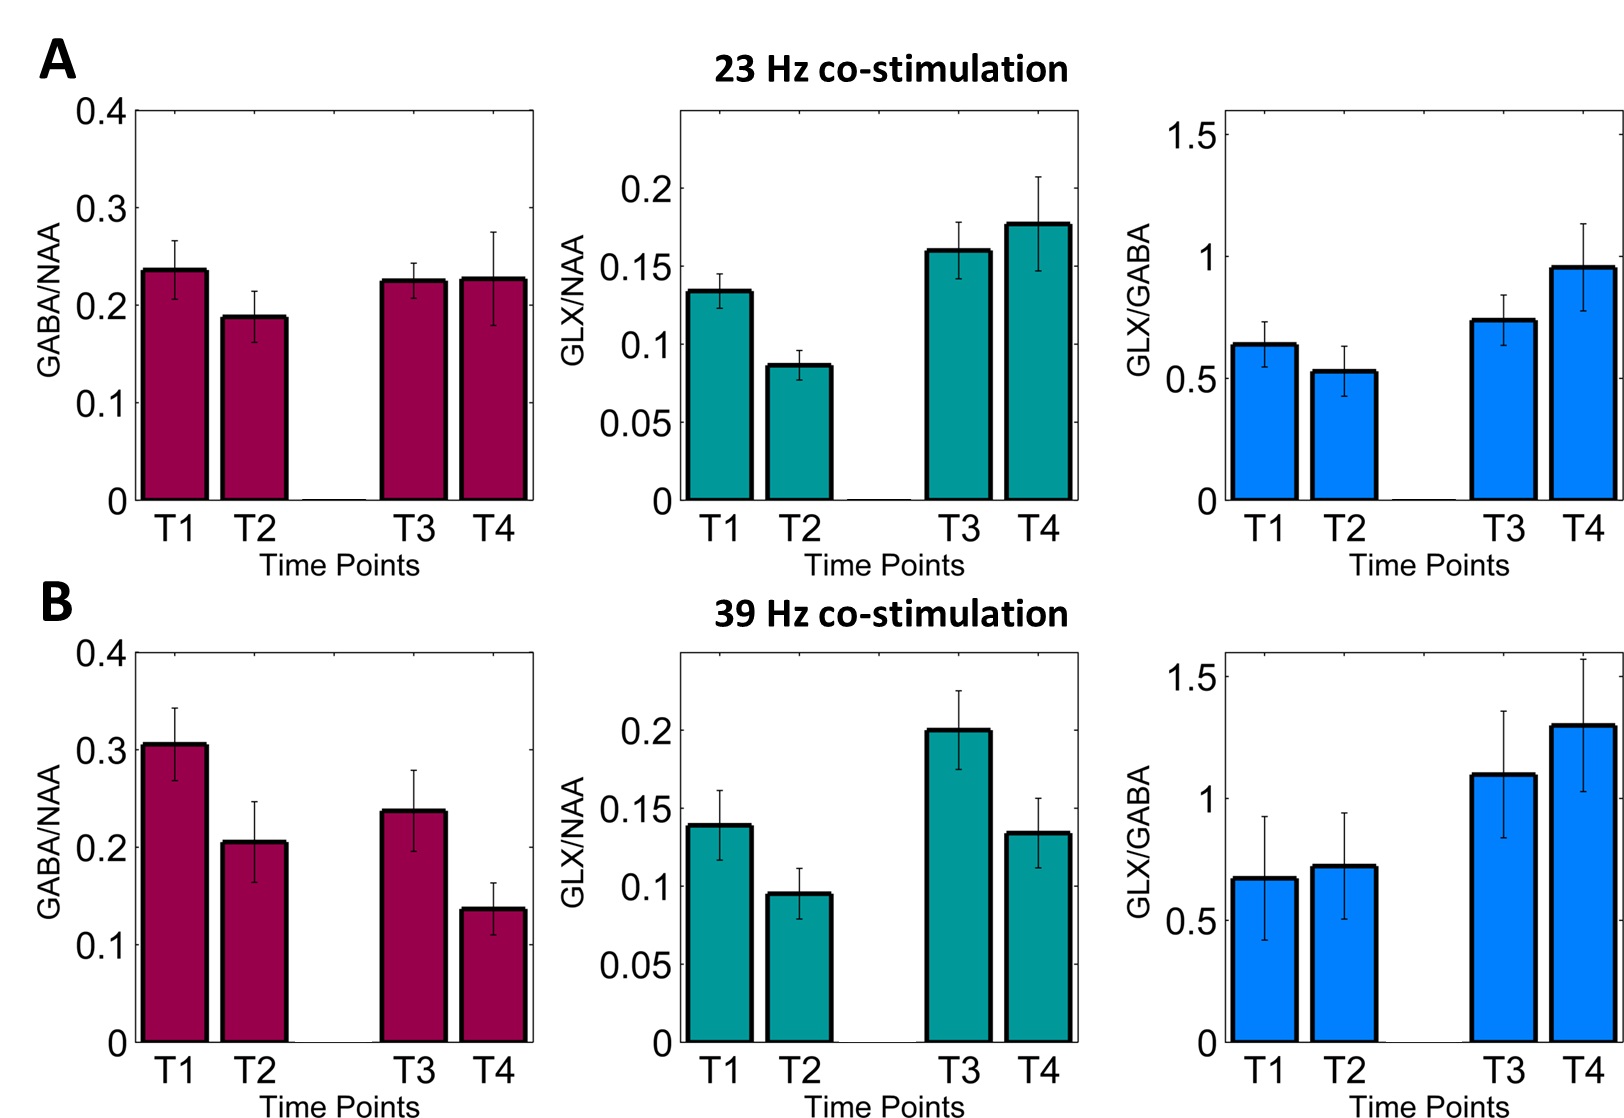
Figure 2: Spectroscopy Results
Spectroscopy results during stimulationGABA (red bar chart), Glx (green) both relative to NAA, and the ratio Glx/GABA is given in blue. Results are measured at 4 time points during co-stimulation of digits D2 and D4 of the right hand at 23 Hz (A) and 39 Hz (B). Time points relate to mins 0-6 (T1), 6-12 (T2), 34-40 (T3), 40-46 (T4) of co-stimulation.
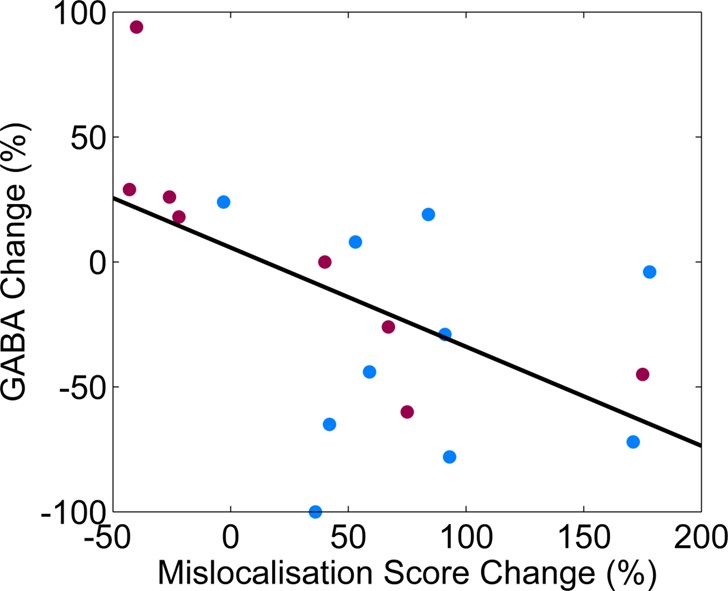
Figure 3: Correlation between the change in GABA and the change in mislocalisation score
The relationship between the change in mislocalisation scores (hard level only) vs. change in GABA levels (measured between the time points T1 and T4) is given following co-stimulation at-resonance (red) and above-resonance (blue).