3978
Increased Rostral Anterior Cingulate Cortex GABA+ Concentrations in IBS Patients with Anxiety1Department of Radiation Physics, and Department of Medical and Health Sciences, Linköping University, Linköping, Sweden, 2Center for Medical Image Science and Visualization, Linköping University, Linköping, Sweden, 3Institute of Clinical and Experimental Medicine, Division of Gastroenterology, Linköping University, Linköping, Sweden
Synopsis
The aim was to investigate whether Glutamate and GABA concentrations were altered in the rACC in patients with IBS compared to healthy controls, and to investigate if the GABA and Glutamate concentrations were associated with the level of anxiety in IBS patients. We observed higher rACC GABA+ concentrations in IBS patients, whereas Glx concentrations remained unaltered. Moreover, the changes in GABA concentrations were most pronounced in patients with high severity of anxiety. Thus, our findings provide first evidence of dysregulated rACC GABAergic neurotransmission in IBS, and suggest that altered inhibitory neurotransmission may be linked to comorbid anxiety in IBS patients.
Introduction
Irritable bowel syndrome (IBS) is a common chronic visceral pain disorder that is characterized by abdominal pain and irregular bowel habits in the absence of an identifiable organic cause [1]. IBS is considered an exemplary disease of brain-gut communication and a key role of psychological comorbidities with anxiety and depression, which affect a large portion of patients, is increasingly acknowledged in IBS pathophysiology. In this study, we were inspired by the theory of IBS as a disorder of the brain-gut communication [2,3]. Moreover, functional Magnetic Resonance Imaging (fMRI) studies have shown aberrant function in brain regions associated with emotion processing and regulation in patients with IBS [4]. Given that the changes in brain function are most consistently observed in the rostral anterior cingulate cortex (rACC), which is involved in emotion regulation and top-down corticolimbic inhibitory control [4-5], rACC may be the link between gastrointestinal complaints and psychological symptoms in IBS. Therefore, Magnetic Resonance Spectroscopy (MRS), which is a non-invasive method for metabolite quantification, would be a helpful tool to investigate altered rACC neurotransmission in IBS patients.
The purpose of this work was to investigate whether excitatory (glutamate) and inhibitory (GABA) neurotransmitter concentrations were altered in the rACC in patients with IBS compared to healthy controls. Furthermore, and to investigate if the GABA and Glutamate concentrations were associated with the level of anxiety and depression in the IBS patients compared to the healthy controls.
Materials and Methods
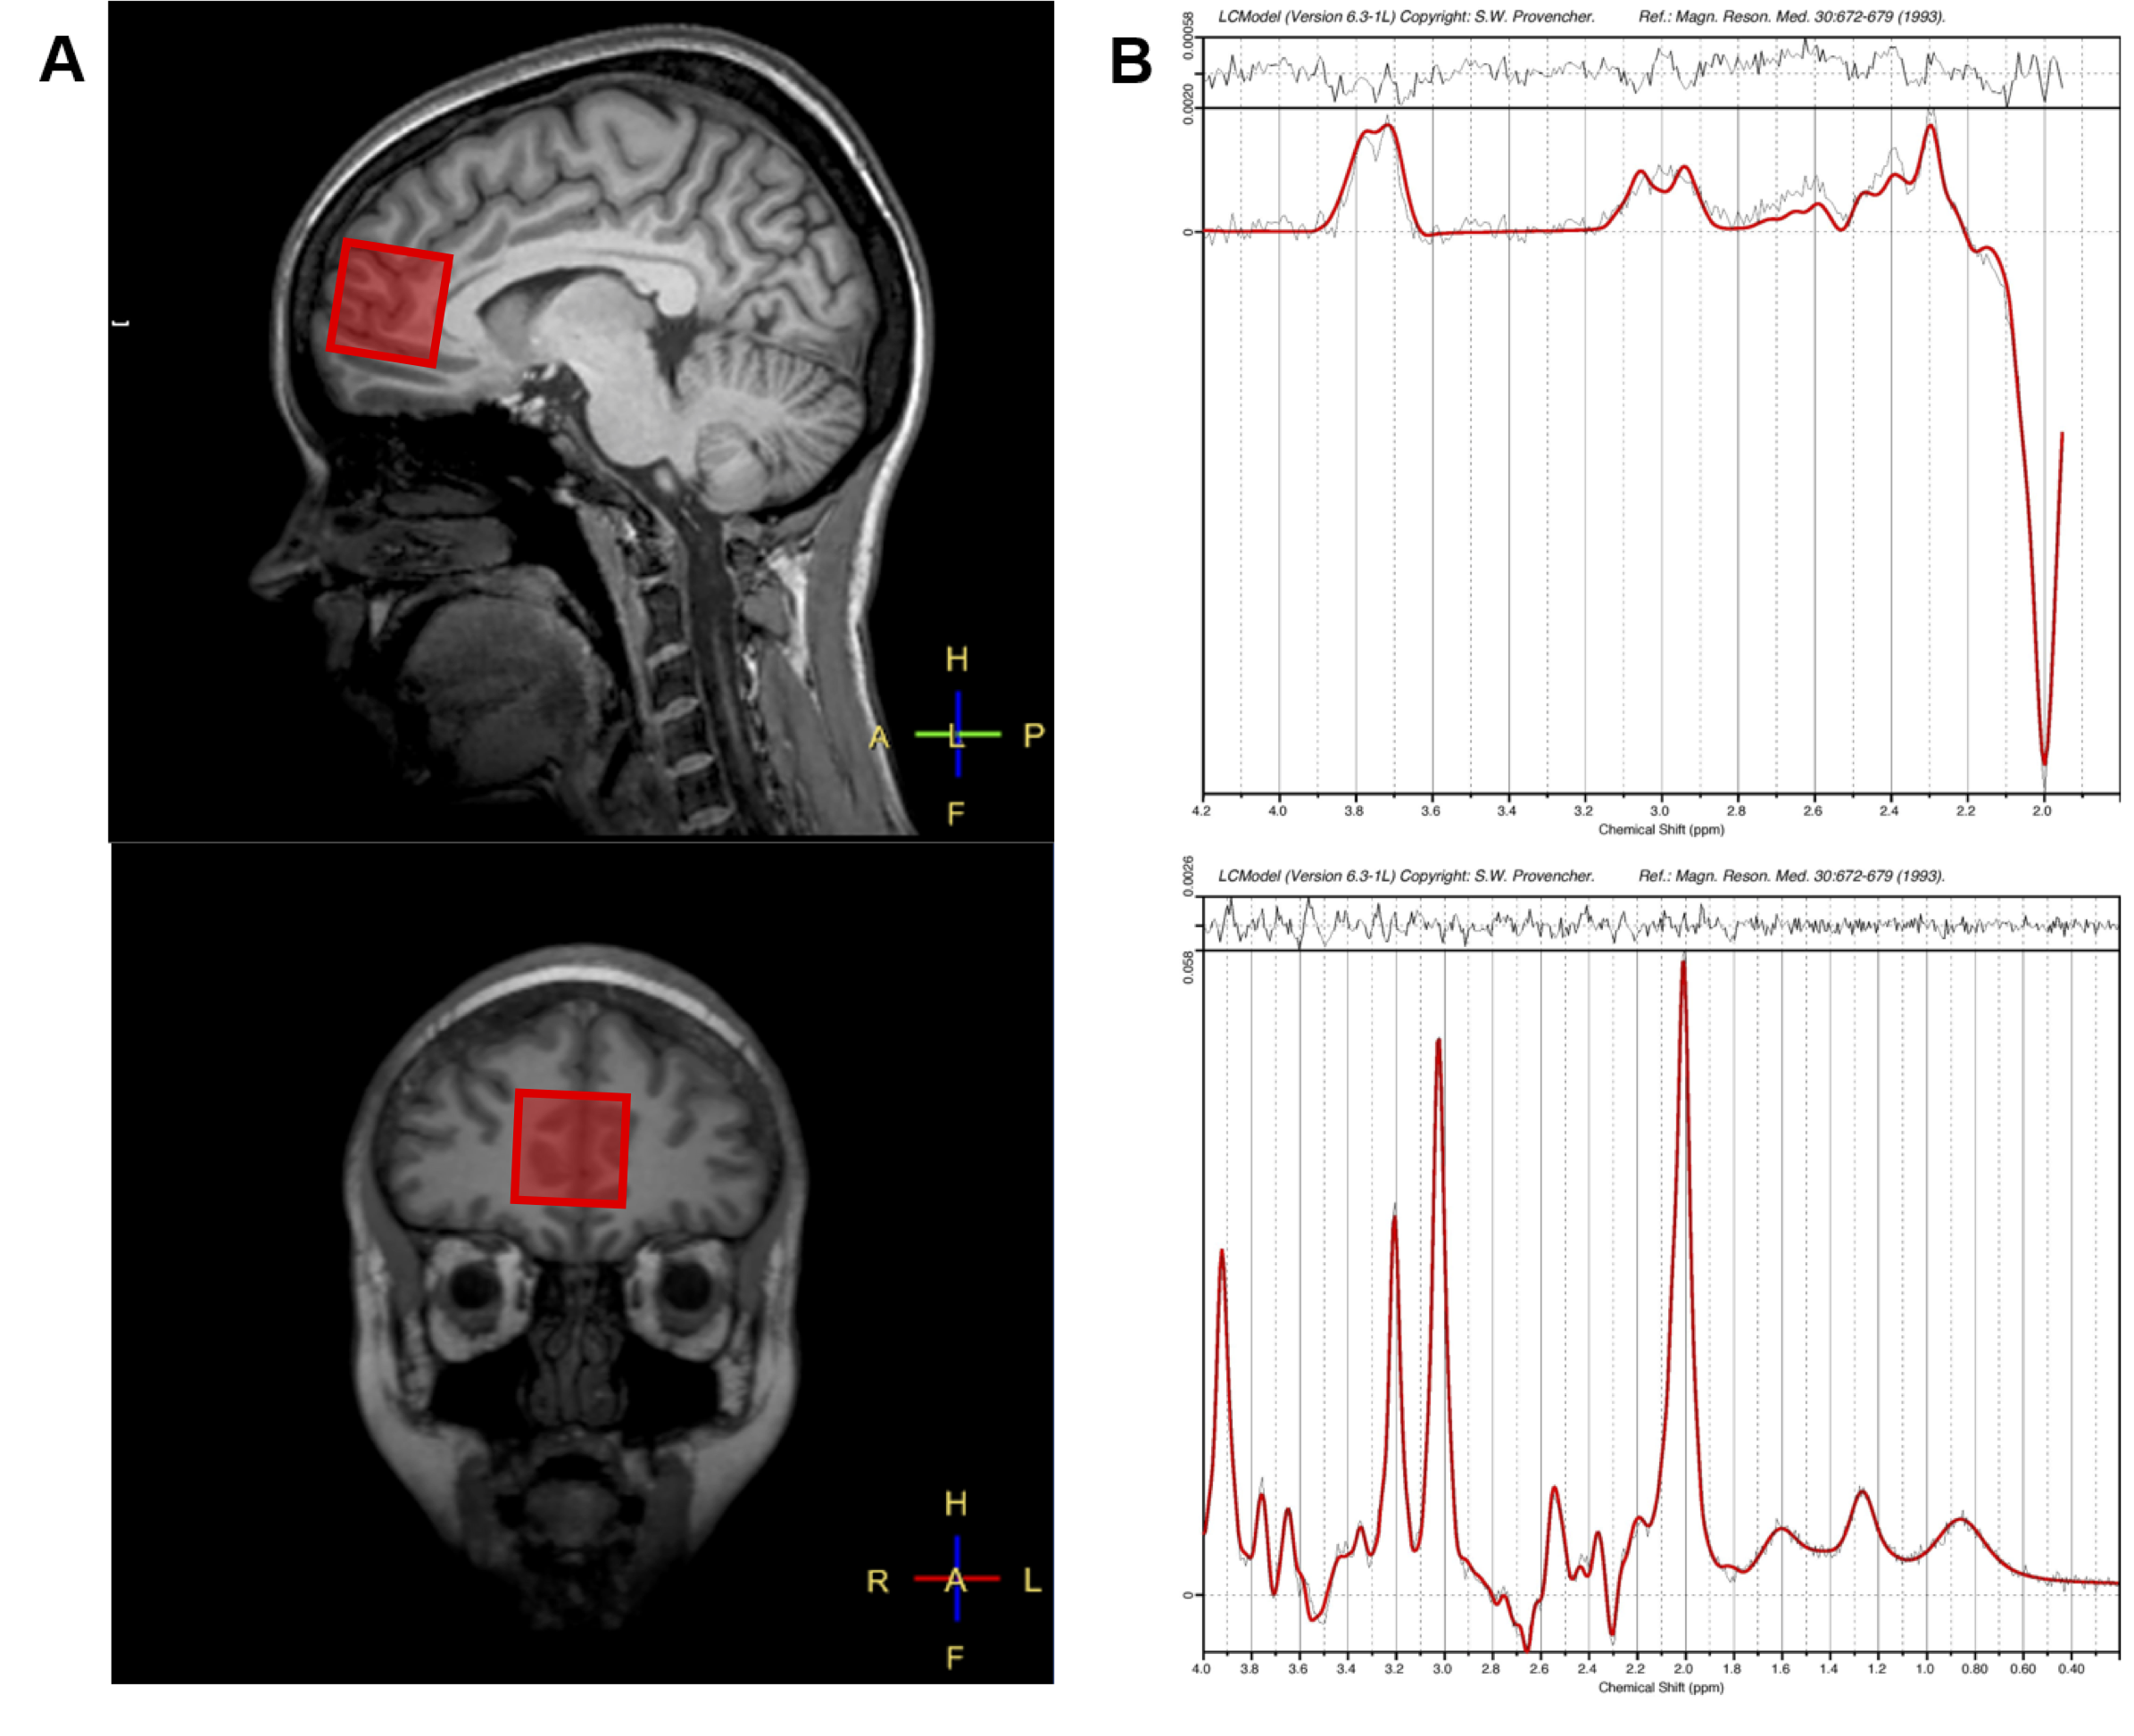
37 female IBS patients and 19 age-matched healthy females underwent an MRS examination using a 3 T Philips Ingenia MR scanner equipped with a 32-channel head coil. Following structural T1 weighted MRI used for voxel placement, data were acquired using a Mescher-Garwood Point Resolved Spectroscopy (MEGA-PRESS) pulse sequence [6-8] (TR/TE = 2000/68 ms, 40 dynamics each consisting of 8 phase cycle steps, edited pulse ON at 1.90 ppm, edited pulse OFF at 7.46 ppm, water suppression MOIST) with the voxel (30x30x30 mm3) placed in the rACC region (Fig. 1A). Directly afterwards, an unsuppressed water reference measurement (2 dynamics, no water suppression) was collected within the same voxel, which was used for water scaling and phase correction. The MRS data were phase corrected [9] using the water reference and frequency aligned based on the water residual in the water suppressed MRS data. The average OFF spectrum was subtracted from the average ON spectrum, which generated a resulting difference spectrum that revealed the GABA signal at 3 ppm (Fig. 1B). This difference spectrum was used as input to LCModel (Version 6.3-1L) to compute the GABA+ concentration (GABA plus coedited macromolecular signal). Solely the OFF spectra were average and used as input to LCModel when computing the Glx (combined Glutamate and Glutamine) concentrations (Fig. 1B).
The Hospital Anxiety and Depression Scale (HADS) [10] was used to assess the level of anxiety and depression in both patients and healthy controls. Furthermore, subgroup analyses (two groups; one with and one without high severity of psychological symptoms) were performed to find any associations between rACC neurotransmitter concentrations and anxiety and depression severity.
Result
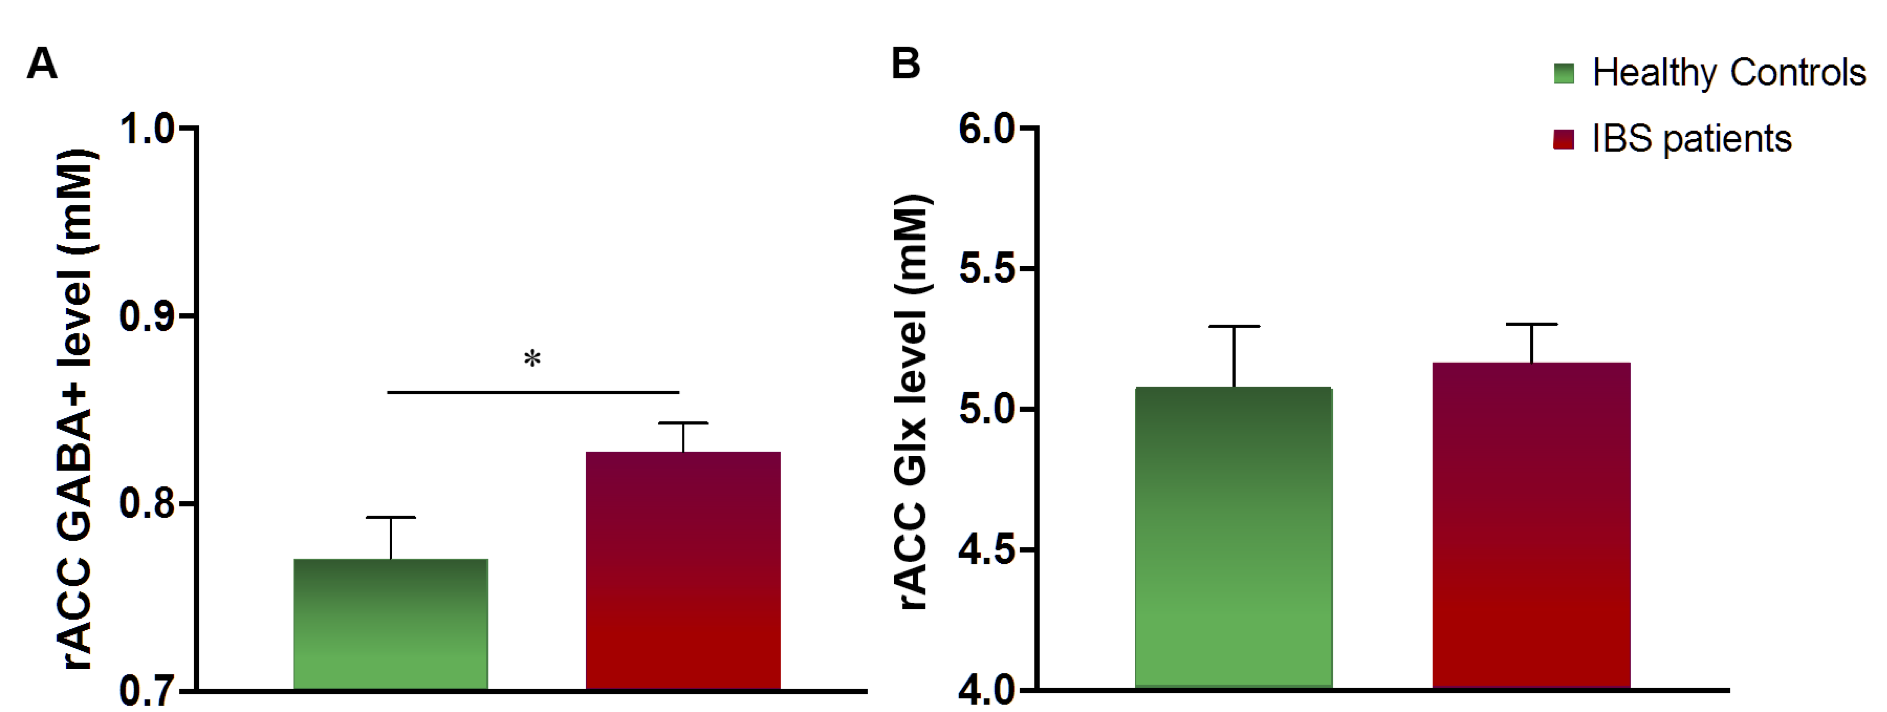
Patients with IBS exhibited significantly higher HADS scores (both p < 0.001) and higher rACC GABA+ concentrations (p = 0.04) compared with healthy controls. However, there was no significant difference in Glx concentrations (p > 0.4) between the two groups (Fig.2).
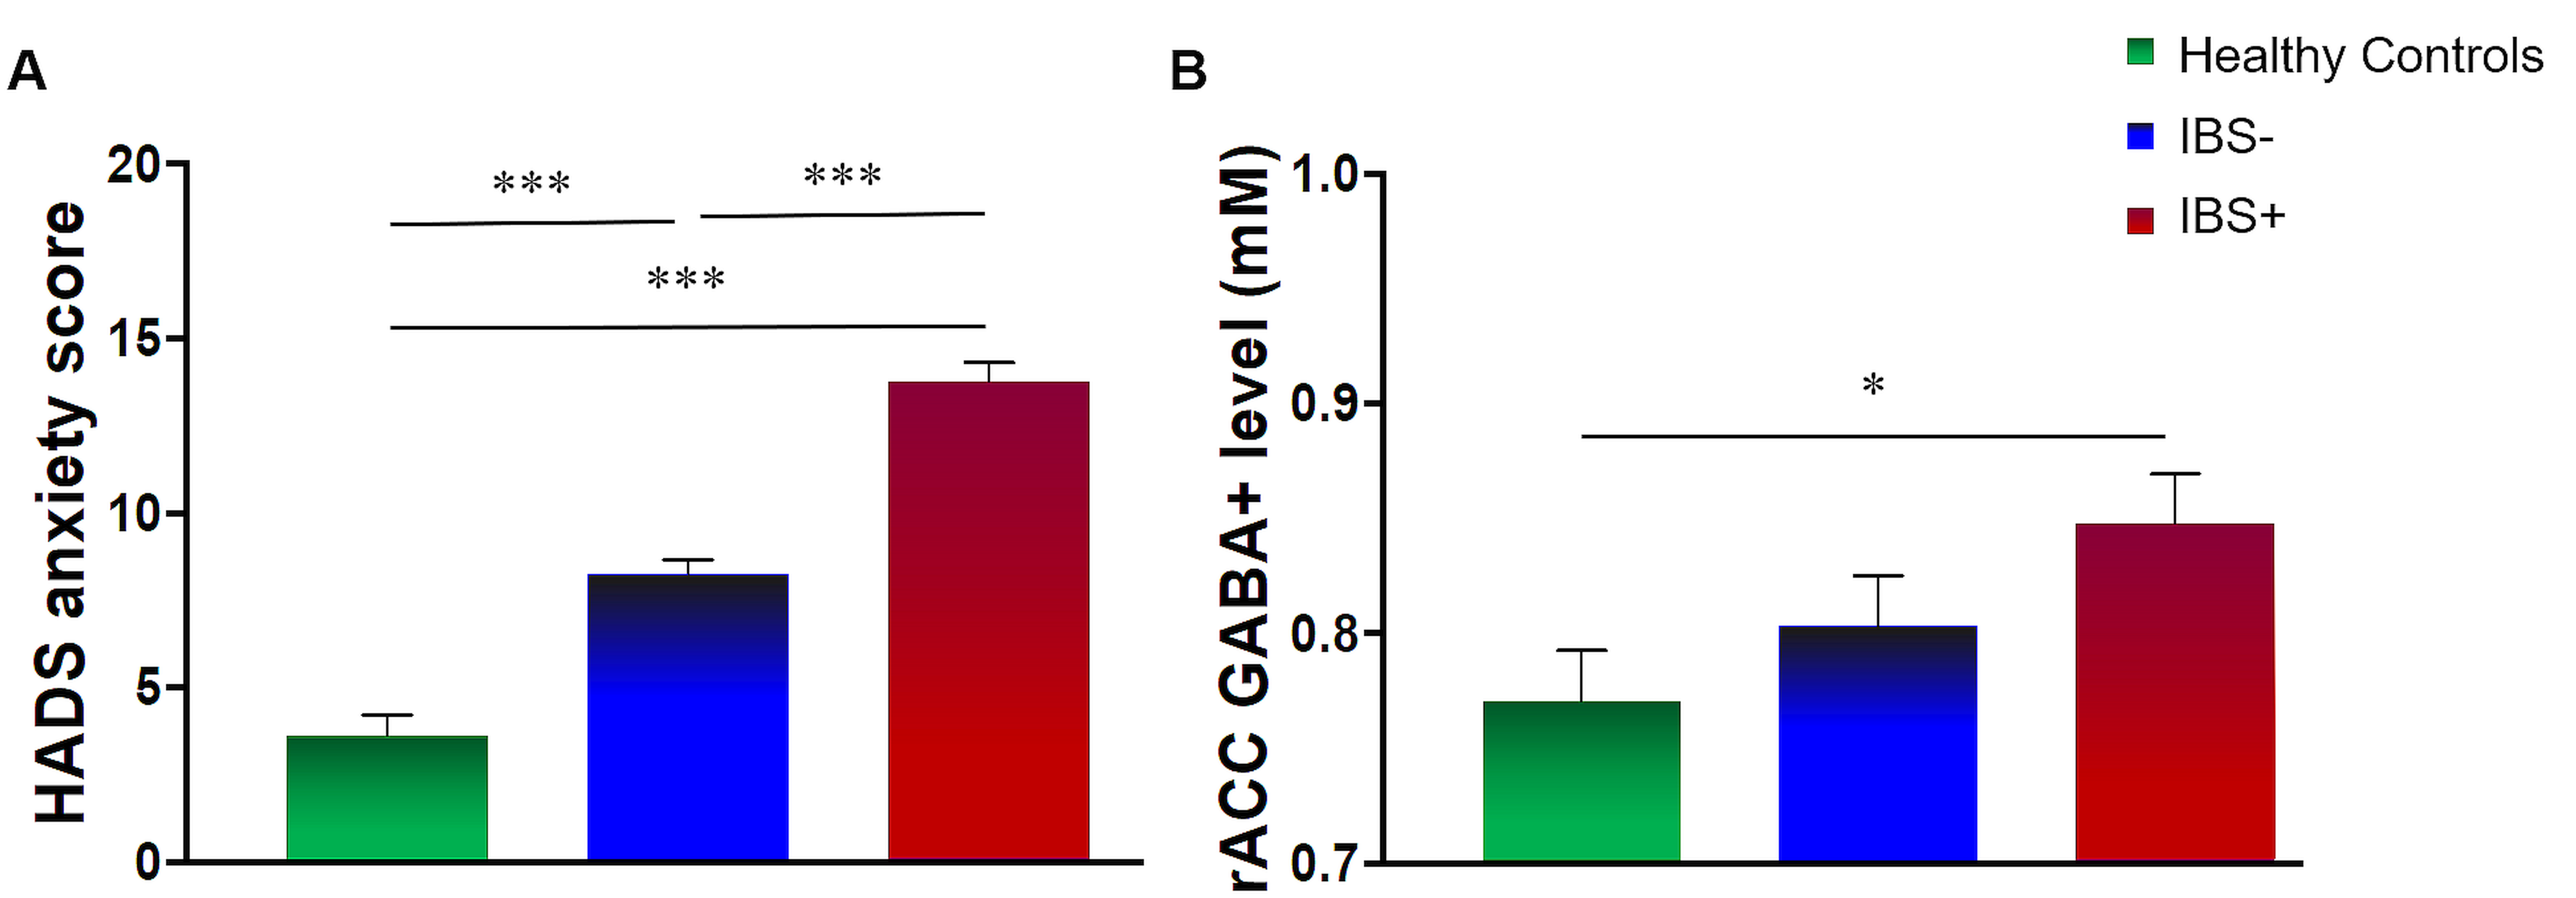
The patient group was split into two subgroups depending on high (IBS+) and low (IBS-) anxiety scores. This analysis revealed a higher GABA+ in patients with higher anxiety scores compared to healthy controls (Fig. 3).
Discussion
We observed higher rACC GABA+ concentrations in IBS patients compared to healthy controls, whereas Glx concentrations remained unaltered. The changes in GABA concentrations were most pronounced in patients with high severity of anxiety. Our findings suggest a disruption of inhibitory neurotransmission in rACC and anxiety appeared to be a major factor responsible for the detected group differences in rACC GABA+ concentrations.Conclusion
Our findings provide first evidence of dysregulated rACC GABAergic neurotransmission in IBS, and suggest that altered inhibitory neurotransmission may be linked to comorbid anxiety in patients with IBS.Acknowledgements
We are grateful to Richard Edden of Johns Hopkins in Baltimore for very generously providing the MEGA-PRESS pulse sequence and other tools developed under NIH GRANTS P41 015909 and R01 016089.References
1. Enck P, Aziz Q, Barbara G, Farmer AD, Fukudo S, Mayer EA et al. Irritable bowel syndrome. Nat Rev Dis Prim 2016; 2: 16014.
2. Drossman DA, Hasler WL. Rome IV - Functional GI disorders: Disorders of gut-brain interaction. Gastroenterology 2016; 150: 1257–1261.
3. Mayer EA, Knight R, Mazmanian SK, Cryan JF, Tillisch K, Emeran X et al. Gut Microbes and the Brain: Paradigm Shift in Neuroscience. J Neurosci 2014; 34: 15490–15496.
4. Mayer EA, Gupta A, Kilpatrick LA, Hong J-Y. Imaging brain mechanisms in chronic visceral pain. Pain 2015; 156 Suppl: S50-63.
5. Etkin A, Egner T, Kalisch R. Emotional processing in anterior cingulate and medial prefrontal cortex. Trends Cogn Sci 2011; 15: 85–93.
6. Mescher M, Merkle H, Kirsch J, Garwood M, Gruetter R. Simultaneous in vivo spectral editing and water suppression. NMR Biomed. 1998 Oct:11(6):266-72.
7. Mullins PG, McGonigle DJ, O'Gorman RL, Puts NA, Vidyasagar R, Evans CJ, et al. Current practice in the use of MEGA-PRESS spectroscopy for the detection of GABA. Neuroimage. 2014;86:43-52.
8. Mescher M, Tannus A, Johnson MOn, Garwood M. Solvent Suppression Using Selective Echo Dephasing. Journal of Magnetic Resonance, Series A. 1996;123(2):226-9.
9. Klose U. In vivo proton spectroscopy in presence of eddy currents. Magnetic Resonance in Medicine. 1990;14(1):26-30.
10. Zigmond AS, Snaith RP. The Hospital Anxiety and Depression Scale. Acta Psychiatr Scand 1983; 67: 361–370.
Figures