3977
Feasibility of ultra-short TE MRS with full intensity to detect human brain glutathione, glutamine and GABA on 3 T and 4 T1McLean Hospital; Harvard Medical School, Belmont, MA, United States, 2National Institute on Drug Abuse, Baltimore, MD, United States
Synopsis
GABA, glutamine (Gln) and Glutathione (GSH) are important metabolites in human brain. However, with regular proton MRS, all of them are subject to J modulations during the moderate TE and hardly reliably observed. This study utilizes SPECIAL, an ultra-short TE MRS with full intensity, on 3T and 4T human scanners to test its feasibility to detect GABA, Gln and GSH. Compared to 3T PRESS, SPECIAL on 3T and 4T observed consistent Gln and GSH concentrations with higher reliabilities. Uniquely, 4T SPECIAL observed GABA+MM signal with significantly lower CRLB compared to 3 T measurements.
Introduction
In addition to glutamate (Glu), GABA and glutamine (Gln) are important neurotransmitters with much lower concentrations. Glutathione (GSH) is a major intracellular antioxidant in human brain. To detect these compounds with one single MRS scan is very attractive. However, all these compounds are subject to J evolutions and overlapping with stronger resonances of other metabolites. The regular PRESS on human scanners is usually with spin echo time (TE) > 30 ms. The J modulation during PRESS TE leads to dispersive lineshapes of J-coupled peaks and makes the fitting unreliable (1). J editing (2-4) and TE optimized methods (5) have been developed to full resolve each (or dual) of these metabolites respectively. However, they lose other compounds’ information and not time-efficient. In this study, we explore the feasibility of ultra-short TE MRS to detect GSH, Gln and GABA on 3 T and 4 T human scanners, respectively. Instead of the STEAM method (6,7), the SPECIAL sequence with full signal intensity (8) was used to push the boundary of SNR at minimal cost of TE extension.Methods
The SPECIAL sequence was implemented and optimized for the Siemens 3 T Trio scanner with a 32-channel birdcage coil and the Agilent 4 T scanner with a quadrature surface coil, respectively. The TE on 3 T and 4 T were 8 ms and 10 ms, respectively. Different 8 healthy subjects went through the study on 3 T and 4 T scanners respectively, with the MRS voxel on the anterior cingulate cortex (ACC) region (30 x 20 x 30 mm3). On both scanners, 128 averages were acquired with TR = 3 s. For comparison, a factory version of PRESS with TE = 30 ms was also acquired for 5 of the 8 subjects on 3 T with the identical voxel location and shimming as that of SPECIAL.
Frequency and phase corrections per average were performed in the Matlab-based MRS toolkit FID-A (9). The eddy current corrections and fitting quantification was performed in LCModel (10) with the simulated macromolecule peaks accounting for the baseline.
Results and discussions
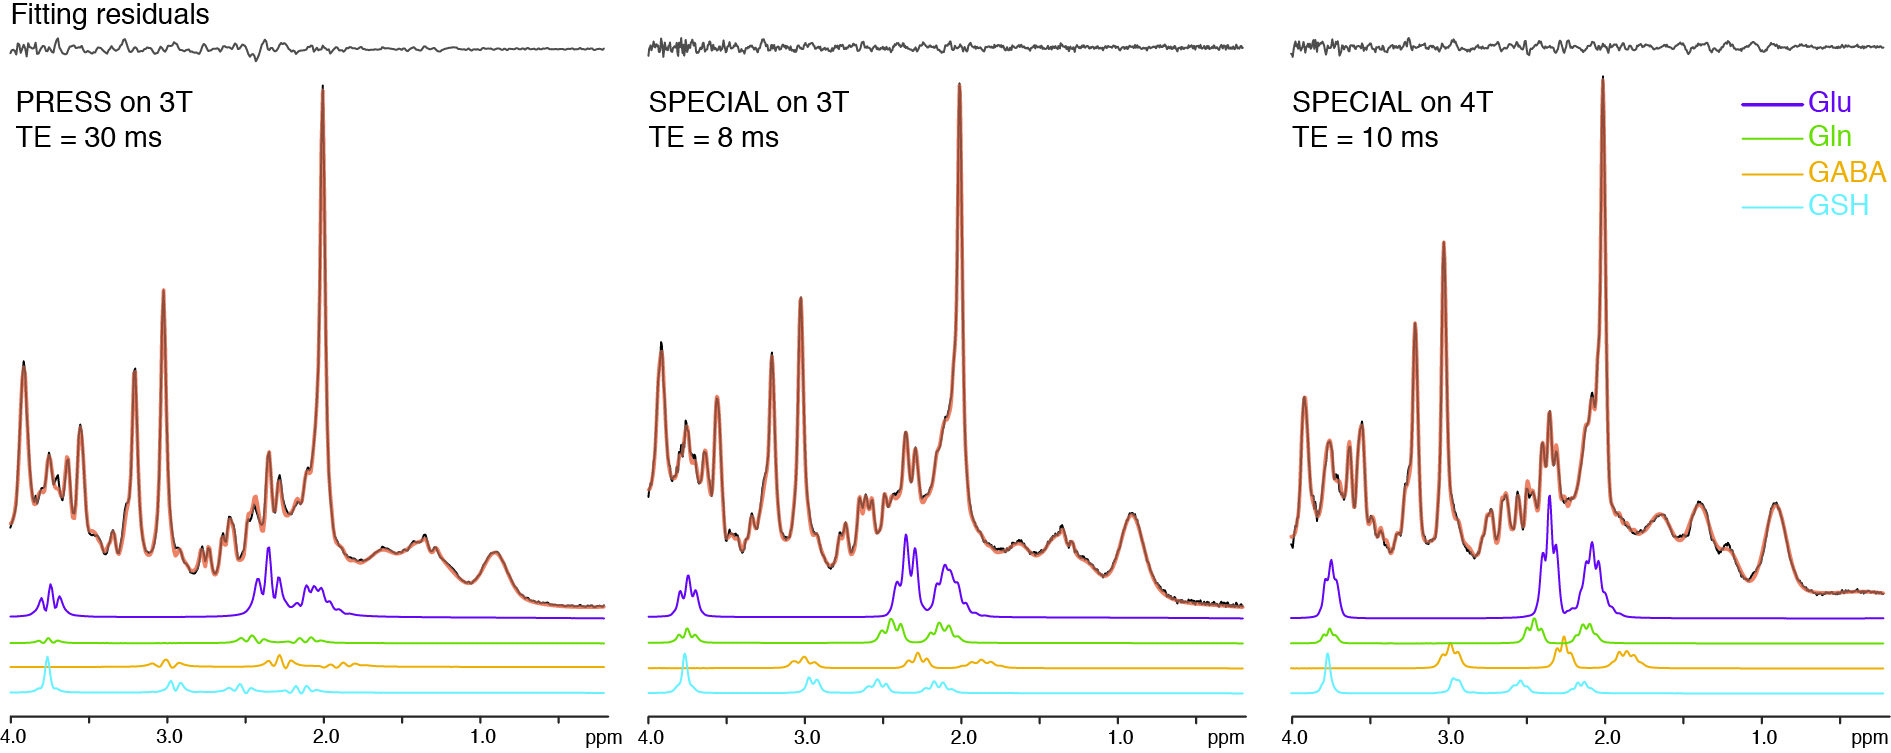
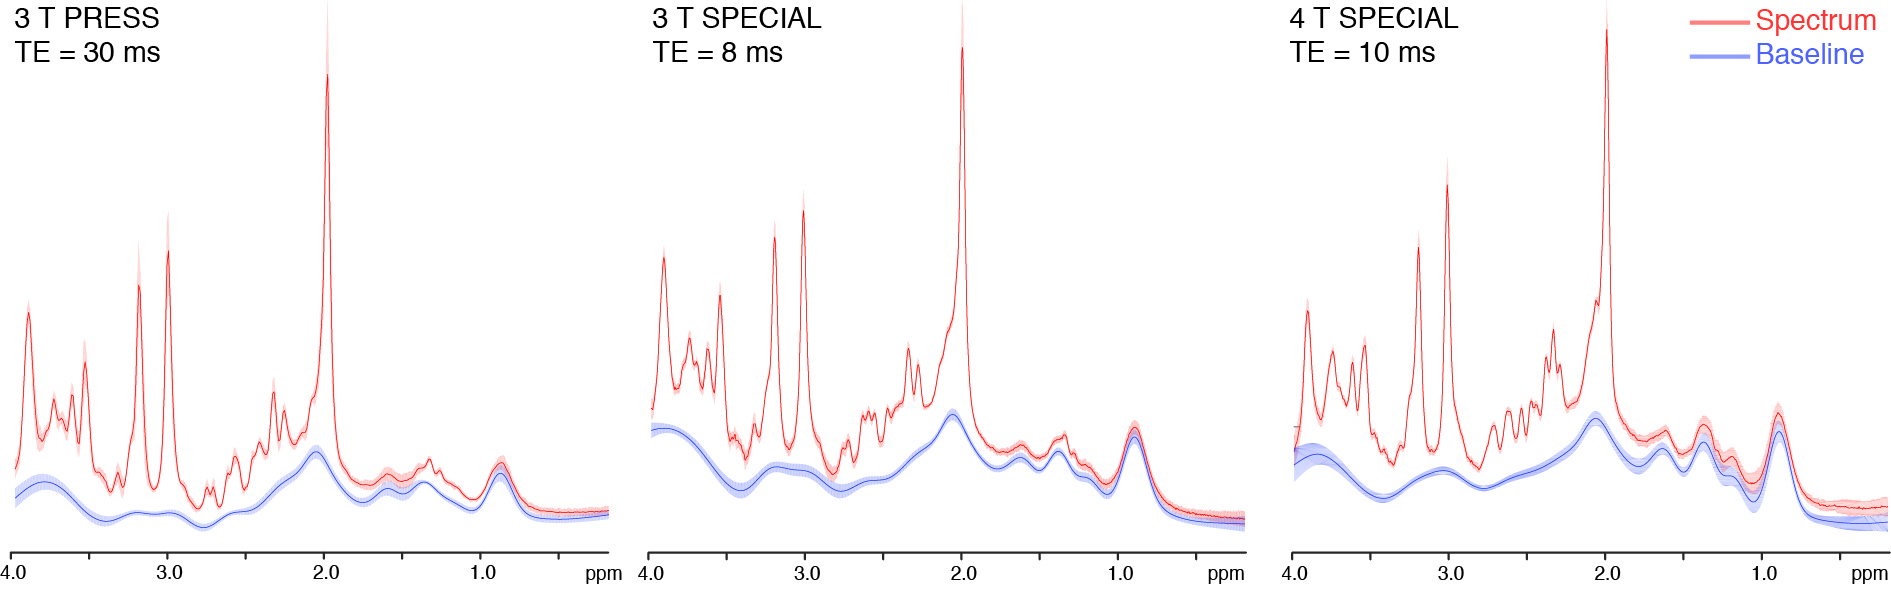
The presentative spectra of 3 T PRESS, 3 T SPECIAL, and 4 T SPECIAL were demonstrated in Fig. 1. The linewidths are 4.7 ± 1.4 Hz, 4.3 ± 0.7 Hz and 5.8 ± 1.0 Hz and the fitting residuals/signals measured by LCModel are 59 ± 4, 75 ± 15 and 61 ± 6 for 3 T PRESS, 3 T SPECIAL and 4 T SPECIAL respectively. Individual fitted spectra of Gln, GABA and GSH show more dispersive lineshapes caused by J modulations in PRESS than SPECIAL. Stability is the major concern of SPECIAL. Fig. 2 shows the means and SDs of spectra and baselines of all subjects of the three measurements. SPECIAL methods on 3 T and 4 T show good stability across different subjects comparable to that of PRESS.
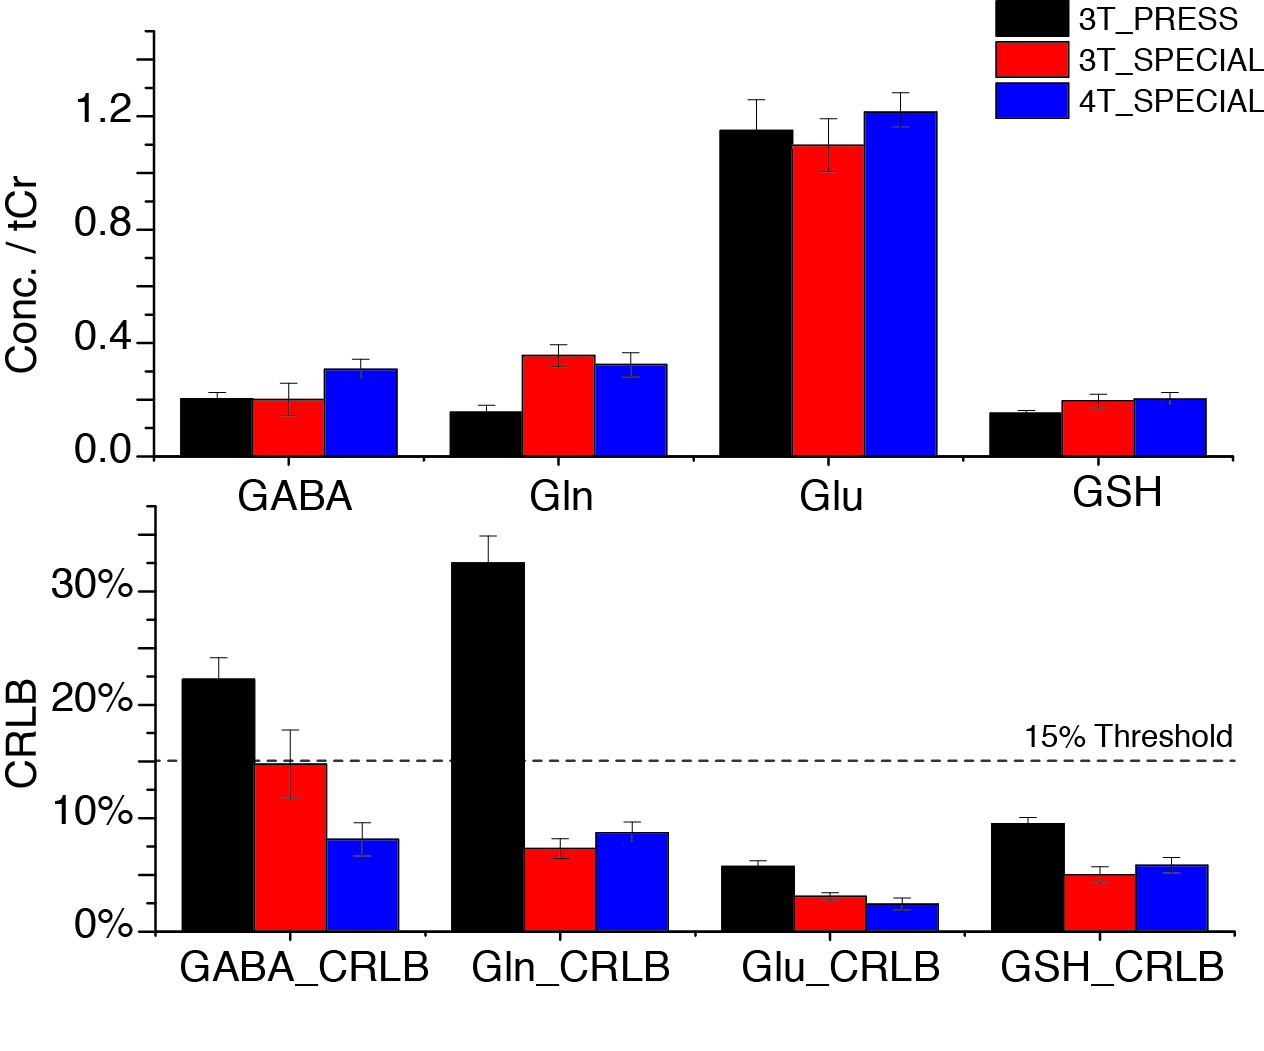
The quantification results were presented in Fig. 3. Total creatine (tCr) was used as reference because of potential inconsistent voxel locations and different coil penetrations (surface coil used at 4 T). Comparing the less 10% difference of Glu measurements with 3 methods, Gln measured by PRESS was only approximately half of the two SPECIAL measurements; GSH measured by PRESS was also 20% less than that of SPECIAL. These differences were also reflected by their CRLBs. The measures of Gln and GSH using SPECIAL on 3 T and 4 T were with consistent CRLBs, while GABA measured with 4 T SPECIAL was significantly higher than 3 T and with only half CRLBs of 3 T. Table 1 shows the averages and SDs of correlation terms between these compounds output by LCModel, which help to estimate the separation between metabolites during quantification. No negative correlation < -0.3, which was suggested in LCModel manual as the separation threshold, was observed between Glu, Gln, GABA and GSH. On the other hand, averaged correlation coefficients between NAA/NAAG greatly reduced to -0.42 on 4 T but still higher than -0.3.
Conclusion
In this study, we compared the Gln, GABA and GSH measurements of human brain using 3 T PRESS, 3 T SPECIAL and 4 T SPECIAL. SPECIAL on 3 T and 4 T observed consistent Gln and GSH concentrations with higher reliabilities compared to 3 T PRESS. 4 T SPECIAL detected higher GABA concentrations compared to the two 3 T measurements with significantly lower CRLB, however the contribution of macromolecules was not accounted for and further studies with experimental MM baseline are under work.Acknowledgements
No acknowledgement found.References
1. Sanaei Nezhad F, Anton A, Parkes LM, Deakin B, Williams SR. Quantification of glutathione in the human brain by MR spectroscopy at 3 Tesla: Comparison of PRESS and MEGA-PRESS. Magnetic resonance in medicine : official journal of the Society of Magnetic Resonance in Medicine / Society of Magnetic Resonance in Medicine 2016.
2. Terpstra M, Henry PG, Gruetter R. Measurement of reduced glutathione (GSH) in human brain using LCModel analysis of difference-edited spectra. Magnetic resonance in medicine : official journal of the Society of Magnetic Resonance in Medicine / Society of Magnetic Resonance in Medicine 2003;50(1):19-23.
3. Saleh MG, Oeltzschner G, Chan KL, Puts NA, Mikkelsen M, Schar M, Harris AD, Edden RA. Simultaneous edited MRS of GABA and glutathione. Neuroimage 2016.
4. Mescher M, Merkle H, Kirsch J, Garwood M, Gruetter R. Simultaneous in vivo spectral editing and water suppression. NMR Biomed 1998;11(6):266-272.
5. Hu J, Yang S, Xuan Y, Jiang Q, Yang Y, Haacke EM. Simultaneous detection of resolved glutamate, glutamine, and gamma-aminobutyric acid at 4 T. J Magn Reson 2007;185(2):204-213.
6. Terpstra M, Vaughan TJ, Ugurbil K, Lim KO, Schulz SC, Gruetter R. Validation of glutathione quantitation from STEAM spectra against edited 1H NMR spectroscopy at 4T: application to schizophrenia. Magma 2005;18(5):276-282.
7. Wijtenburg SA, Gaston FE, Spieker EA, Korenic SA, Kochunov P, Hong LE, Rowland LM. Reproducibility of phase rotation STEAM at 3T: focus on glutathione. Magnetic resonance in medicine : official journal of the Society of Magnetic Resonance in Medicine / Society of Magnetic Resonance in Medicine 2014;72(3):603-609.
8. Mlynarik V, Gambarota G, Frenkel H, Gruetter R. Localized short-echo-time proton MR spectroscopy with full signal-intensity acquisition. Magnetic resonance in medicine : official journal of the Society of Magnetic Resonance in Medicine / Society of Magnetic Resonance in Medicine 2006;56(5):965-970.
9. Simpson R, Devenyi GA, Jezzard P, Hennessy TJ, Near J. Advanced processing and simulation of MRS data using the FID appliance (FID-A)-An open source, MATLAB-based toolkit. Magnetic resonance in medicine : official journal of the Society of Magnetic Resonance in Medicine / Society of Magnetic Resonance in Medicine 2017;77(1):23-33.
10. Provencher SW. Automatic quantitation of localized in vivo 1H spectra with LCModel. NMR Biomed 2001;14(4):260-264.
Figures