3975
Scan Duration, Signal-To-Noise Ratio and Sample Size Considerations in GABA-Edited MRS Studies1Russell H. Morgan Department of Radiology and Radiological Science, The Johns Hopkins University School of Medicine, Baltimore, MD, United States, 2F. M. Kirby Research Center for Functional Brain Imaging, Kennedy Krieger Institute, Baltimore, MD, United States, 3Department of Radiology, University of Calgary, Calgary, AB, Canada, 4CAIR Program, Alberta Children's Hospital Research Institute and Hotchkiss Brain Institute, University of Calgary, Calgary, AB, Canada
Synopsis
We investigate the relationships between scan duration, signal-to-noise ratio (SNR) and group-level variance in GABA-edited MRS. Typically, GABA editing takes ~10 min for a 27-mL voxel. GABA+/Cr measurements from five voxels from 18 participants were analyzed by cumulatively binning the averages within each dataset to determine the effects on SNR and group-level variance. Sample size calculations estimated the required sample sizes needed for different predicted effect sizes in GABA-edited MRS studies. We show that the duration of GABA-edited acquisitions can be reduced if taking into account a statistically acceptable amount of group-level variance and the magnitudes of predicted effects.
Purpose
A GABA-edited MRS acquisition typically takes ~10 min for a 27-mL voxel (1,2) due to the inherently weak signal of GABA. However, there is increasing interest in limiting scan time for better participant compliance and to enable more measurements within a scan session (e.g., to measure GABA in more brain regions or to perform other MRI acquisitions). Here, we examine the relationships between scan duration, SNR and group-level variance in GABA-edited data to determine the limiting factors of signal averaging on reliable quantification. We also estimate the sample sizes needed to detect group differences of varying magnitudes as a function of SNR.Methods
Eighteen GABA-edited datasets were collected in vivo using MEGA-PRESS (3) on a 3T Philips Achieva scanner using a 32-channel head coil in voxels placed in the auditory cortex (AUD), dorsolateral prefrontal cortex (DLPFC), frontal eye field (FEF), occipital cortex (OCC) and sensorimotor cortex (SM). Voxels were 3×3×3 cm3, except the AUD voxel, which was 4×3×2 cm3. Acquisition parameters were: TE/TR = 68/2000 ms, 14-ms editing pulses (ON/OFF = 1.9/7.46 ppm), 320 averages (~10 min scan time), interleaving ON/OFF every 2 TRs, 2048 data points, 2 kHz spectral width.
Data were analyzed in Gannet (4). Due to excessive B0 field drift or participant head motion that could not be rectified with retrospective frequency/phase correction, 10 datasets were excluded from further analysis (2 AUD, 2 DLPFC, 1 FEF, 3 OCC, 2 SM). In the remaining datasets, up to 20 outlier averages were removed prior to averaging.
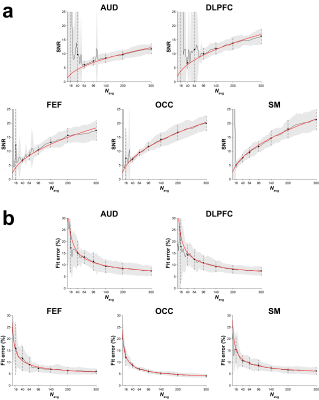
To test the SNR dependence of edited GABA measurements, for each dataset, difference spectra were generated by binning the first 4x averages successively, where 1 ≤ x ≤ 75. For consistency, only the first 300 (non-excluded) averages were considered for all datasets. For every difference spectrum, the GABA and Glx signals were fit with a three-Gaussian model and GABA+/Cr was quantified. SNR was measured as the ratio between the amplitude of the modeled GABA signal and twice the standard deviation of noise based on a recently reported algorithm (5). Fit error was calculated as the standard deviation of fit residuals normalized to modeled GABA signal amplitude.
Group-level variance in GABA+/Cr was measured as
the coefficient of variation (CV) at each signal-average bin. The relationship between number of averages and SNR was modeled using a
square-root function $$$a\sqrt{n}$$$. The relationship
between number of averages and fit error was modeled using an
inverse-square-root function $$$a\sqrt{n^{-1}}+b$$$,
where b accounts for the
error arising from imperfect modeling of the GABA signal. Based on the modeled
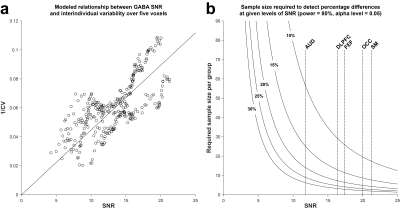
relationship between SNR and CV, sample sizes required for detecting group differences
of 10–30% in GABA+/Cr (power = 80%; alpha = 0.05) were calculated as a function
of SNR.
Results
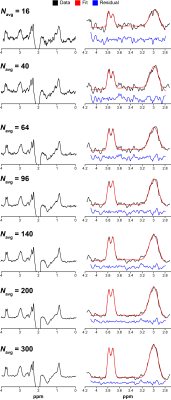
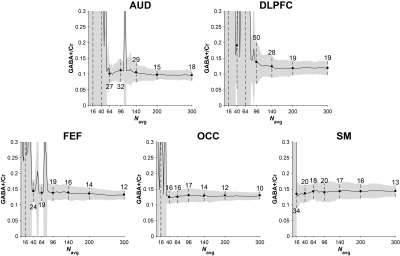
Fig. 1 shows GABA-edited difference spectra generated from 16, 40, 64, 96, 140, 200, and 300 binned averages in one example OCC dataset. Fig. 2 shows that the group CV of GABA+/Cr measurements tends to stabilize before the "full" dataset is acquired (10 min), but at a rate that varies across the five voxels. SNR (Fig. 3a) follows the predicted square-root law of signal averaging, and the fit error was well modeled by the inverse-square-root function (Fig. 3b). Fig. 4a suggests that SNR is linearly related to the inverse of CV. Based on this relationship, the group CV was predicted from SNR, and the sample size required to detect group differences of 10–30% in GABA+/Cr was calculated, as shown in Fig. 4b. In addition, we illustrate that the group-averaged SNR observed at 300 averages for each of the five voxels lies at different points along the SNR axis, providing empirical evidence that the required sample sizes are region-dependent.Discussion
Our results demonstrate that the 10-min acquisition/27-mL voxel rule-of-thumb need not be a hard-and-fast rule; it is possible to achieve reliable results with fewer averages. In essence, these findings form an empirical basis for more optimal study design in GABA-edited MRS. With reasonable a priori assumptions about predicted effect sizes and group-level variance, GABA editing can be an efficient and robust technique. For certain cohorts or study designs, the option to shorten measurements in a principled manner would be highly beneficial.Conclusion
While the number of signal averages required for GABA-edited MRS has typically been considered in terms of obtaining a specific SNR, it is more appropriate to think in terms of measurement error and the amount of group-level variance that provides sufficient statistical power to studies.Acknowledgements
This work was supported by NIH grants R21 NS077300, R01 EB016089, R01 NS096207 and P41 EB015909. RSL received salary funding from NSERC CREATE i3T and NAJP receives salary support from NIH grant K99 MH107719.References
1. Mullins PG, McGonigle DJ, O’Gorman RL, Puts NAJ, Vidyasagar R, Evans CJ, Cardiff Symposium on MRS of GABA, Edden RAE. Current practice in the use of MEGA-PRESS spectroscopy for the detection of GABA. Neuroimage 2014;86:43–52. doi: 10.1016/j.neuroimage.2012.12.004.
2. Puts NAJ, Edden RAE. In vivo magnetic resonance spectroscopy of GABA: A methodological review. Prog. Nucl. Magn. Reson. Spectrosc. 2012;60:29–41. doi: 10.1016/j.pnmrs.2011.06.001.
3. Mescher M, Merkle H, Kirsch J, Garwood M, Gruetter R. Simultaneous in vivo spectral editing and water suppression. NMR Biomed. 1998;11:266–272. doi: 10.1002/(SICI)1099-1492(199810)11:6<266::AID-NBM530>3.0.CO;2-J.
4. Edden RAE, Puts NAJ, Harris AD, Barker PB, Evans CJ. Gannet: A batch-processing tool for the quantitative analysis of gamma-aminobutyric acid-edited MR spectroscopy spectra. J. Magn. Reson. Imaging 2014;40:1445–1452. doi: 10.1002/jmri.24478.
5. Mikkelsen M, Barker PB, Bhattacharyya PK, et al. Big GABA: Edited MR spectroscopy at 24 research sites. Neuroimage 2017;159:32–45. doi: 10.1016/j.neuroimage.2017.07.021.
Figures


