3974
Multi-Step Frequency-and-Phase Correction for Multiplexed Edited MRS Data1Russell H. Morgan Department of Radiology and Radiological Science, The Johns Hopkins University School of Medicine, Baltimore, MD, United States, 2F. M. Kirby Research Center for Functional Brain Imaging, Kennedy Krieger Institute, Baltimore, MD, United States, 3Douglas Mental Health University Institute and Department of Psychiatry, McGill University, Montreal, QC, Canada, 4Department of Biomedical Engineering, The Johns Hopkins University School of Medicine, Baltimore, MD, United States, 5Shandong Medical Imaging Research Institute, Shandong University, Jinan, China, 6Department of Radiology, University of Calgary, Calgary, AB, Canada, 7Department of Radiology, Cincinnati Children's Hospital Medical Center, Cincinnati, OH, United States, 8Academic Unit of Radiology, University of Sheffield, Sheffield, United Kingdom
Synopsis
Multiplexed edited MRS – more than one edited experiment combined in a single acquisition – involves acquiring subspectra with four or more distinct signal profiles. This technique therefore requires a tailored approach for correcting frequency and phase errors associated with participant head motion and scanner instability. Here, we demonstrate a novel alignment algorithm, termed multi-step frequency-and-phase correction (msFPC), designed to deal with the challenges of aligning individual transients in multiplexed edited data. Testing this method on simulated and in vivo datasets, msFPC was found to outperform other previously demonstrated algorithms (spectral registration and spectral registration with post hoc choline-creatine alignment).
Purpose
Edited MRS of γ-aminobutyric acid (GABA) and glutathione (GSH) (1) requires frequency-and-phase correction (FPC) to avoid signal loss and subtraction artifacts (2). Hadamard encoding and reconstruction of MEGA-edited spectroscopy (HERMES) (3) – a multiplexed editing technique for simultaneous detection of two or more metabolites – presents a challenge for FPC algorithms as the four sub-experiments have distinct signal profiles that are difficult to align to each other using conventional algorithms. The purpose of this work is to develop an algorithm that provides reliable correction for such data.Methods
In GABA-/GSH-edited HERMES (4), four sub-experiments are performed (A, B, C and D), in which editing pulses are applied to: both GABA (at 1.9 ppm) and GSH (at 4.56 ppm) (A: ONGABA, ONGSH); GABA only (B: ONGABA, OFFGSH); GSH only (C: OFFGABA, ONGSH); or neither (D: OFFGABA, OFFGSH). The combinations (A + B – C – D) and (A – B + C – D) give GABA- and GSH-edited spectra, respectively.
Simulated in vivo HERMES data were generated using FID-A (5): 320 transients; TE = 80 ms; 2048 data points; 2 kHz spectral width. Gaussian noise was added to each free induction decay (FID) to approximate in vivo signal-to-noise ratios, with known frequency/phase offsets added as previously described (6). In vivo HERMES datasets from three imaging centers were also used (acquisition parameters as above except: TR = 2000 ms; 27- to 46.7-mL voxels).
Several FPC algorithms were compared against msFPC: no correction (NC); spectral registration (SR) (6); and spectral registration with post hoc choline- (Cho-) creatine (Cr) alignment (SR+CC) (4):
NC: No FPC of frequency/phase errors.
SR: Each mth FID Sm(t) is fitted to a reference R(t) by adjustment of its frequency (f) and phase (φ) using nonlinear least-squares minimization:
$$\arg\min\parallel R(t)-G_m(t,f,\phi)\parallel_2$$
where
$$G_m(t,f,\phi)=S_m(t)\exp[2\pi(ft+\phi/360)]$$
R(t) is chosen as the median across the number of FIDs. Global frequency/phase adjustment is also performed in the frequency domain by fitting a two-Lorentzian model to the Cho-Cr signals in the sum of all subspectra.
SR+CC: SR is implemented as above and then the averaged GSH-ON and GSH-OFF subspectra are aligned in the frequency domain. The Cho-Cr signals are shifted in frequency and phase until the standard deviation of the Cho subtraction artifact is minimized.
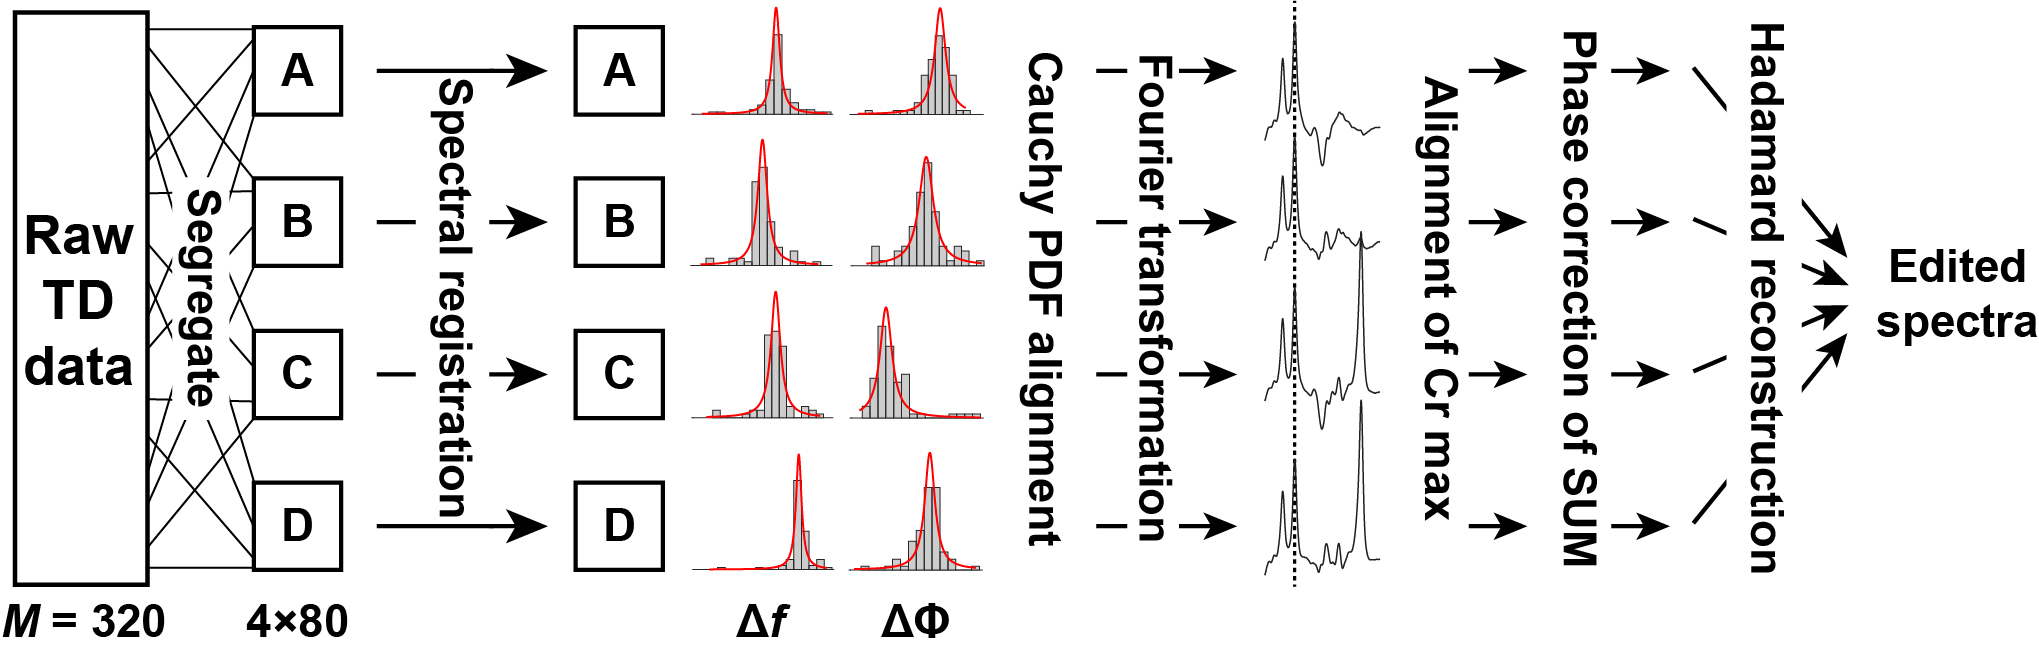
msFPC: msFPC (Fig. 1) involves segregating each dataset into its four sub-experiment sets Si,m(t), where i $$$\in$$$ {A, B, C, D}. The frequency/phase offsets in each set are estimated using SR as above. The distributions of frequency/phase offsets for each sub-experiment set are then modeled using a Cauchy probability density function. The center values of the Cauchy functions are subtracted from the respective set of estimated frequency/phase offsets, which are then applied to the uncorrected FIDs. The real frequency-domain Cr signal maxima are aligned to remove residual frequency errors. A Cho-Cr model is fitted to the sum spectrum to remove residual phase error.
Alignment quality in the simulated dataset was assessed by the normalized root sum square error Qrsse for each FPC algorithm:
$$Q_{rsse}=1-\sqrt{\frac{\sum(p_{est,m}-p_{true,m})^2}{\sum p_{true,m}^2}}$$
where py,m is either the estimated or true frequency offset, Δf, or phase offset, Δφ, of the mth FID. Qrsse = 1: perfect alignment; Qrsse < 0: worse alignment; Qrsse = 0: no alignment. Alignment quality in the in vivo datasets was assessed by an alignment quality metric Qpre/post based on subtraction artifacts in the pre-/post-alignment edited spectra:
$$Q_{pre}=1-\frac{\sigma(SA_{pre})-\sigma(\epsilon_{pre})}{med[\sigma(SA_{pre})]-\sigma(\epsilon_{pre})}$$
$$Q_{post}=1-\frac{\sigma(SA_{post})-\sigma(\epsilon_{post})}{med[\sigma(SA_{pre})]-\sigma(\epsilon_{post})}$$
where σ(SAy)
is the standard deviation of the Cho subtraction artifact pre- or post-alignment, σ(εy) is the standard deviation
of the noise signal and med denotes the median across the group. Median Qpost > 0: improved
alignment; median Qpost < 0: worse alignment;
Qpost = 1: complete removal of Cho subtraction artifact (noise
only).
Results
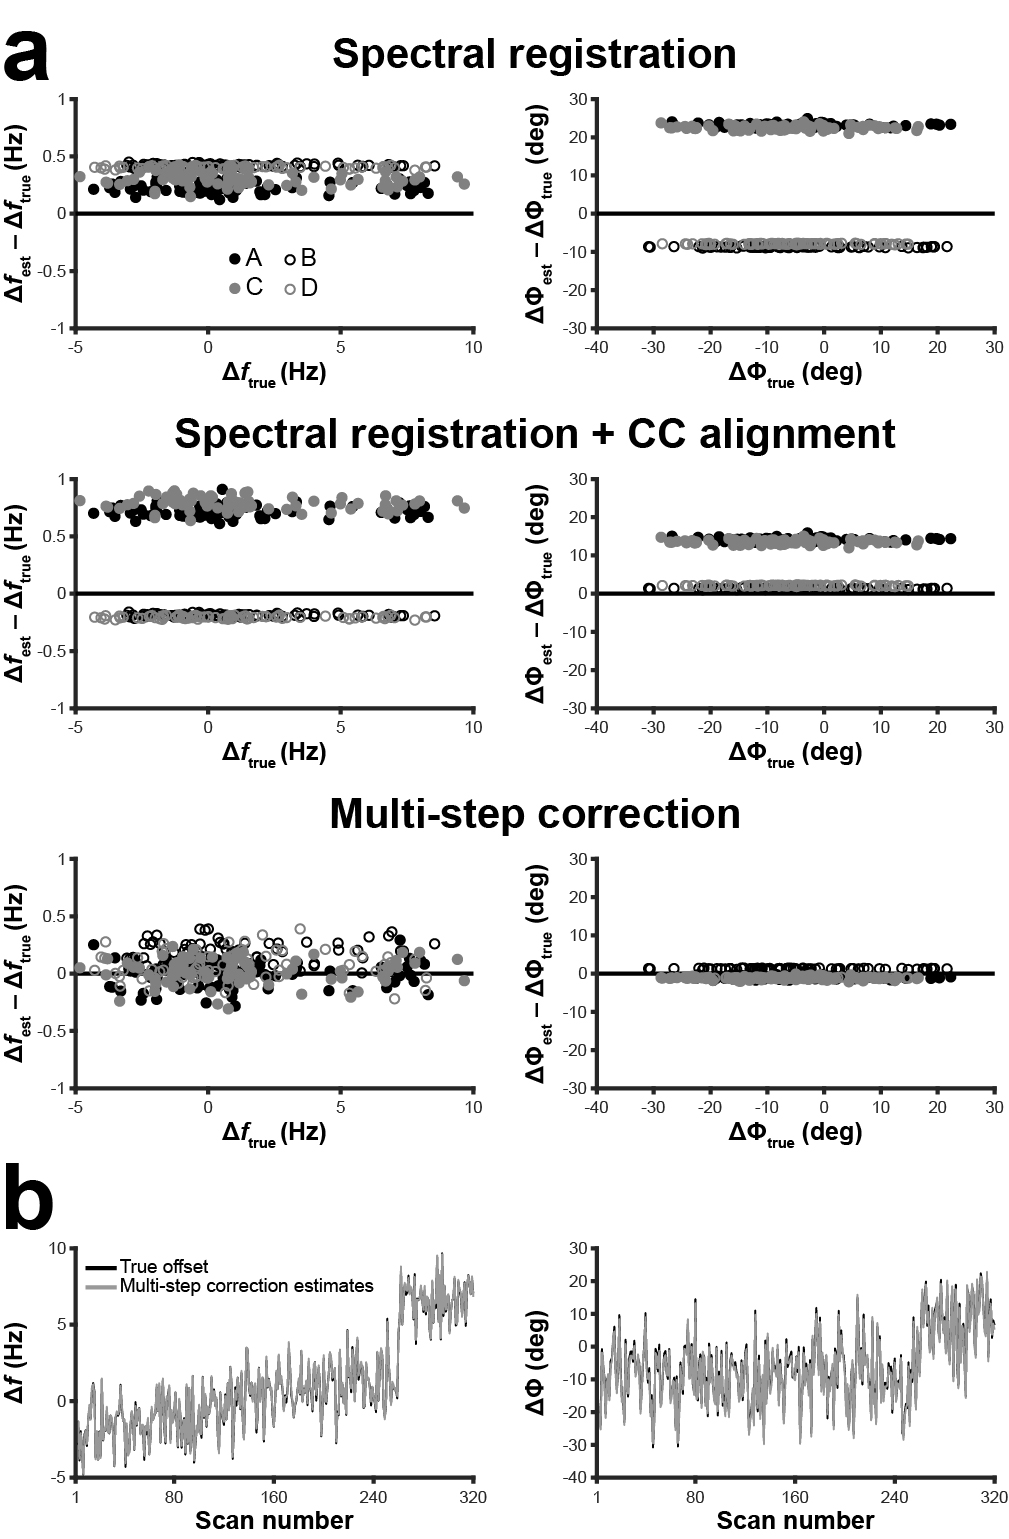
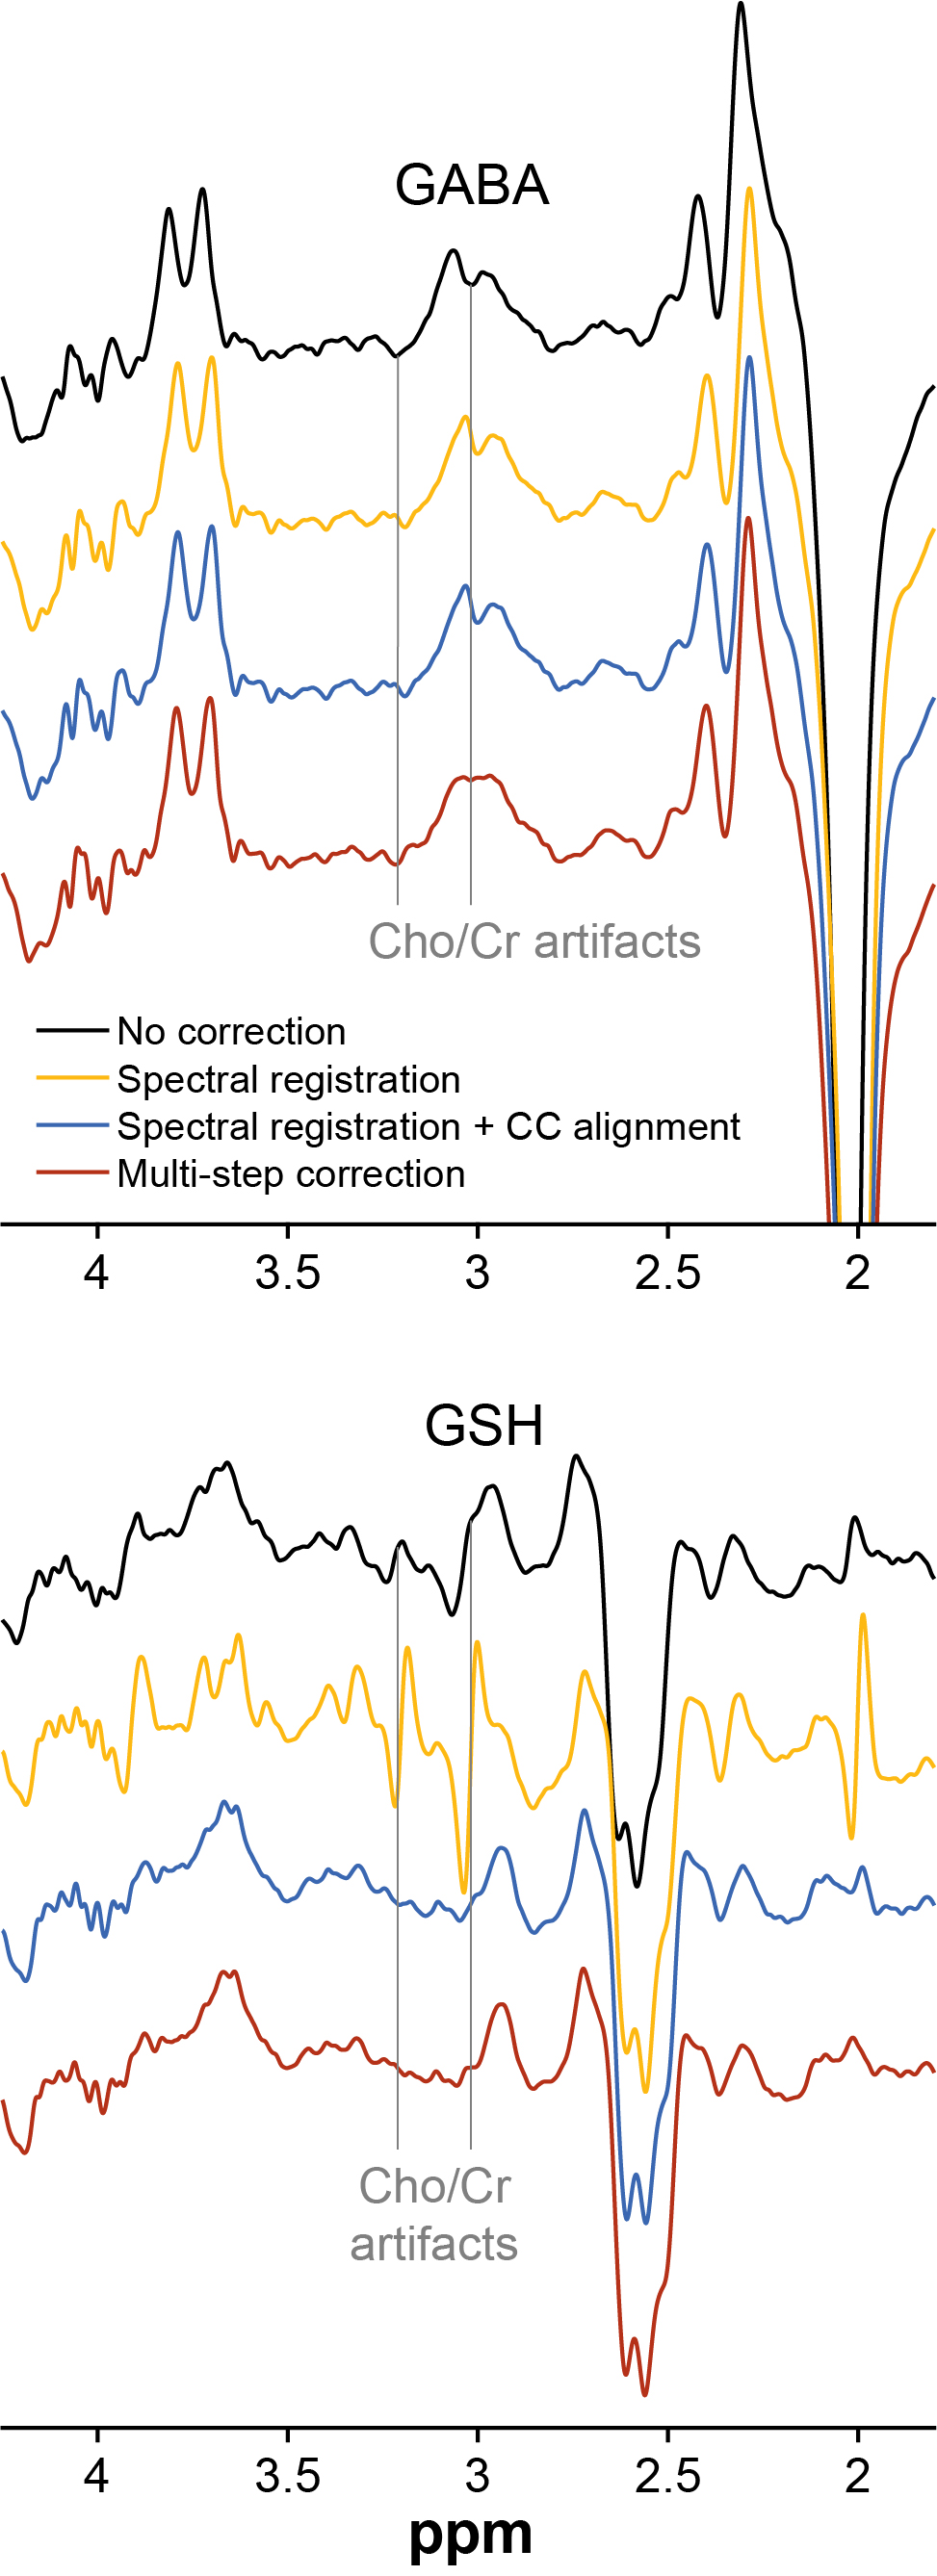
Qrsse scores for frequency/phase were 0.90/–0.37 for SR, 0.84/0.22 for SR+CC and 0.96/0.90 for msFPC. Fig. 2 shows modified Bland-Altman plots of the accuracy and systematic biases of each approach. Example in vivo GABA-/GSH-edited HERMES spectra aligned using each routine are shown in Fig. 3. Median Qpost scores were –0.15 (SR), –0.15 (SR+CC) and 0.69 (msFPC) for GABA-edited spectra and –20.27 (SR), –1.38 (SR+CC) and –0.18 (msFPC) for GSH-edited spectra.Discussion
msFPC outperforms conventional FPC algorithms for HERMES data. Conducting edited acquisitions in a multiplexed manner increases the challenge of retrospective FPC as this requires alignment of four or more distinct subspectra. msFPC approaches this challenge by treating each sub-experiment separately and using a probabilistic approach to align the subspectra.Conclusion
A multi-step spectral-registration-based alignment method has been shown to robustly correct frequency/phase errors in multiplexed GABA-/GSH-edited MRS data.Acknowledgements
This work was supported by NIH grants R01 EB016089, R01 EB023963, R01 MH106564, R01 NS096207, P41 EB015909 and R01 ES0277224. NAJP receives salary support from NIH grant K99 MH107719. IDW acknowledges support from the Wellcome Trust and NIHR Sheffield Biomedical Research Centre.References
1. Harris AD, Saleh MG, Edden RAE. Edited 1H magnetic resonance spectroscopy in vivo: Methods and metabolites. Magn. Reson. Med. 2017;77:1377–1389. doi: 10.1002/mrm.26619.
2. Harris AD, Glaubitz B, Near J, John Evans C, Puts NAJ, Schmidt-Wilcke T, Tegenthoff M, Barker PB, Edden RAE. Impact of frequency drift on gamma-aminobutyric acid-edited MR spectroscopy. Magn. Reson. Med. 2014;72:941–8. doi: 10.1002/mrm.25009.
3. Chan KL, Puts NAJ, Schär M, Barker PB, Edden RAE. HERMES: Hadamard encoding and reconstruction of MEGA-edited spectroscopy. Magn. Reson. Med. 2016;76:11–19. doi: 10.1002/mrm.26233.
4. Saleh MG, Oeltzschner G, Chan KL, Puts NAJ, Mikkelsen M, Schär M, Harris AD, Edden RAE. Simultaneous edited MRS of GABA and glutathione. Neuroimage 2016;142:576–582. doi: 10.1016/j.neuroimage.2016.07.056.
5. Simpson R, Devenyi GA, Jezzard P, Hennessy TJ, Near J. Advanced processing and simulation of MRS data using the FID appliance (FID-A)-An open source, MATLAB-based toolkit. Magn. Reson. Med. 2017;77:23–33. doi: 10.1002/mrm.26091.
6. Near J, Edden R, Evans CJ, Paquin R, Harris A, Jezzard P. Frequency and phase drift correction of magnetic resonance spectroscopy data by spectral registration in the time domain. Magn. Reson. Med. 2015;73:44–50. doi: 10.1002/mrm.25094.
Figures