3973
High Spatial Resolution Simulated Basis Sets for HERMES and MEGA-PRESS1Neuroimaging, King's College London, London, United Kingdom
Synopsis
Low concentration metabolites with J-coupled peaks are difficult to quantify using MRS, even using MEGA-PRESS or its recently propose HERMES implementation. Using LCModel with simulated basis sets can lead to inaccurate metabolite quantification, since the spatial-dependence of the signal is often not fully accounted for. This can be minimised by increasing the number of spatial positions simulated, at the expense of computation time. We simulated basis sets for MEGA-PRESS and HERMES using the recently introduced approach based on one-dimension projections, as a replacement for the commonly used three-dimensional method, providing more accurate basis sets in shorter computation time.
Introduction
Non-invasive evaluation of brain metabolites using magnetic resonance spectroscopy (MRS) is challenging, in both clinical and preclinical research. This is particularly so for low concentration metabolites, where J-coupling leads to peak-splitting and overlap with peaks from other metabolites. Recent work on spectral editing methods, such as the recently introduced HERMES1 editing scheme for MEGA-PRESS allows better discrimination and quantification of otherwise unresolvable metabolites. Software tools like VeSPA2 and FID-A3 allow simulated basis sets to be calculated relatively easily. Such simulations typically don’t fully account for the spatial dependence of the signal, being calculated either for a single point, or for a limited number of spatial points in 2D, only simulating the spatial dependence of the refocusing pulses. Zhang4 introduced a method of converting the 3D problem into three sequential 1D problems, treating the three RF pulses in the PRESS sequence in turn, averaging the density matrix after each step. We implemented this method to calculate basis sets for HERMES data. The hypothesis we tested was whether the implementation of density matrix simulations (based on one-dimension projection) for a high number of spatial positions yields significant quantitation improvements, compared to conventional single-point numerical simulations used in HERMES and MEGA-PRESS measurements of GABA.Methods
A HERMES acquisition sequence was implemented on a 3T MR750 General Electric scanner. LCModel was used to quantify the edited signal, after pre-processing with a FID-A3 based pipeline. Data from six healthy volunteers (mean(sd) age=34(10) years) were acquired (TR=2s, TE=80ms, 352 averages) and fitted using basis sets simulated for 1×1×1 (excitation×refocusing1×refocusing2), 1×17×17 and 201×201×201 spatial positions. Three steps were applied to create each basis set: a) simulation of excitation pulse (and gradients) followed by spin evolution and calculation of the average density matrix, b) simulation of first refocusing and editing pulses (and gradients), along with spin evolution for each spatial position, followed by calculation of the average density matrix, c) simulation of second refocusing and editing pulses (and gradients) and spin evolution for each spatial position, and the averaged density matrix calculated. For steps b) and c) the averaged density matrix from previous step was used as starting point for all positions simulated. A 1×17×17 simulation was also performed using the conventional 3D approach, for comparison.
The goodness of fit for results from each basis set was estimated as the standard deviation of the LCModel fit residual from 2.12 – 3.86 ppm divided by the height of the NAA peak. These were compared between the 201×201×201 point and single point basis sets using a paired t-test.
Results
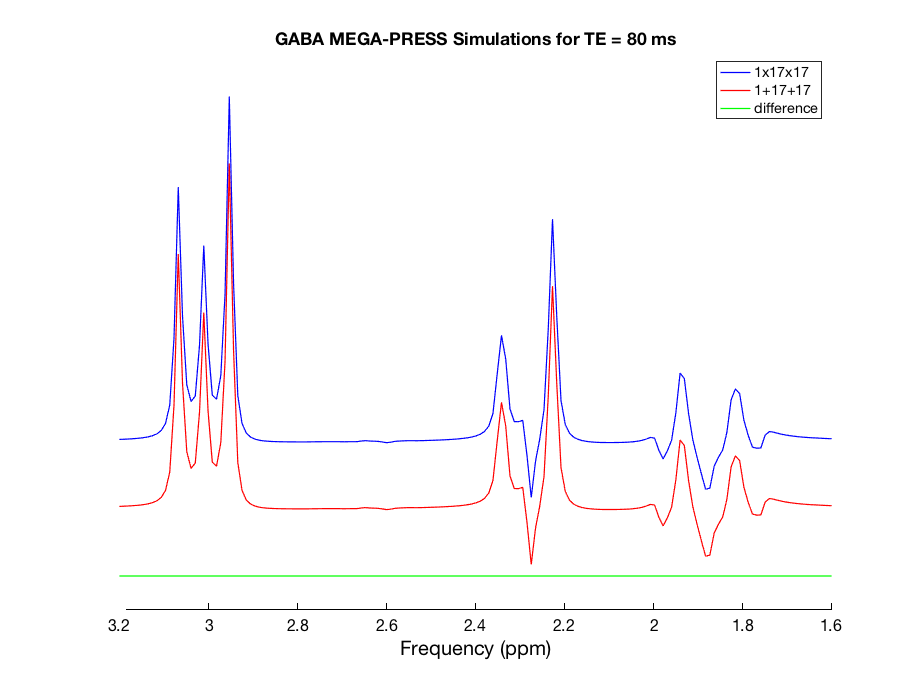
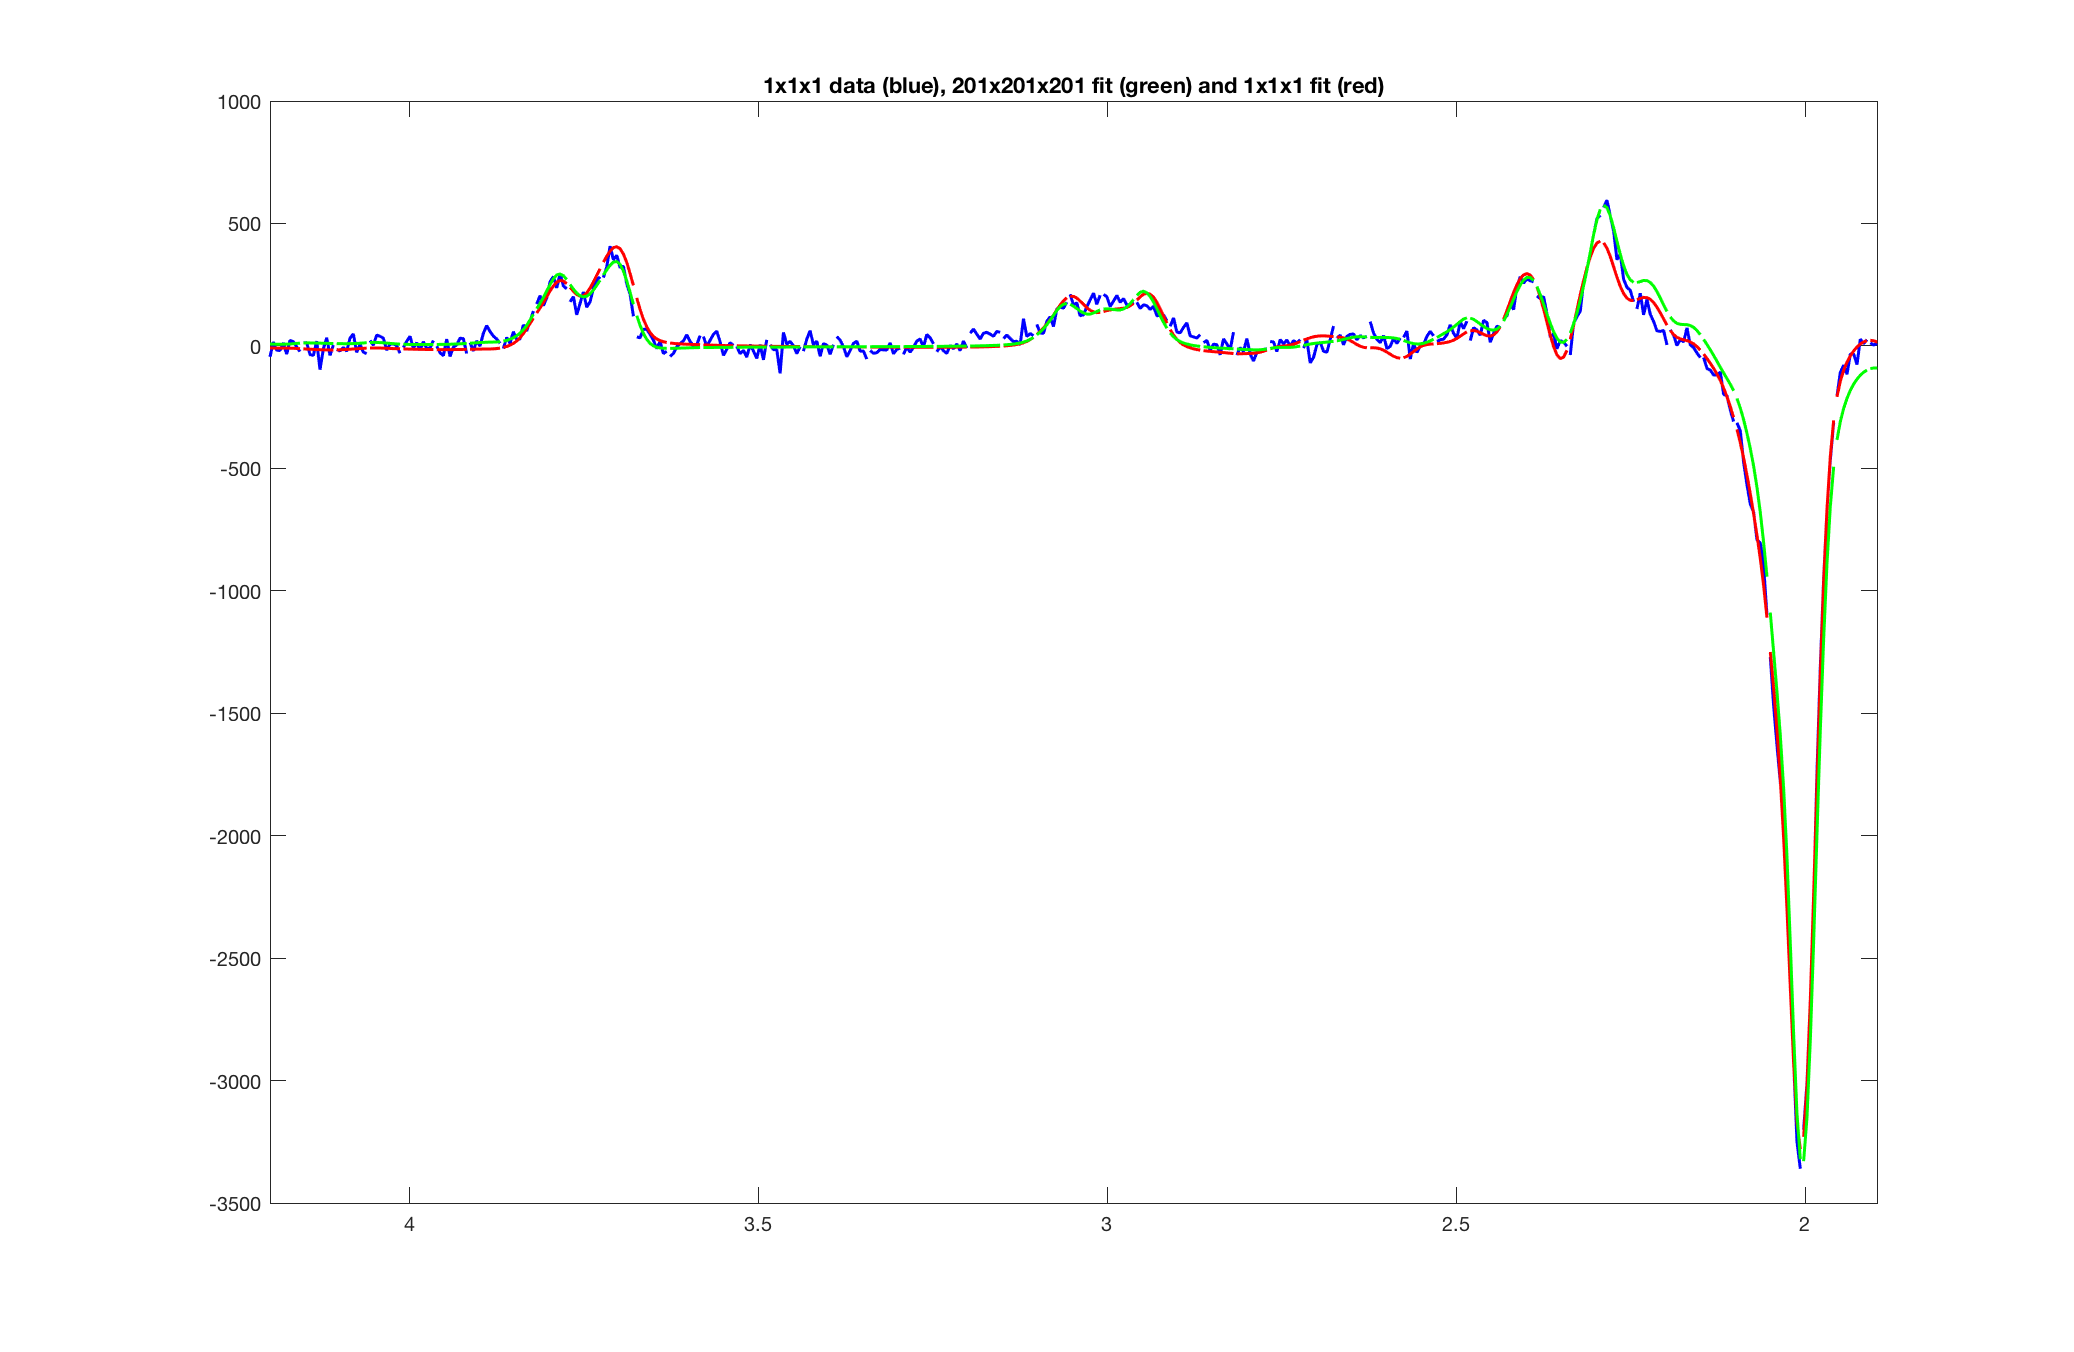
Figure 1 shows the results of the 1×17×17 HERMES simulation for GABA for TE = 80 ms, using the conventional approach of simulating each sub-voxel individually and using Zhang’s 1D projection method. The difference between the two simulations is also shown. Figure 2 shows examples of the LCModel fits for GABA using a basis set simulated at the centre of the voxel, compared with using a basis set simulated for 201×201×201 locations, using 1D projections.
For the basis set comparisons, the goodness of fit measures for the 201×201×201 and single point basis sets were (mean(sd)) 0.0131(0.0022) and 0.0164(0.0019) respectively (p=0.00004).
Discussion
Zhang4 previously implemented a method to speed up calculation of MRS basis sets for PRESS and TE-averaged PRESS. We successfully implemented their method using FID-A in Matlab to calculate basis sets for GABA and GSH (not reported here) difference spectra from HERMES MEGA-PRESS. There was no difference between basis sets calculated using Zhang’s method and the more traditional approach. The basis set calculated over 201×201×201 spatial locations improved the accuracy of LCModel fits compared with calculating the basis set from a single position.
Using Zhang’s method allows a massive speed-up in performing MRS simulations. Use of an accessible language like Matlab, allows the method to be implemented without recourse to lower level languages like C++ and the GAMMA library. The only drawback with the method is that information on spatial position is lost, which may be important when studying the effects of chemical shift displacement error.
Conclusion
We successfully implemented the HERMES MEGA-PRESS scheme on a GE scanner, along with simulations of basis sets for LCModel analysis. Basis sets were calculated in 18 hours, compared with an estimate of several months using the conventional approach. Zhang’s method, applied to MEGA-PRESS and HERMES led to improved LCModel fitting of the difference spectrum. Future work will extend of the acquisition to other metabolites.Acknowledgements
No acknowledgement found.References
1. Chan KL, Saleh MG, Oeltzschner G, Barker PB & Edden RAE, Simultaneous measurement of Aspartate, NAA, and NAAG using HERMES spectral editing at 3 Tesla, Neuroimage, 2017, 155, 587–593.
2. VeSPA Simulation Library: http://scion.duhs.duke.edu/vespa/
3. Simpson R, Devenyi GA, Jezzard P, Hennessy TJ & Near J, Advanced Processing and Simulation of MRS Data Using the FID Appliance (FID-A)—An Open Source, MATLAB-Based Toolkit, Magn Reson Med, 2017, 77, 23–33.
4. Zhang Y, An L & Shen J, Full density simulation of spatially localised magnetic resonance spectroscopy for multi-spin systems, Proceedings of the 25th Annual Meeting of the ISMRM, 2017, 5488.
Figures