3970
Simulations of MEGA-PRESS spectra to achieve quality criteria for GABA quantificationHelge Jörn Zöllner1,2, Alfons Schnitzler1, and Hans-Jörg Wittsack2
1Institute of Clincial Neuroscience and Medical Psychology, Heinrich Heine University, Düsseldorf, Germany, 2Department of Diagnostic and Interventional Radiology, Heinrich Heine University, Düsseldorf, Germany
Synopsis
The purpose of this study was to investigate the influence of diminished spectral quality on GABA quantification by using MEGA-PRESS simulations. Different levels of spectral quality were created by adding artificial noise and line broadening to a simulated spectrum to mimic shimming quality. Initial results revealed that the impact of signal to noise ratio (SNR) is much higher than the impact of line broadening. Furthermore the error of peak fitting does not seem to reflect the real quantification error of the known GABA levels of the simulated spectrum. Further simulations and analyses are needed to assure these initial results.
Introduction
The purpose of this study was to investigate the influence of spectral quality by means of signal to noise ratio and peak line widths on GABA quantification in MEGA-PRESS1 investigations. Initial results of an ongoing simulation study are presented.Methods
An artificial noise-free MEGA-PRESS spectrum with known metabolite concentrations based on in vivo results was created. This spectrum was manipulated by adding 40 different levels of random noise in the range of 0 - 300 % [noise SD as percentage of NAAmax signal] and by line broadening from 0 - 40 Hz. The line broadening was used to mimic different shimming quality of the spectra. Overall 701 different conditions of noise levels and line broadening were used to simulate 250 spectra for each condition. In addition, in vivo typical frequency- and phasedrifts were added to create realistic spectra2. The simulated spectra were analyzed by GANNET 2.03, including phase and frequency correction. The resulting GABA concentrations of these simulated spectra were compared to the known concentrations of the model spectrum. Further, common quality metrics4 like Creatine linewidth and the GABA fit error were investigated.Results
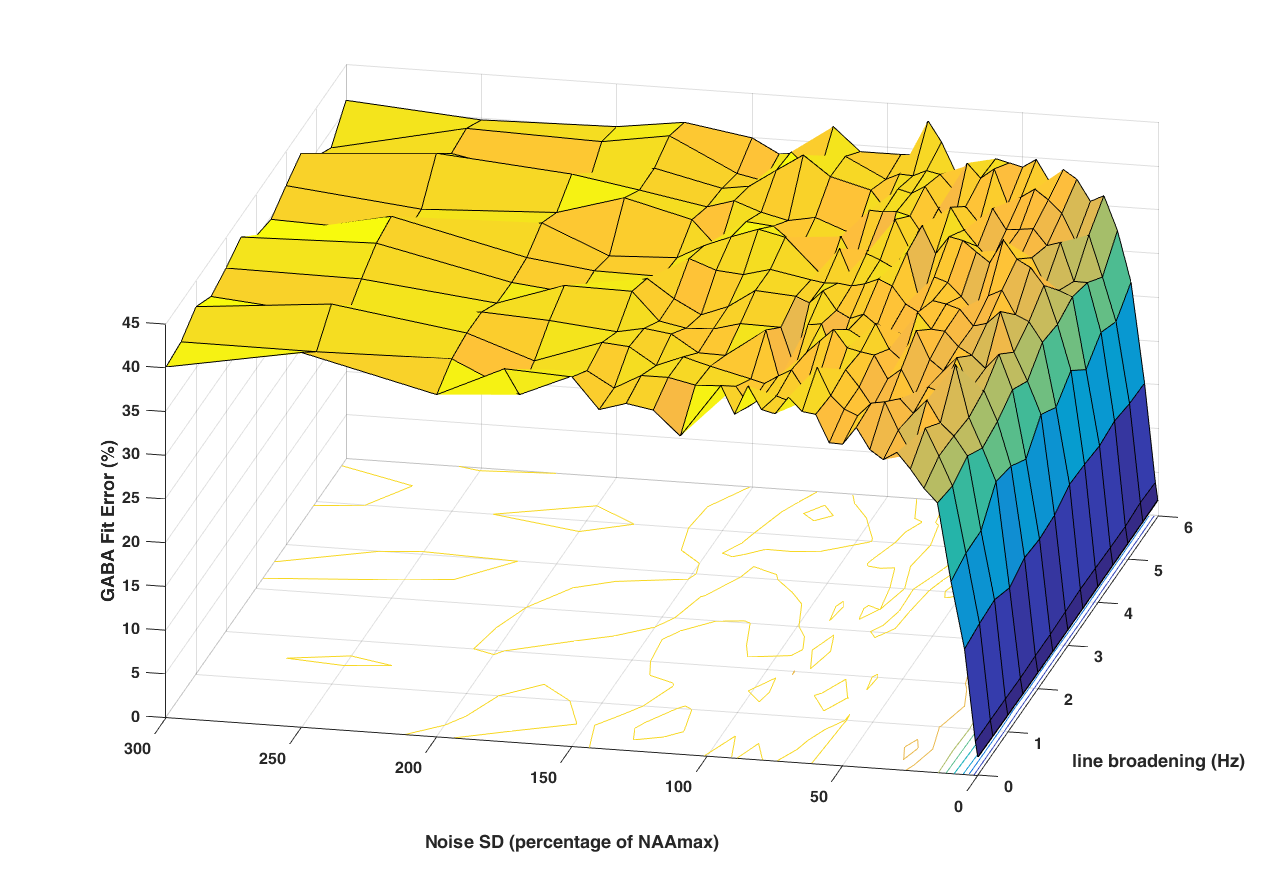
Line broadening >6 Hz lead to unreasonable Creatine linewidth compared to in vivo. Therefore, only spectra below this threshold were investigated further. Figure 1 depicts surface plots of the median Creatine linewidth in dependence of different noise levels and line broadening values. For noise levels above 100 the effect of line broadening is diminished. Figure 2 shows the relation between the median GABA fit error and the amount of added noise. The GABA fitting error increases rapidly above noise levels of 5 % of NAAmax. The median of the deviation from the artificial GABA area, which is the real quantification error, is displayed in figure 3 versus noise level and line broadening. The different characteristics compared to the fitting error are obvious as the real quantification error increases linear with the added noise. Noise levels between 0 and 50 % of NAAmax lead to quantification errors of about 50 %. Figure 4 shows the deviation from the artificial GABA area without line broadening at different noise levels. At noise levels >5 % of NAAmax the GABA quantification becomes unreliable due to large scattering.Discussion
The simulations were designed to determine the minimum needed SNR and spectral quality in MEGA-PRESS spectroscopy. The impact of SNR seems higher compared to the effect of line broadening on the measured GABA areas. This fact is in line with the commonly used voxel size of 27 ml and the high number of averages needed in MEGA-PRESS spectroscopy. At least a linewidth of 18 Hz should be achieved for Creatine to allow a reasonable GABA quantification. Interestingly, the fitting error seemed not to represent a measure for the real quantification error from our initial results. This may be due to the investigated range of noise levels, which were initially chosen to investigate a broad range of SNR. Further simulations will be performed at noise levels of around 1% of NAAmax to confirm our initial results.Conclusion
Usually, the spectral quality of MRS data sets is judged by the Creatine linewidth and the fitting error. Our simulations suggest that these parameters do not reflect the real quantification error directly. Further detailed simulations are needed to determine other possible quality criteria for GABA quantification. As soon as the simulations are completed, it should be possible to define concrete thresholds of shimming quality and signal to noise ratio for reliable GABA MRS.Acknowledgements
This study was supported by the Sonderforschungsbereich (SFB) 974 (TP B07) of the Deutsche Forschungsgemeinschaft (DFG).References
- Mescher M, Merkle H, Kirsch J, Garwood M, Gruetter R. Simultaneous in vivo spectral editing and water suppression. NMR Biomed. 1998;11(6):266-272.
- Harris AD, Glaubitz B, Near J, et al. The Impact of Frequency Drift on GABA-Edited MR Spectroscopy. Magn Reson Med. 2014;72(4):941-948. doi:10.1002/mrm.25009.
- Edden RAE, Puts NAJ, Harris AD, Barker PB, Evans CJ. Gannet: A batch-processing tool for the quantitative analysis of gamma-aminobutyric acid–edited MR spectroscopy spectra. J Magn Reson imaging JMRI. 2014;40(6):1445-1452.
- Slotboom J, Nirkko A, Brekenfeld C, Ormondt D van. Reliability testing of in vivo magnetic resonance spectroscopy (MRS) signals and signal artifact reduction by order statistic filtering. Meas Sci Technol. 2009;20(10):104030. doi:10.1088/0957-0233/20/10/104030.
Figures
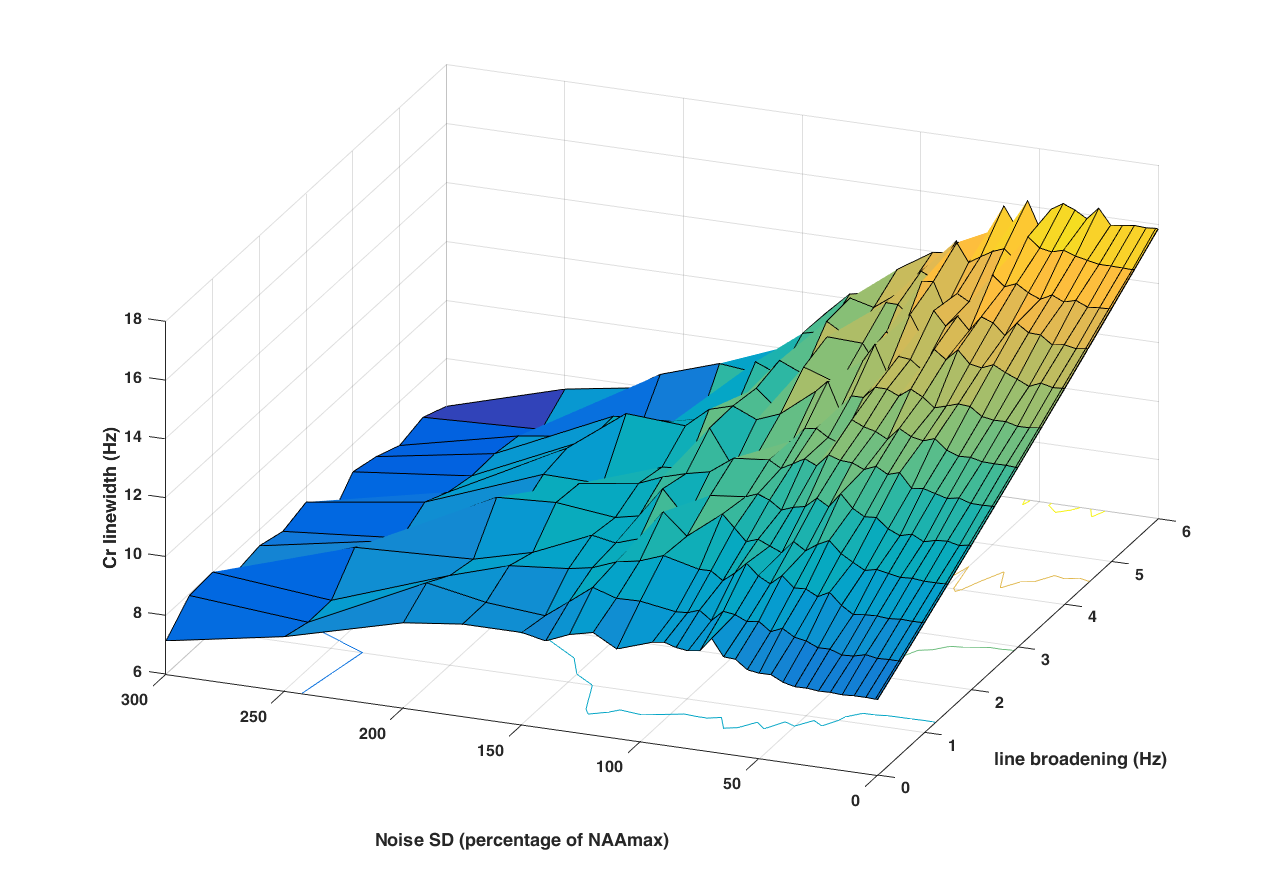
Median Creatine linewidth (Hz) of all different conditions.
Median
GABA Fit Error (%) of all different simulation conditions.
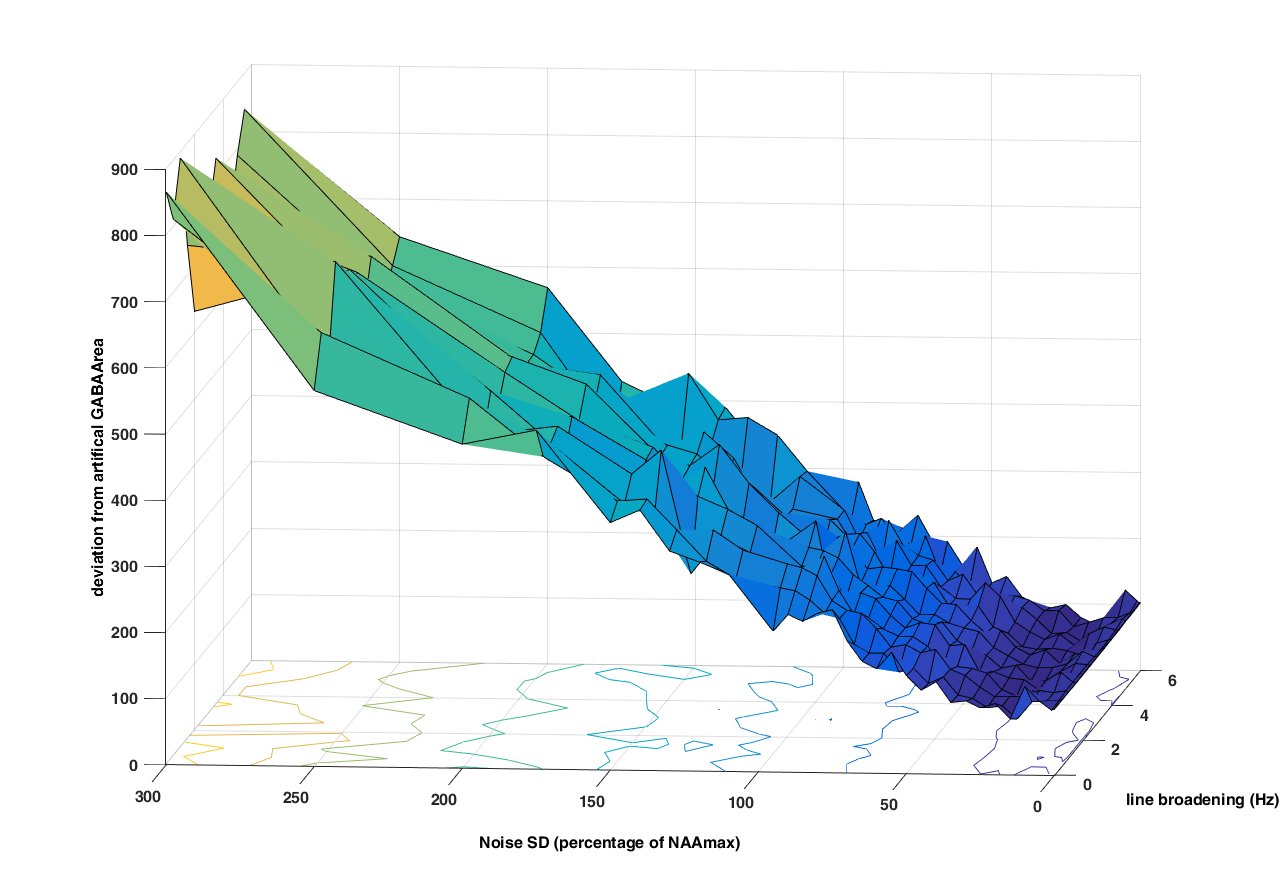
Deviation from artificial GABAArea of all different simulation
conditions.
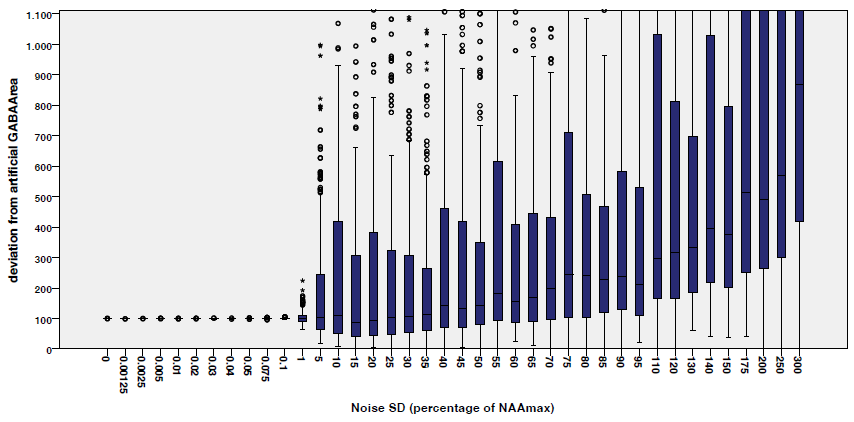
Deviation from artificial GABAArea at a fixed line
broadening value of 0 Hz and various noise levels.