3969
Towards repeatable GABA-MRS of the hippocampus: Development of an extended post-processing pipeline1German Center for Neurodegenerative Diseases (DZNE), Bonn, Germany, 2Neuroradiology, Radiology, University Clinic Bonn, Bonn, Germany, 3Department of Physics and Astronomy, University Bonn, Bonn, Germany
Synopsis
The low concentration and the overlap with more prominent resonances hamper the GABA quantification via MR spectroscopy. Strong B0 inhomogeneities in the hippocampus further impede reliable spectroscopic measurements.
To increase the repeatability of the GABA quantification we developed a post-processing module for MEGA-sLASER measurements.The development of an optimized post-processing module reduces the coefficient of variation of the intra-session GABA/creatine signal ratio to (5-10)%. This is essential for clinical trials.
Purpose
GABA is the principle inhibitory neurotransmitter of the human brain. Therefore, the GABA concentration is an interesting biomarker for a wide variety of neurological and psychological diseases. However, the low concentration and the overlap with more prominent resonances hamper the GABA quantification via MR spectroscopy.
Using J-editing spectroscopy the GABA signal can be separated from the overlapping resonances. While MEGA-PRESS is the standard sequence for 3T studies, we use an adiabatic MEGA-sLASER1 sequence to overcome the severe chemical shift artifacts at ultra-high field. The hippocampus plays an important role in the early stages of neuro-degenerative diseases, such as Alzheimer's. Strong B0 inhomogeneities impede reliable spectroscopic measurements. We expect the increased SNR of 7T to be beneficial for this region.
To increase the repeatability of the GABA quantification we developed an extended post-processing pipeline, including spectral registration2, difference artifact suppression and line shape correction3.
Methods
Experiments were performed in two healthy volunteers on a 7T scanner (Siemens Healtheneers) using a 32-channel head coil (Nova Medical). Per session three separate MEGA-sLASER measurements were performed (including 1 water reference, 4 preparation scans, 64 averages, TR=7s, 8:03 min scan time) and the GABA/creatine signal ratios were calculated for each measurement. The intra-session GABA/creatine coefficient of variation (GCR-CoV) was used as a metric of repeatability.
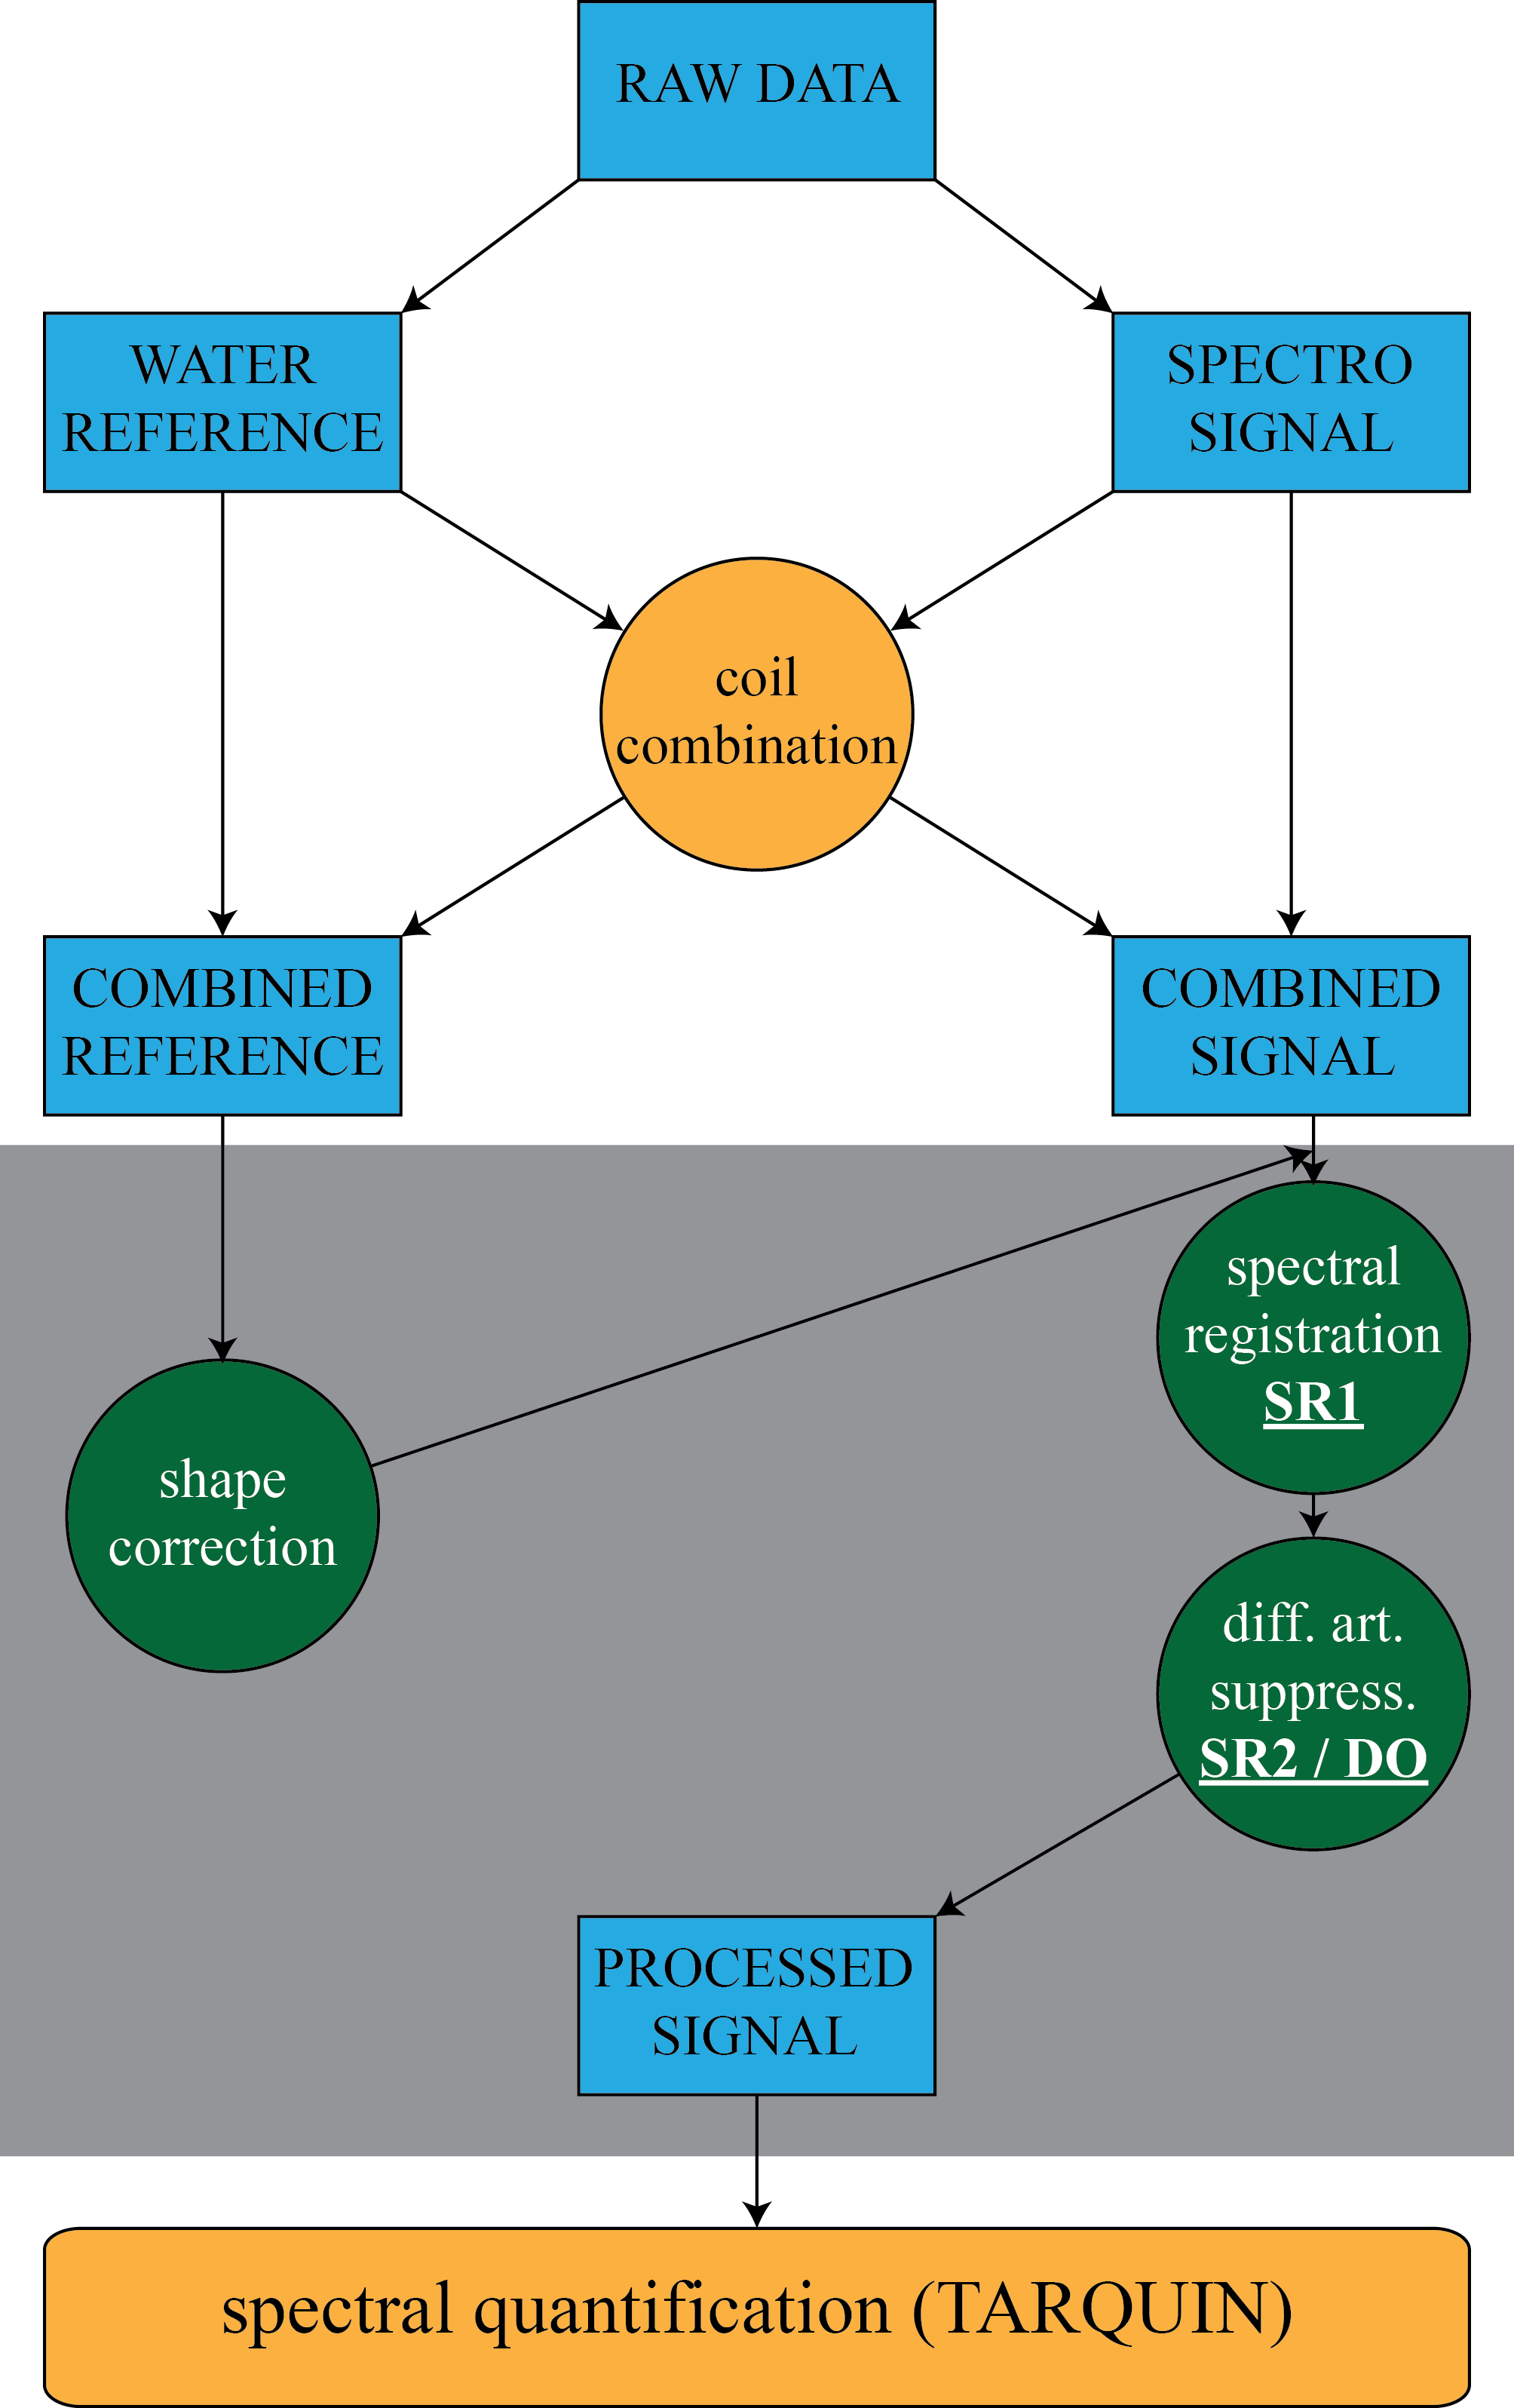
The flow-chart in figure 1 shows the complete analysis routine. After adaptively optimized coil-combination⁴ a dedicated post-processing module is applied. Finally, quantification is performed with TARQUIN⁵.We tested various options to find the optimal post-processing for routine for hippocampus GABA spectroscopy.
The first step in the post-processing pipeline is line shape correction. The decay function of the water FID is calculated. This decay function can be used to correct for line shape distortion and to obtain a Voigt shaped water resonance. The same correction function is applied to the spectroscopic signal.
Afterwards, spectral registration is performed, called SR1 from now on. Every single average gets phase and frequency corrected. Minimizing the difference between the corrected signal and a reference reduces the effect of field variations. We compared three different references for SR1: Roff, the mean of the unregistered off-FIDs; Rind the averaged on- and off-FIDs during the respective registration; Rspec, only signal from the spectral regime, that contains most of the spectroscopic signal (1.5-3.5 ppm) during individual registration.
In a third step difference artifact suppression is performed. We compared two algorithms. Our own implementation, which uses the spectral registration framework to perform an alignment of the on- and off-signal. Therefore we call the method spectral registration (SR2). The spectral regime between 2.8-3.5 ppm is selected which is dominated by the choline and creatine signals and thus has minimal differences between on- and off-signals. For comparison we implemented the recently published difference optimization (DO) method⁶.
Results
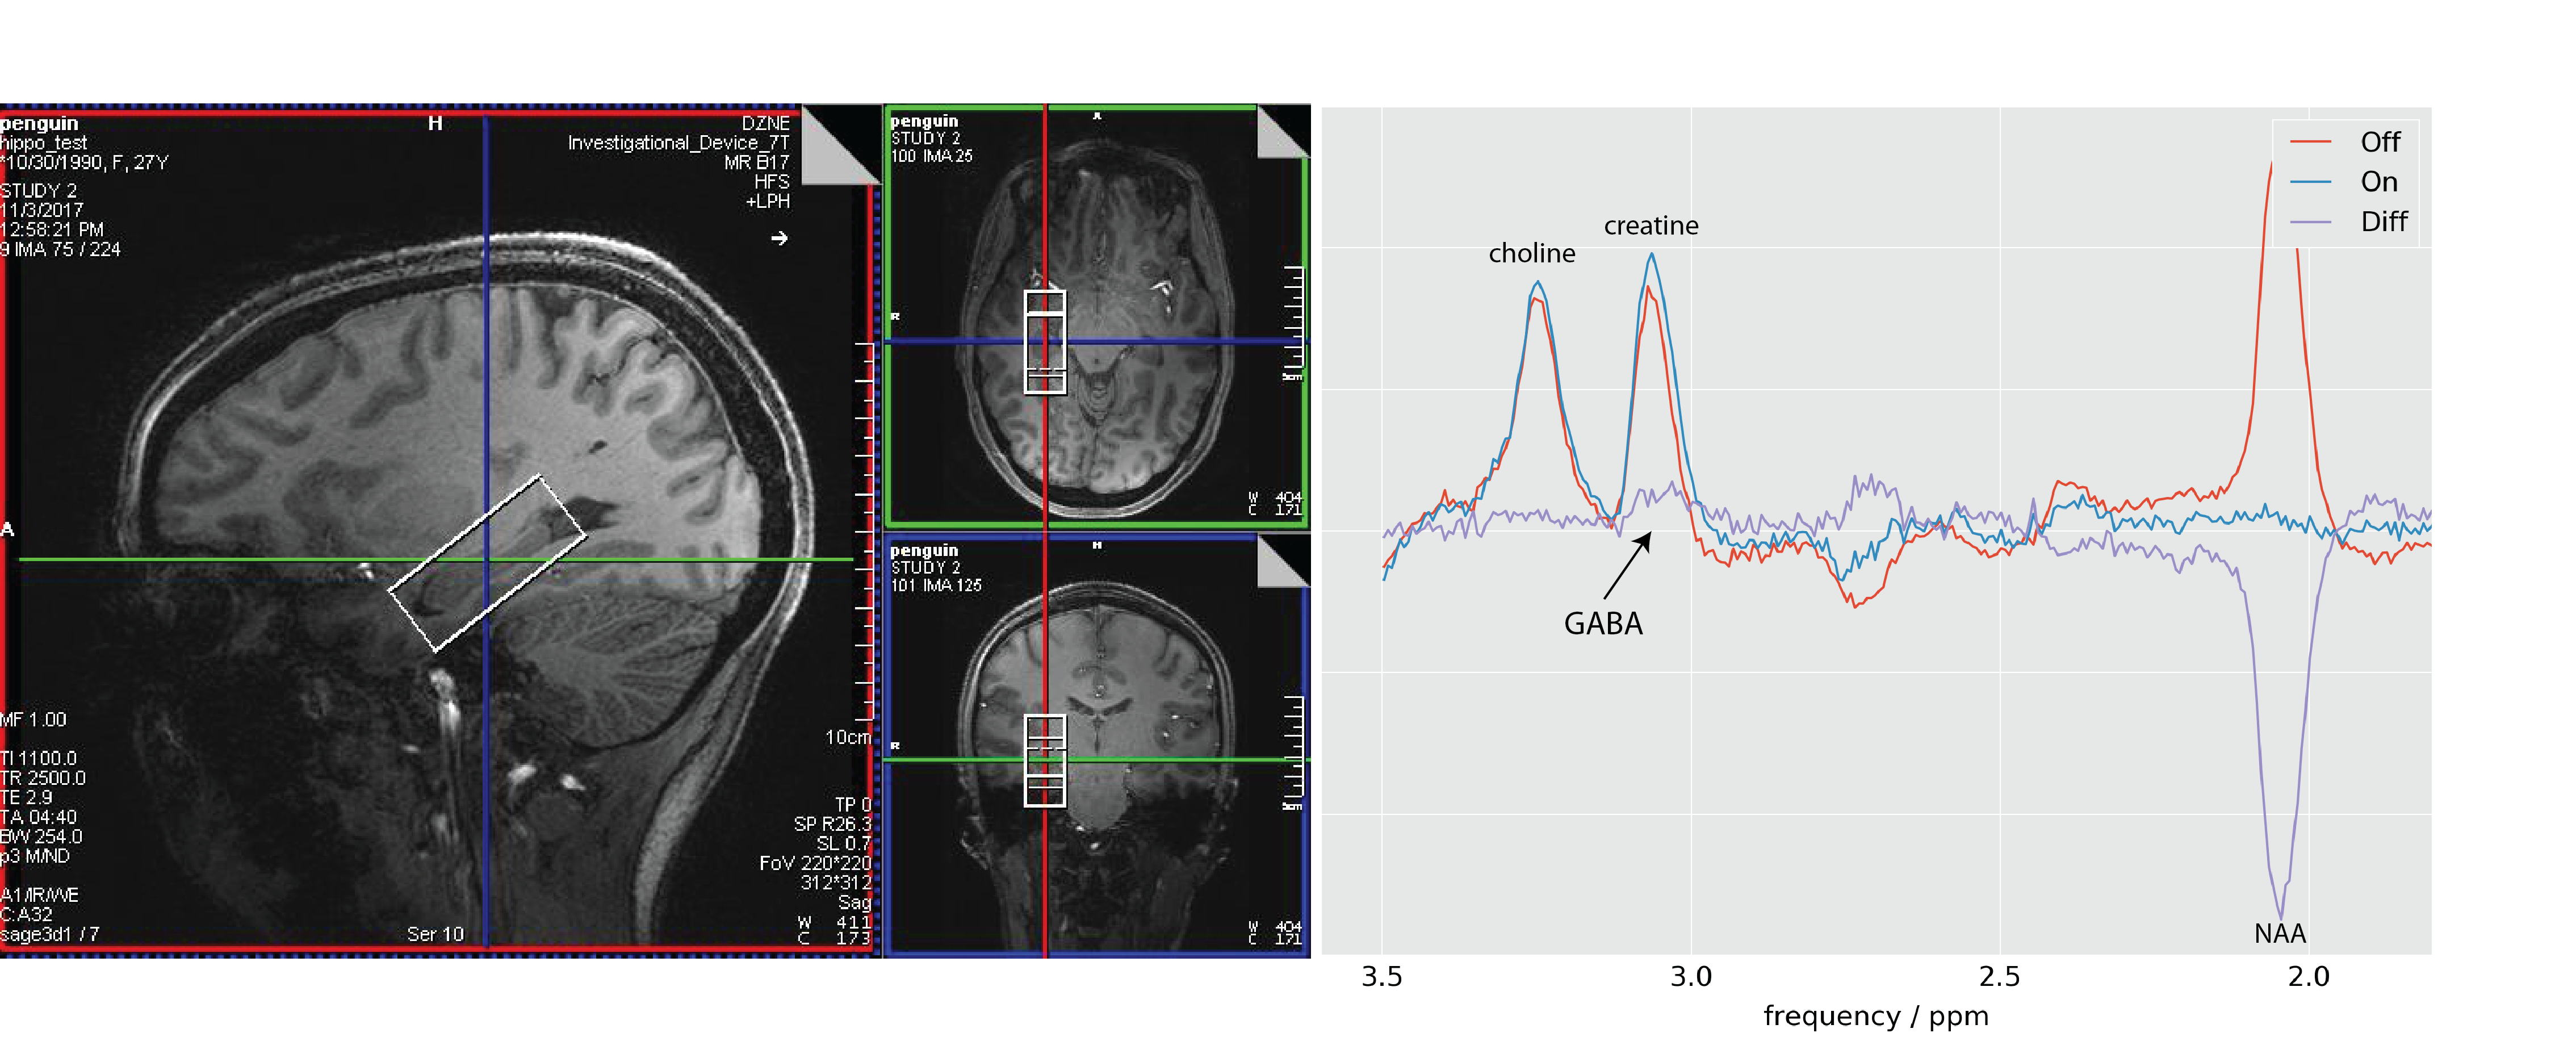
Figure 2 shows the voxel positioning and an example spectrum with slightly distorted resonances.
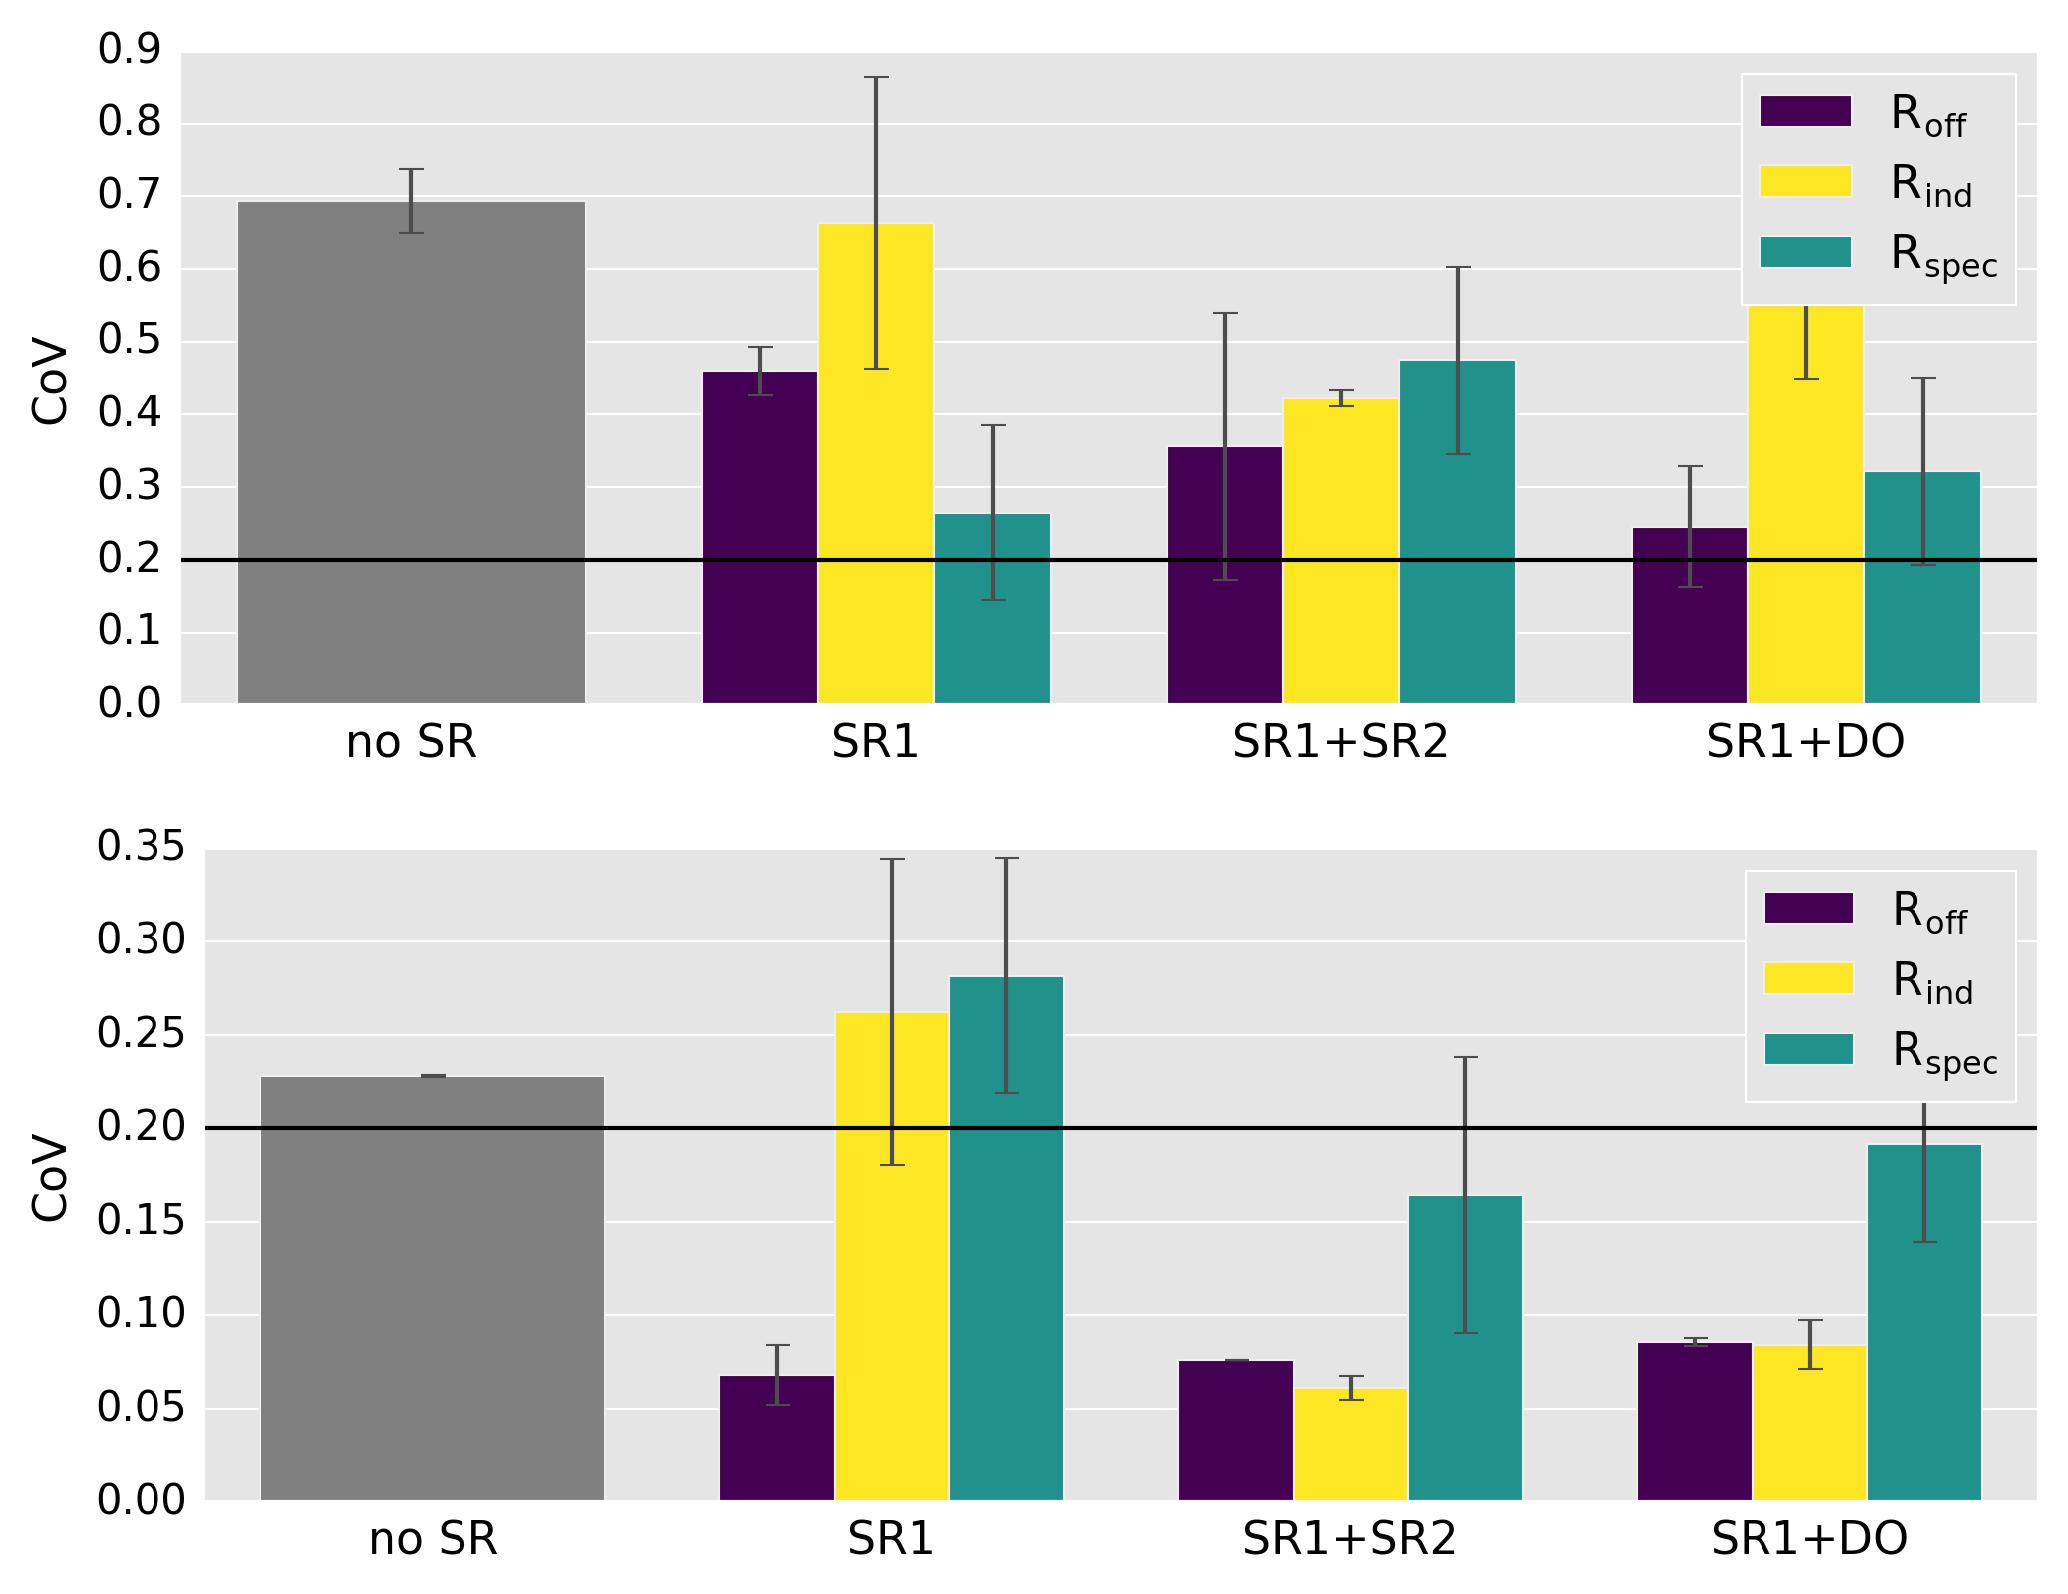
The resulting GCR-CoVs are summarized in figure 3. The top plot shows the results without shape correction. A trend that the dedicated post-processing module increases the repeatability even without line shape correction is visible. However, the GCR-CoV does not drop below 20%.
The bottom plot depicts the results when shape correction is performed directly after coil combination. The repeatability is drastically improved. Without artifact suppression only Roff leads to lower GCR-CoV than in the unregistered case. Using artifact suppression, Rind and Roff perform similarly while Rspec is consistently leading to the highest CoV. The different suppression techniques perform similarly.
Discussion
The preliminary results show that line shape correction is an essential post-processing step in order to obtain repeatable GABA quantification in the hippocampus. Strong B0 inhomogeneities in this region lead to an asymmetric line shape, not accounted for by TARQUIN's fitting routine which assumes a Voigt line shape. Without correcting for this asymmetry reliable fitting cannot be achieved.
However, line shape correction does not minimize difference artifacts. Therefore, difference artifact suppression leads to a further reduction of CGR-CoV. This can be by an direct approach (SR2 or DO) or indirectly by using the same reference in spectral registration (Roff). More data is needed to select the optimal suppression technique.
Rspec leads to the highest GCR-CoV. Limiting the spectral regime reduces the number of time points that can be used for spectral registration. Due to the small T2* in the hippocampus, there are only a few high SNR points left
Conclusion
Preliminary results indicate the possibility of repeatable GABA quantification in the hippocampus. The development of an optimized post-processing module reduces the GCR-CoV to (5-10)%, which is promising for future clinical applications.Acknowledgements
The MEGA-sLASER sequence was implemented in collaboration with Desmond Tse (University of Queensland, Australia).References
1. Andreychenko A, Boer VO, Arteaga de Castro CS, et al. Efficient Spectral Editing at 7 T: GABA Detection with MEGA-sLASER. Magn Reson Med. 2012; 68(4):1018-25
2. Near J, Edden R, Evans CJ, et al. Frequency and phase drift correction of magnetic resonance spectroscopy data by spectral registration in the time domain. Magn Reson Med. 2015; 73(1):44-50
3. Sima DM, Osorio Garcia MI, Poullet J, et al. Lineshape estimation for magnetic resonance spectroscopy (MRS) signals: self-deconvolution revisited 2009 Meas. Sci. Technol. 20 104031
4. Fang L, Wu M, Ke H, et al. Adaptively optimized combination (AOC) of magnetic resonance spectroscopy data from phased array coils. Magn. Reson. Med. 2016; 75:2235–224
5. Wilson M, Reynolds G, Kauppinen R A, et al. A constrained least-squares approach to the automated quantitation of in vivo 1H magnetic resonance spectroscopy data. Magn. Reson. Med. 2011; 65:1-12
6. Cleve M, Krämer M, Gussew A, Reichenbach JR Difference optimization: Automatic correction of relative frequency and phase for mean non-edited and edited GABA 1H MEGA-PRESS spectra. J Magn Reson. 2017; 279:16-21.
Figures