3968
Comparison of GABA and Glx Quantification from Edited and Unedited MR Spectra – assessment of age effects1Department of Imaging and Pathology, KU Leuven, leuven, Belgium, 2Department of Electrical Engineering (ESAT), STADIUS Center for Dynamical Systems, Signal Processing and Data Analytics and Imec, KU Leuven, leuven, Belgium, 3Radiology, Department of Imaging and Pathology, UZ Leuven, leuven, Belgium, 4Movement Control & Neuroplasticity Research Group, KU Leuven, leuven, Belgium
Synopsis
1H-MR spectroscopy (MRS) is a well-established tool to provide in vivo measurement of gamma-aminobutyric acid (GABA), glutamine and glutamine (Glx) concentrations for a variety of conditions1. There is an increasing interest in using spectral editing methods to measure GABA and Glx in the human brain. The commonly used GABA-editing sequence MEGA-PRESS provides filtered GABA signals based on the molecule’s J-coupling2, 3. Nonetheless, quantitative comparison among presently used acquisition and analysis methods is lacking. Here we compare currently available spectral fitting methods to assess the in vivo concentration values for GABA and Glx derived from edited (MEGA-PRESS) and unedited (MEGA-PRESS-OFF) spectra. We have tested our approach to assess the inter-subject variability in neurotransmitter levels arising from age effects.
Purpose
Spectral editing methods like the MEGA-PRESS technique provide a promising approach for the discrimination of GABA from glutamate and glutamine, but to date no comparison was made of GABA concentrations derived from edited (MEGA-PRESS) and unedited (MEGA-OFF) spectra. Only very few studies have investigated the possible changes of GABA levels with advancing age4, 5 and relatively little is known about the inter-subject variability in neurotransmitter levels arising from age effects. In the present study, we quantify the GABA and Glx concentrations derived with edited/unedited MEGA-PRESS using three different spectral fitting methods (Gannet, jMRUI-AMARES, jMRUI-QUEST) and investigate age related differences in neurotransmitter levels in a group of healthy young and old adults.
Methods
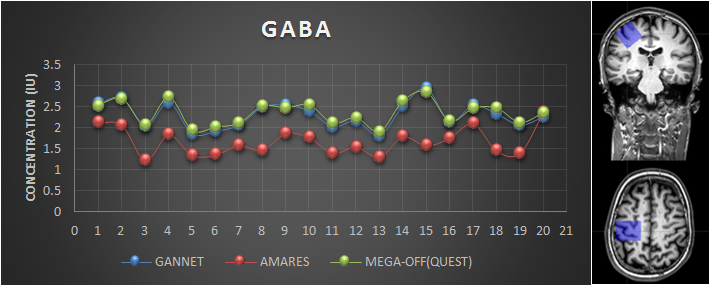
Single voxel spectroscopy was performed in the left sensorimotor cortex (SM1) (Figure 1) of 10 young adults (YA) (18 – 45 years, 38.2 ± 8.43) and 10 older adults (OA) (60 – 70 years, 62.8 ± 6.26) using 3T Philips Achieva scanner. Data were acquired using MEGA-PRESS sequence (TE/TR, 68ms/2s, NA=160, 2 kHz spectral width) with a voxel size of 3x3x3 cm3. ON and OFF spectra were acquired in an interleaved order by placing the 14ms editing pulse at 1.9 ppm and 7.46 ppm respectively. Edited spectra were quantified using Gannet 3.0 toolbox6 and jMRUI v6.0-AMARES7 algorithm. MEGA-PRESS-OFF spectra were quantified with jMRUI v6.0-QUEST8 algorithm. Basis sets for QUEST were simulated using NMRScopeB9. No tissue corrections were applied. A water-unsuppressed signal was acquired from the same voxels, such that data is reported as the water-normalized ratios: GABA/H2O and Glx/H2O.
Results
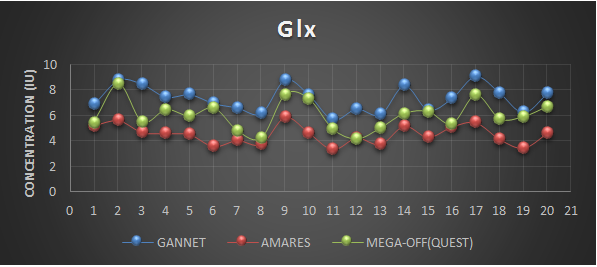
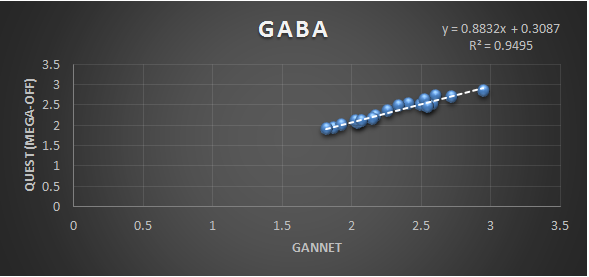
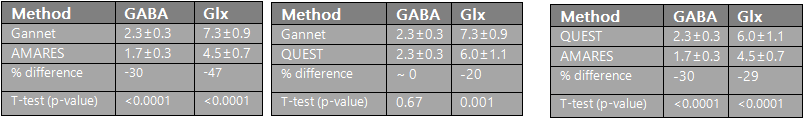
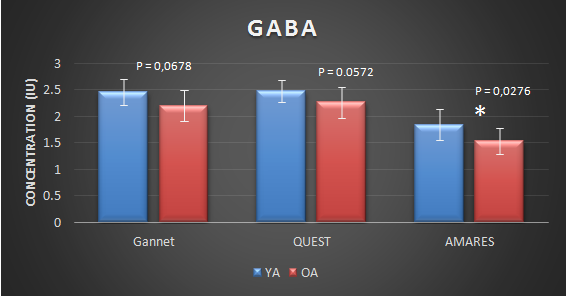
Figures 1, 2 show GABA and Glx concentrations estimated with Gannet, AMARES, and QUEST for the 20 subjects. The differences between values estimated using Gannet, AMARES and QUEST are presented in Table 1 for metabolite concentrations. Positive correlations were found for GABA values estimated with Gannet and QUEST (R2 = 0.95) (Figure 3) and Gannet and AMARES (R2 = 0.69). Edited GABA estimated with AMARES showed significantly lower levels for the older adults. Likewise GABA estimated with Gannet and QUEST (MEGA-OFF) had a trend towards decreasing GABA levels in older adults (P = 0.028, P = 0.067 and P = 0.057 respectively).
Discussion
The inter-subject variability for GABA levels was lower than that of Glx for all three fitting methods. Almost no difference in values was found for GABA estimated with Gannet (edited) and QUEST (MEGA-OFF). Maximum difference (30%) for GABA was found between Gannet and AMARES. For Glx a 20% difference in values was found between Gannet and QUEST and 47% difference between Gannet and AMARES. The variability in concentration values may be due to differences in T1, T2 relaxation times10, 11, water visibility values (% of water in brain tissue), apodization and editing efficiency values used in each processing tool in estimating the absolute concentration. Even though not many studies reported GABA changes with advancing age, a recent study from Porges et al (2017)12 observed a decrease in GABA levels with advancing age within frontal and parietal locations. Our observation of lower GABA in older as compared to young adults needs further analysis with tissue corrections since the distribution of GABA varies across neural tissue fractions13. The age-related differences in GABA levels we observed may be driven by the gray matter loss rather than altered GABA levels within the gray and white matter tissues.
Conclusion
In conclusion, there is a good agreement between GABA values estimated with Gannet (edited) and QUEST (MEGA-OFF) spectral fitting methods. The strong correlation between the Gannet (edited) and QUEST (MEGA-OFF) may suggest that conventional MRS (PRESS or STEAM) with a TE=68ms may be used to measure GABA levels accurately in the absence of advanced MRS sequences. Furthermore, our results indicate that within the SM1 voxel GABA levels were lower in older as compared to young adults.
Acknowledgements
No acknowledgement found.References
1. Shungu DC, Mao X, Gonzales R. Brain GABA Detection in vivo with the J-editing 1H MRS Technique: A Comprehensive Methodological Evaluation of Sensitivity Enhancement, Macromolecule Contamination and Test-Retest Reliability. NMR in biomedicine. 2016; 29(7):932-942.
2. Mullins PG, Mc Gonigle DJ, O’Gorman RL. Current practice in the use of MEGA-PRESS spectroscopy for the detection of GABA. Neuroimage. 2014; 86:43-52.
3. Puts NA, Edden RA. In vivo magnetic resonance spectroscopy of GABA: a methodological review. Prog Nucl Magn Reson Spectrosc. 2012; 60:29-41.
4.Chang L, Jiang CS, Ernst T. Effects of age and sex on brain glutamate and other metabolites. Magn Reson Imaging. 2009; 27(1):142-5.
5. Sanacora G, Mason GF, Rothman DL, Behar KL, Hyder F, Petroff OA, Berman RM, Charney DS, Krystal JH. Reduced cortical gamma-aminobutyric acid levels in depressed patients determined by proton magnetic resonance spectroscopy. Arch Gen Psychiatry. 1999 ;56(11):1043-7.
6. Edden RA, Puts NA, Harris AD, Barker PB, Evans CJ. Gannet: A batch-processing tool for the quantitative analysis of gamma-aminobutyric acid–edited MR spectroscopy spectra. J Magn Reson Imaging. 2014 ;40(6):1445-52.
7. Vanhamme L, van den Boogaart A, Van Huffel S. Improved method for accurate and efficient quantification of MRS data with use of prior knowledge . J Magn Reson. 1997;129(1):35-43.
8. Ratiney H, Sdika M, Coenradie Y, Cavassila S, van Ormondt D, Graveron-Demilly D. Time-domain semi-parametric estimation based on a metabolite basis set. NMR Biomed. 2005;2005(18):1–13.
9. Starčuk Z Jr, Starčuková J. Quantum-mechanical simulations for in vivo MR spectroscopy: Principles and possibilities demonstrated with the program NMRScopeB. Anal Biochem. 2017; 15;529:79-97.
10. Edden RAE, Intrapiromkul J, Zhu H, Cheng Y, Barker PB. Measuring T2 In Vivo With J-Difference Editing: Application to GABA at 3 Tesla. Journal of Magnetic Resonance Imaging. 2012;35(1):229-234.
11. Puts NAJ, Barker PB, Edden RAE. Measuring the longitudinal relaxation time of GABA in vivo at 3T. Journal of magnetic resonance imaging : JMRI. 2013;37(4):999-1003.
12. Porges EC, Woods AJ, Edden RA, Puts NA, Harris AD, Chen H, Garcia AM, Seider TR, Lamb DG, Williamson JB, Cohen RA. Frontal Gamma-Aminobutyric Acid Concentrations Are Associated With Cognitive Performance in Older Adults. Biol Psychiatry Cogn Neurosci Neuroimaging. 2017: 2(1):38-44.
13.Olsen RW, Sieghart W. GABAA Receptors: Subtypes Provide Diversity of Function and Pharmacology. Neuropharmacology. 2009;56(1):141-148.
Figures