3967
Automated MR Spectrum Registration for In Vivo Mouse MEGA-PRESS Study at 9.4T And the Introduction of MRSMouse2.01Department of Biomedical Engineering, Columbia University, New York, NY, United States, 2Biomedical Engineering & Radiology and Biomedical Imaging, Yale University, New Haven, CT, United States, 3Departments of Neurology, Radiology or Psychiatry, Columbia University College of Physicians and Surgeons, New York, NY, United States
Synopsis
The goal of this study was to develop the tailored automated processing and quantification software for Meshcher–Garwood point resolved spectroscopy (MEGA-PRESS) in research of mouse models at 9.4T. The proposed software, MRSMouse, consists of two modules: the data loading module, MRSMouseLoad, which reads the Bruker time-domain raw data and processes it into a frequency-domain GABA-edited spectrum with bandwidth, frequency and phase drift correction through spectrum registration; and the spectral fitting module, MRSMouseFit, which quantifies the metabolite concentrations by modeling the spectra as a linear combination of the simulated basis-set and a smooth-spline in the frequency domain.
INTRODUCTION
MRS spectral editing studies of mice have been limited due to difficulties in spectrum processing and the lack of a standardized software package for analysis. Using the same sequence, MRS scans from different subjects, or different sessions can have different receiver gain, water suppression, phase or frequency shift, bandwidth, signal-to-noise ratio (S/N) and etc. A direct comparison between metabolite quantities can be biased by the inter-scan variances from sources listed above or simply because of the difference in CSF fraction within the acquired voxel. If those variances get too large, the chance of detecting small metabolic changes in vivo vanishes due to the loss of sensitivity, which is the case in in vivo study of small animals where the targeting metabolites have intrinsically low concentrations in the brain.
We recently successfully developed an acquisition protocol and a Matlab toolkit for MEGA-PRESS study of the mouse brain at 9.4T1, to allow in vivo detection and quantification of GABA and glutamate/glutamine (Glx). MRSMouse loads Bruker raw data and performs automated spectral processing and quantitation. It was designed to process spectra of every single scan separately and quantify the level of metabolite using the pipeline which is similar to most MRS processing software2.
Registration is used extensively3,4 for MRI images which brings images into a common spatial coordinate in which each voxel corresponds to a predetermined anatomic entity and is necessary for automated groupwise analysis. In this work, we present an automated MEGA-PRESS spectra processing pipeline that is designed to enable an unbiased evaluation of inter-scan spectra through spectrum registration.
METHODS
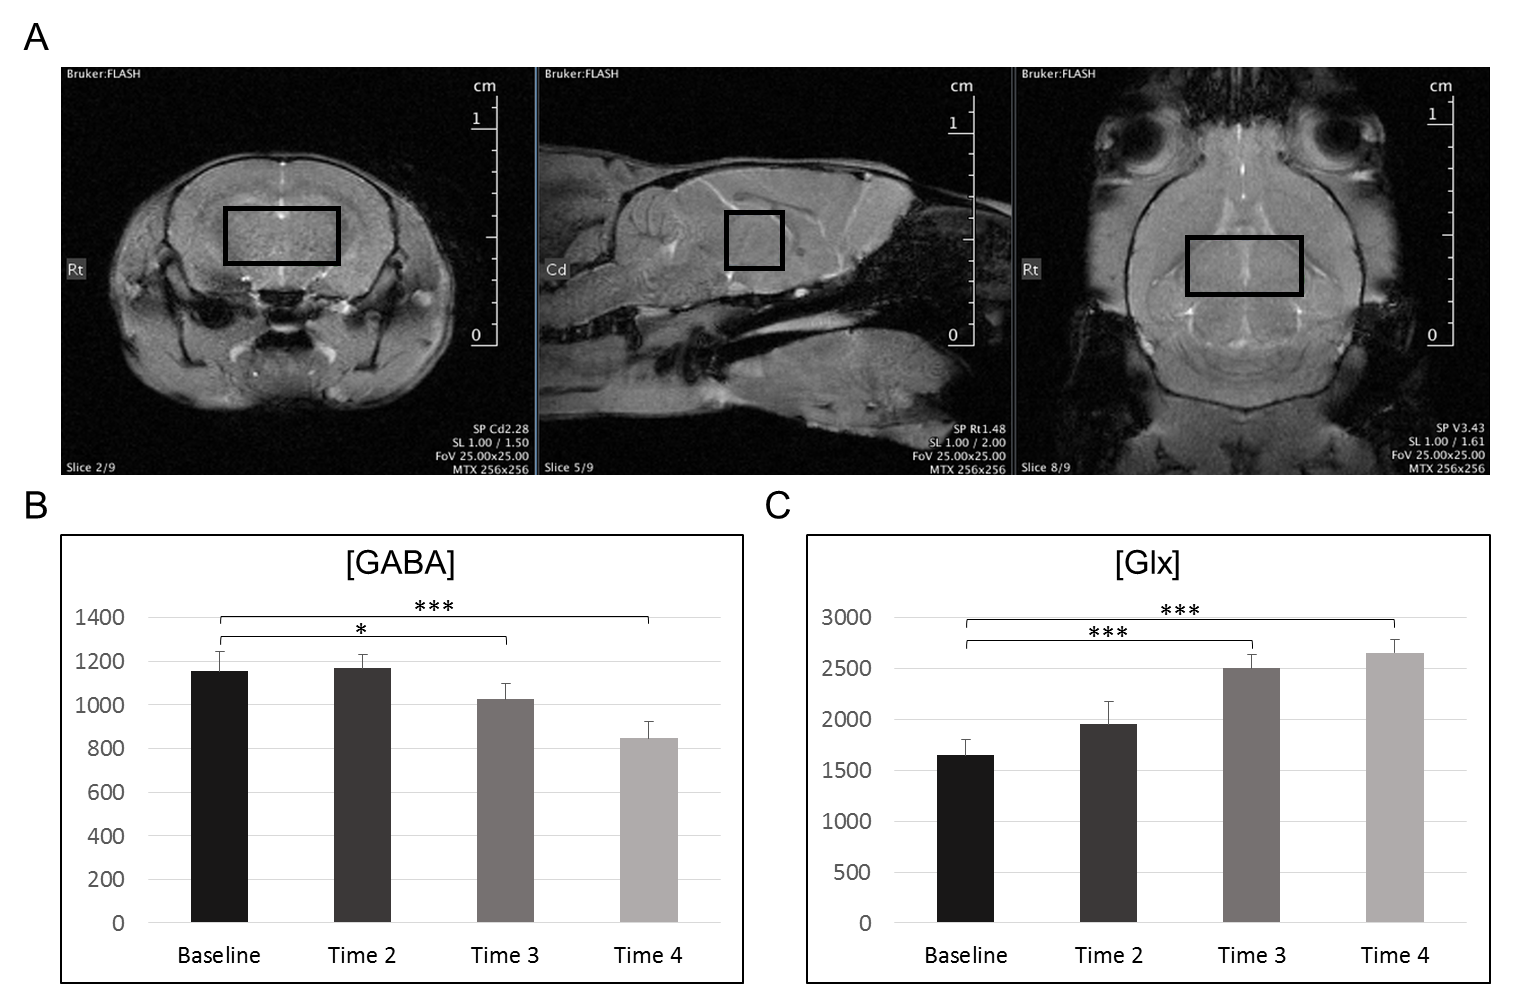
A Bruker BioSpec 94/20 system was used with a 23mm 1H-circularly-polarized transmit/receive-capable mouse head volume-coil. Four GABA-editing scans per mouse were acquired at the thalamus in a 2-hour time-course for 9 male wild-type mice with 1-1.5% isoflurane, using MEGA-PRESS protocol proposed previously1. A total of 320 repetitions were obtained (160 "on",160 "off") for each scan (NA=8).
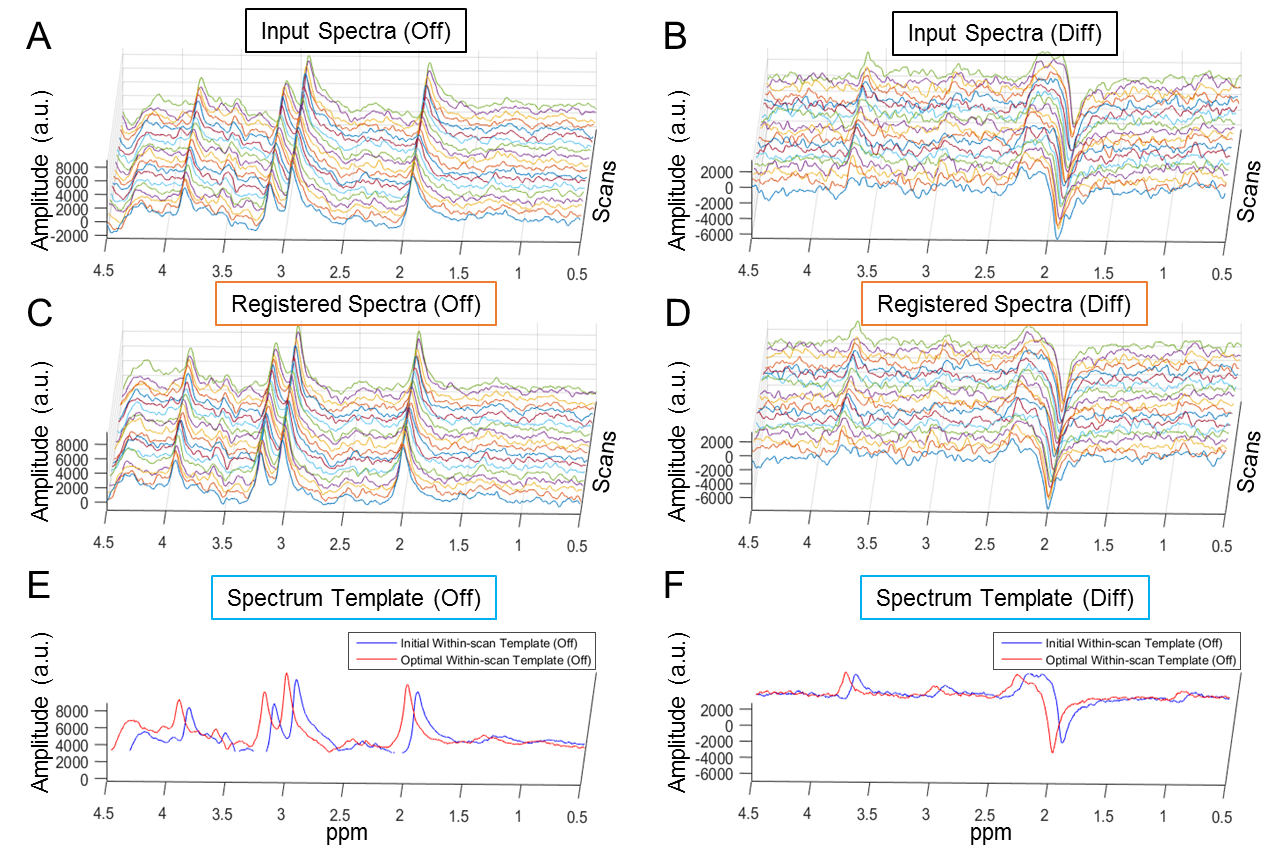
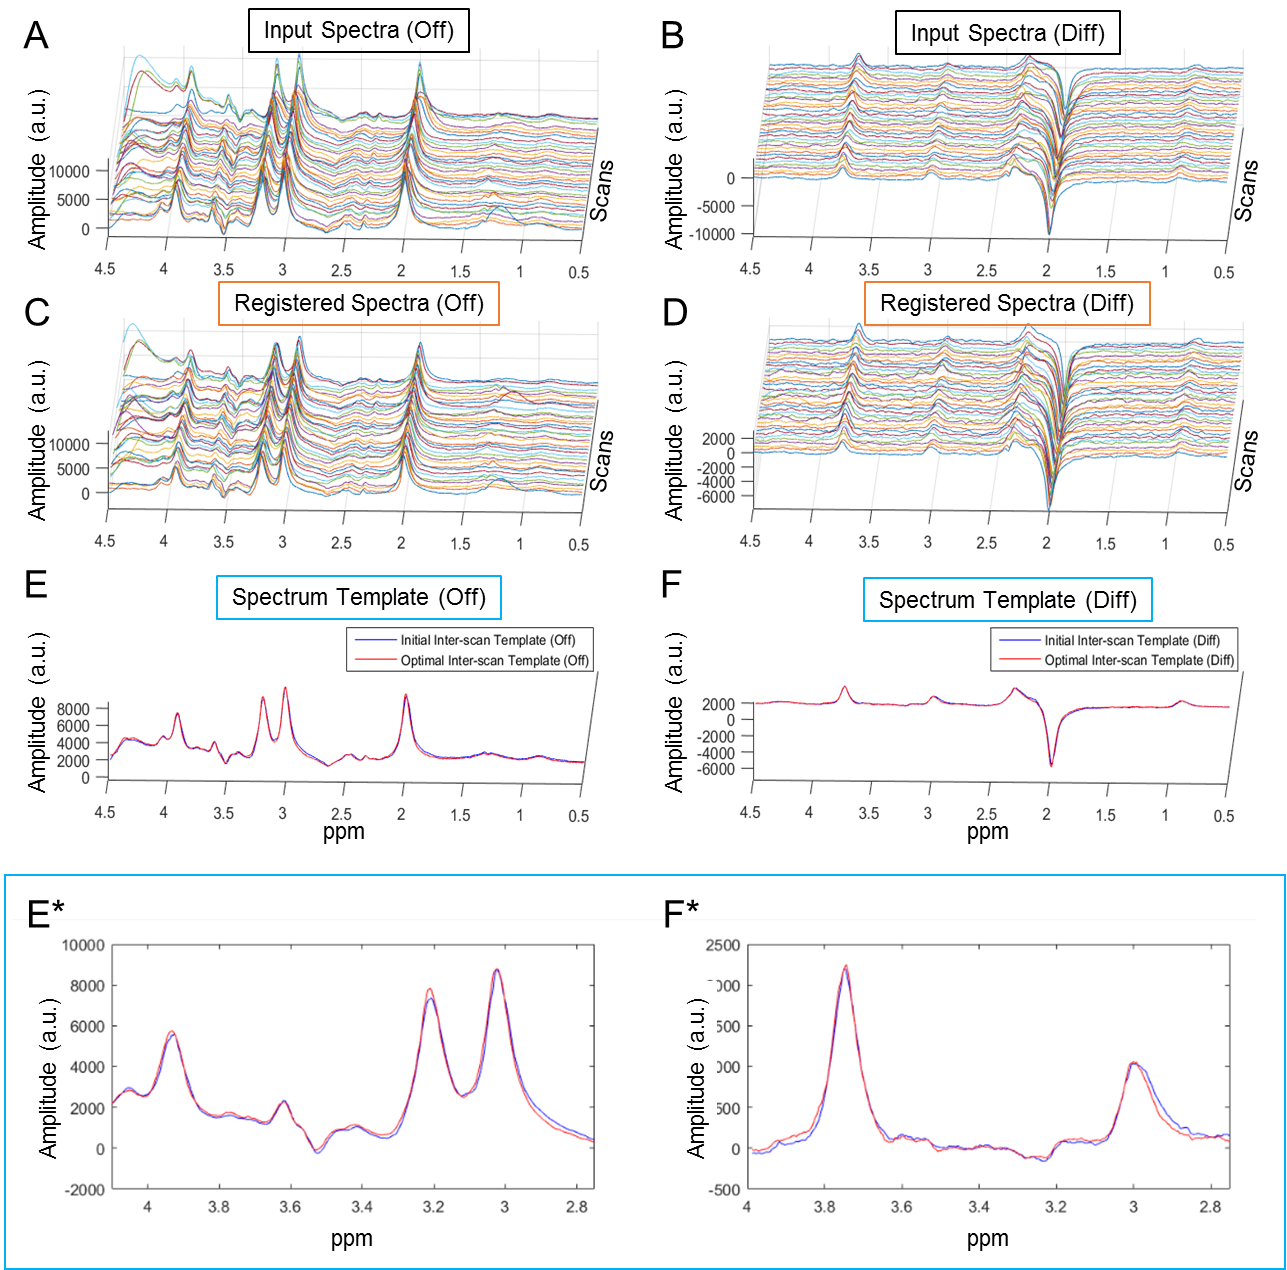
Given a single MEGA-PRESS scan, multiple repetitions were acquired to gain S/N. Using MRSMouseLoad, we first run within-scan spectrum registration for each subject to reduce the between-repetition variances (i.e., phase/frequency drift) with the ‘off’ spectra as input. After within-scan spectrum registration, averaged-‘off’ spectrum, -‘on’ spectrum and -edited spectrum were generated for each scan. Then we continued with inter-scan spectrum registration for all scans obtained, to reduce the between-scan variances (phase, frequency and bandwidth differences) using their averaged ‘off’ spectra as the input. The spectrum registration for both steps used the ‘off’ spectra as input, and same adjustments were applied to their pair-wise ‘on’ spectra so that the co-registered GABA-edited spectra can be generated as the averaged difference (‘on’-‘off’).
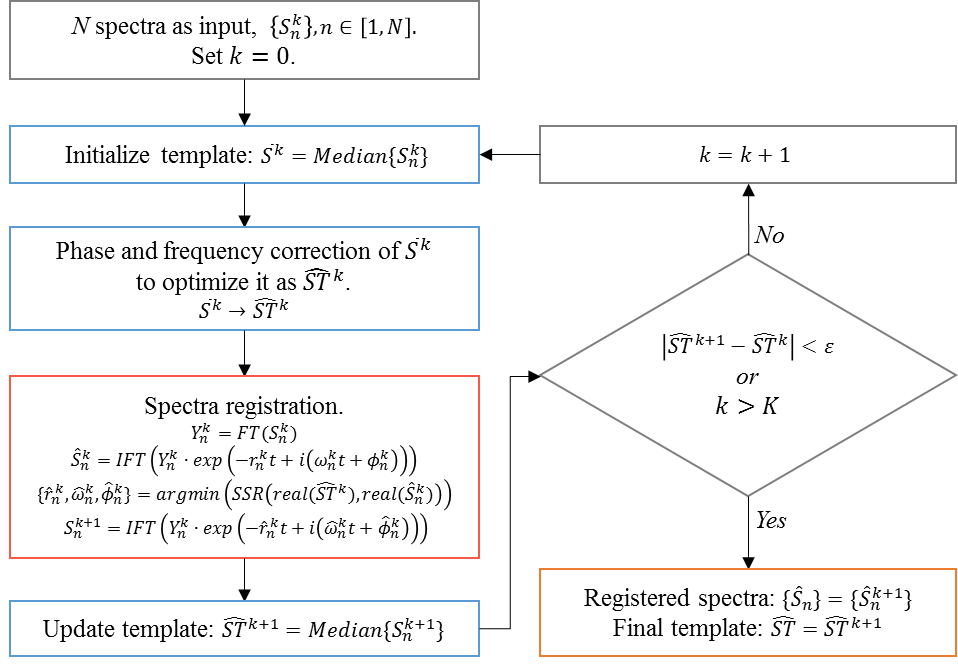
As illustrated in Figure-1, the automatic spectrum registration algorithm involves two steps and runs recursively till the template converges: step-1 (blue), median template construction; step-2 (red), spectrum registration. The automatic process stops if the relative difference of the templates generated from two successive iterations is below a threshold, or the number of iterations reaches the predefined upper-bound. With this robust spectrum registration, an unbiased, median template is generated by iteratively aligning all input spectra in the frequency domain and a simultaneous spectral co-registration is achieved.
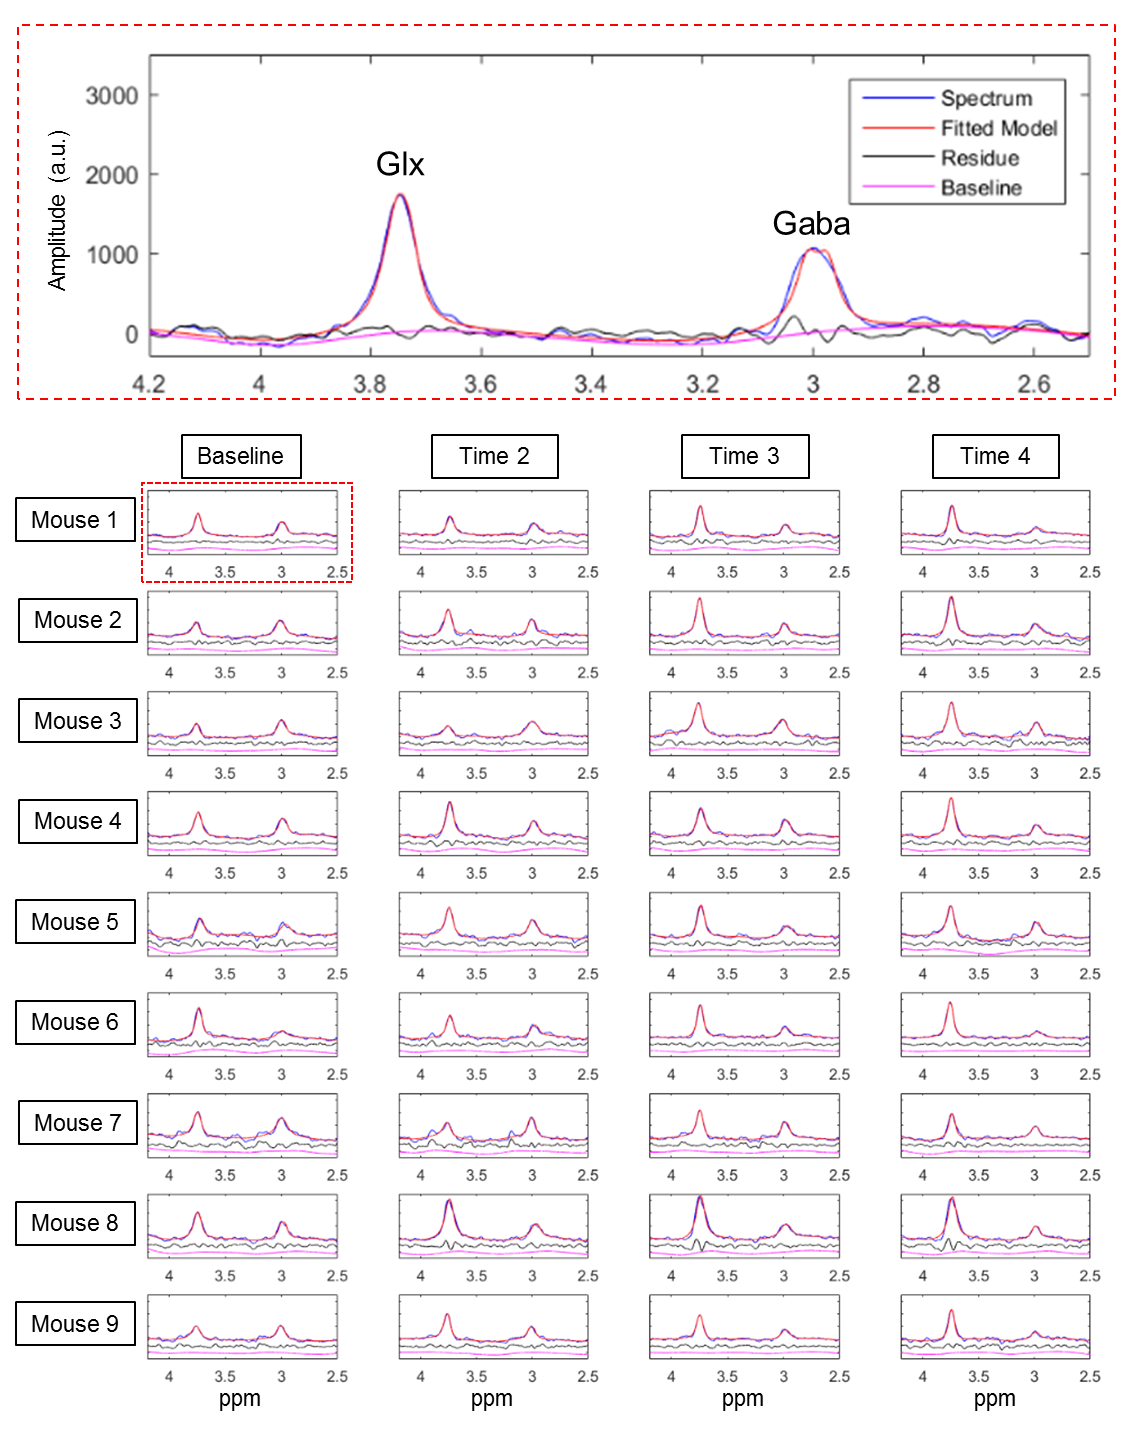
After spectrum registration, the GABA-edited spectra were quantified using the modified MRSMouseFit module, by adding a smooth spline term into the optimization model to address the baseline distortion. GABA and Glx levels were successfully calculated for all data.
RESULTS
Figure-1 outlines the workflow of our algorithm.
Examples of within-scan and inter-scan registration are shown in Figure-2 and -3, respectively.
Quantification of thalamic GABA and Glx levels were successfully obtained (Figure-4).
Figure-5 shows the time-course of thalamic GABA and Glx levels during anesthesia.
DISCUSSION
For in vivo MEGA-PRESS data of mouse brain, the limited S/N and the various sources of variances put the standard spectra processing approach at a disadvantage. In the present study, we developed and validated a spectrum registration based pipeline for in vivo MRS quantification in a fully automated fashion. A freely available toolkit, MRSMouse2.0, will be released with the aim of robust automatic processing and quantification of small animal MEGA-PRESS data in vivo.
Targeting metabolite levels can be quantified by normalizing to the within-scan NAA or Cr concentration.
CONCLUSION
We present the toolkit MRSMouse2.0, designed for automated analysis of MEGA-PRESS spectra of the mouse brain. With Bruker raw data supported, our toolkit is fully automated and rater-independent and is optimized to deal with low S/N spectra and perform groupwise study. We anticipate that it will be a useful tool for the adoption of J-difference editing studies in transgenic mice.Acknowledgements
No acknowledgement found.References
1. Guo, J. et al. In vivo detection and automatic analysis of GABA in the mouse brain with MEGA-PRESS at 9.4 T. NMR in Biomedicine, e3837-n/a, doi:10.1002/nbm.3837.
2. Mullins, P. G. et al. Current practice in the use of MEGA-PRESS spectroscopy for the detection of GABA. Neuroimage 86, 43-52, doi:10.1016/j.neuroimage.2012.12.004 (2014).
3. Avants, B. B. et al. A reproducible evaluation of ANTs similarity metric performance in brain image registration. Neuroimage 54, 2033-2044, doi:10.1016/j.neuroimage.2010.09.025 (2011).
4. Oliveira, F. P. & Tavares, J. M. Medical image registration: a review. Comput Methods Biomech Biomed Engin 17, 73-93, doi:10.1080/10255842.2012.670855 (2014).
5. Chen, L., Weng, Z., Goh, L. & Garland, M. An efficient algorithm for automatic phase correction of NMR spectra based on entropy minimization. Journal of Magnetic Resonance 158, 164-168, doi:https://doi.org/10.1016/S1090-7807(02)00069-1 (2002).
Figures