3962
Editing everything with HERCULES: Hadamard-encoded editing of seven low-concentration metabolites1Russell H. Morgan Department of Radiology and Radiological Science, The Johns Hopkins University School of Medicine, Baltimore, MD, United States, 2F. M. Kirby Research Center for Functional Brain Imaging, Kennedy Krieger Institute, Baltimore, MD, United States, 3Division of Biomedical Engineering, Department of Human Biology, University of Cape Town, Cape Town, South Africa
Synopsis
Low-concentration metabolites can be detected at 3T with J-difference-edited MR spectroscopy. However, long acquisition times (~10 min per metabolite) make edited studies of many metabolites unfeasible. Multiplexed editing experiments have increased the time efficiency of editing while maintaining its specificity. Here, we introduce HERCULES (Hadamard Editing Resolves Chemicals Using Linear-combination Estimation of Spectra), an advanced multiplexed approach to differentiate the evolution of eight editable spin systems (GABA, GSH, Asp, Asc, NAA, NAAG, Lac and 2-HG) within a single experiment. HERCULES quantifies a total number of 13 metabolites, providing a 7T-like neurochemical profile of neurotransmitters, antioxidants, and metabolic markers at 3T.
Introduction
Edited MRS allows for the tailored detection of one of a number of important low-concentration metabolites at 3T: γ-aminobutyric acid (GABA), glutathione (GSH), aspartate (Asp), ascorbate (Asc), N-acetylaspartylglutamate (NAAG), lactate (Lac), and 2-hydroxyglutarate (2-HG)1, which are difficult to resolve with conventional un-edited MRS. Editing prioritizes the resolution of a single low-concentration metabolite of interest over assessment of a broad neurometabolic profile. Therefore, editing proceeds at a rate of only one edited metabolite per ~10-min experiment, precluding interrogation of a large number of metabolites within clinical MR protocols. Multiplexed editing has increased data acquisition rates by allowing simultaneous separable detection within a Hadamard-encoded framework, but remains at two2,3 or three4 simultaneously edited metabolites. Here, we introduce HERCULES (Hadamard Editing Resolves Chemicals Using Linear-combination Estimation of Spectra), a combination of a multiplexed Hadamard-encoded editing technique with a novel multiplexed modeling approach, to unambiguously and simultaneously detect and quantify 13 metabolites in a single 11-minute experiment at 3T.Theory
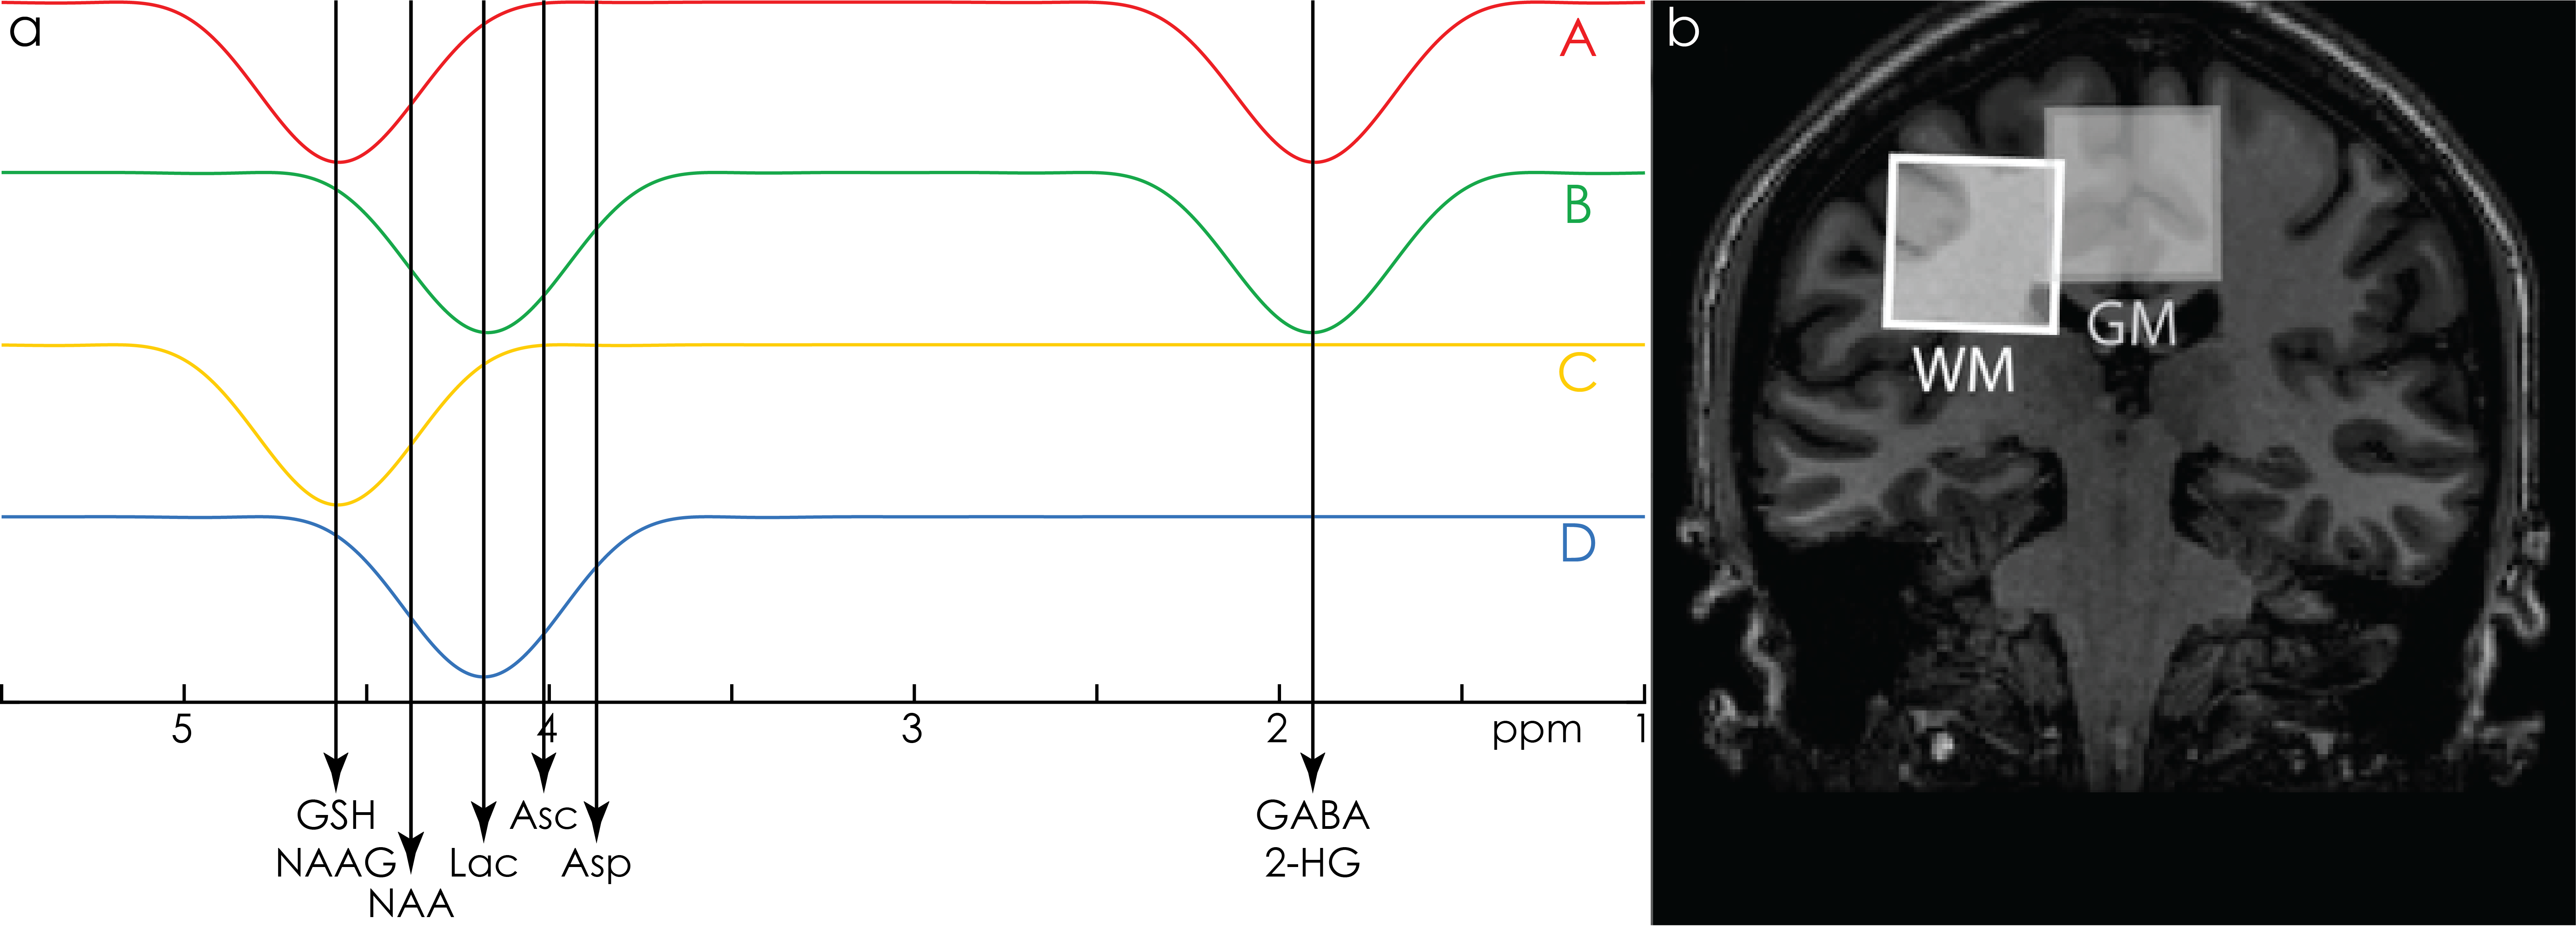
HERCULES consists of four sub-experiments with different editing pulse characteristics, designed to differentiate the evolution of eight editable metabolites shown in Fig. 1a: (A) dual-band editing at 4.58 and 1.9 ppm; (B) dual-band editing at 4.18 and 1.9 ppm; (C) single-band editing at 4.58 ppm; (D) single-band editing at 4.18 ppm. The resulting sub-spectra are combined to give three orthogonal Hadamard combinations: the sum spectrum (A+B+C+D); one difference-edited spectrum (A+B–C–D) of signals impacted by the 1.9 ppm lobe; and a second difference-edited spectrum (A–B+C–D) of signals impacted by the 4.58 and 4.18 ppm lobes. One key feature of this editing scheme is that the editing lobes at 4.58 and 4.18 ppm are symmetrically placed around the 4.38 ppm resonance of N-acetylaspartate (NAA). This arrangement retains NAA signal in the sum spectrum and suppresses it in the A–B+C–D spectrum, differentiating NAA from the overlapping aspartyl signals of Asp and NAAG. Instead of fitting each Hadamard combination separately (as is usual for edited MRS), HERCULES models the concatenation of all three Hadamard combinations together with HERCULES basis functions that were simulated for 17 metabolite spin systems with the FID-A toolkit5. The simultaneous fit incorporates all the available spectral information to constrain the model, exploiting the separation of overlapping resonances into orthogonal Hadamard combinations.Methods
HERCULES data were acquired on a 3T Philips Achieva scanner from eleven healthy adults in two 3 × 3 × 5 cm3 voxels: one gray-matter-rich (GM) voxel in the anterior cingulate cortex; and one white-matter-rich (WM) voxel in the centrum semiovale (Fig. 1b). Parameters were TR/TE = 2000/80 ms; 20-ms editing pulses (FWHM = 61.9 Hz); 2048 data points; 2 kHz spectral width; 320 averages.
Spectra were fit in MATLAB using the novel multiplexed least-squares (LSQ) linear modeling approach. Metabolite levels were calculated as ratios to total creatine (tCr = Cr+PCr).
Results
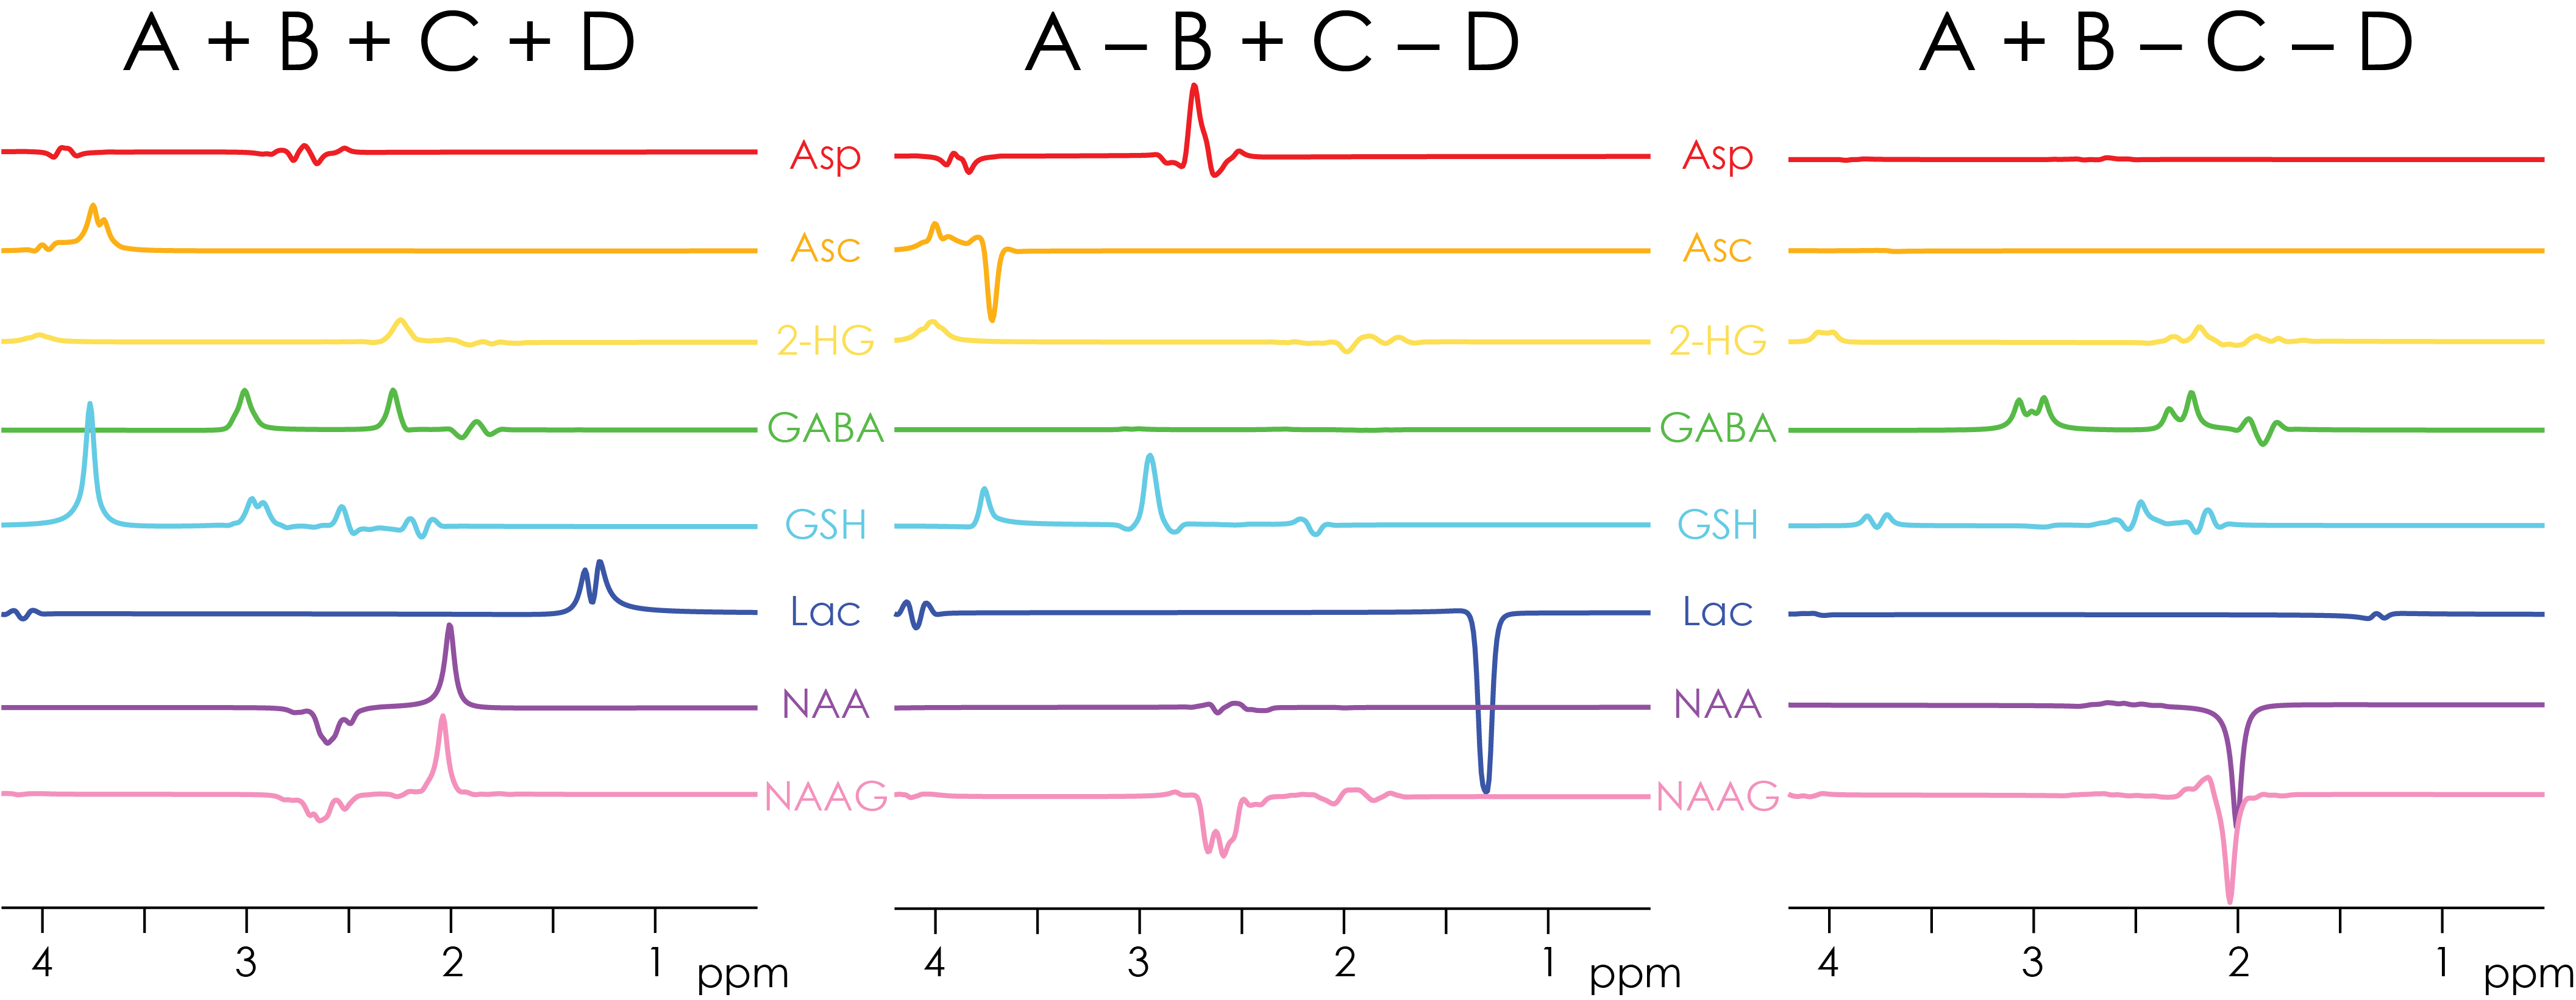
Simulated (equimolar) spectra for the eight edited metabolites are shown in Fig. 2. Note that the overlapping edited signals of GABA and GSH appear in separate difference spectra. The NAA aspartyl signal at 2.6 ppm appears in the sum spectrum, while the NAAG aspartyl signal appears in the A–B+C–D spectrum.
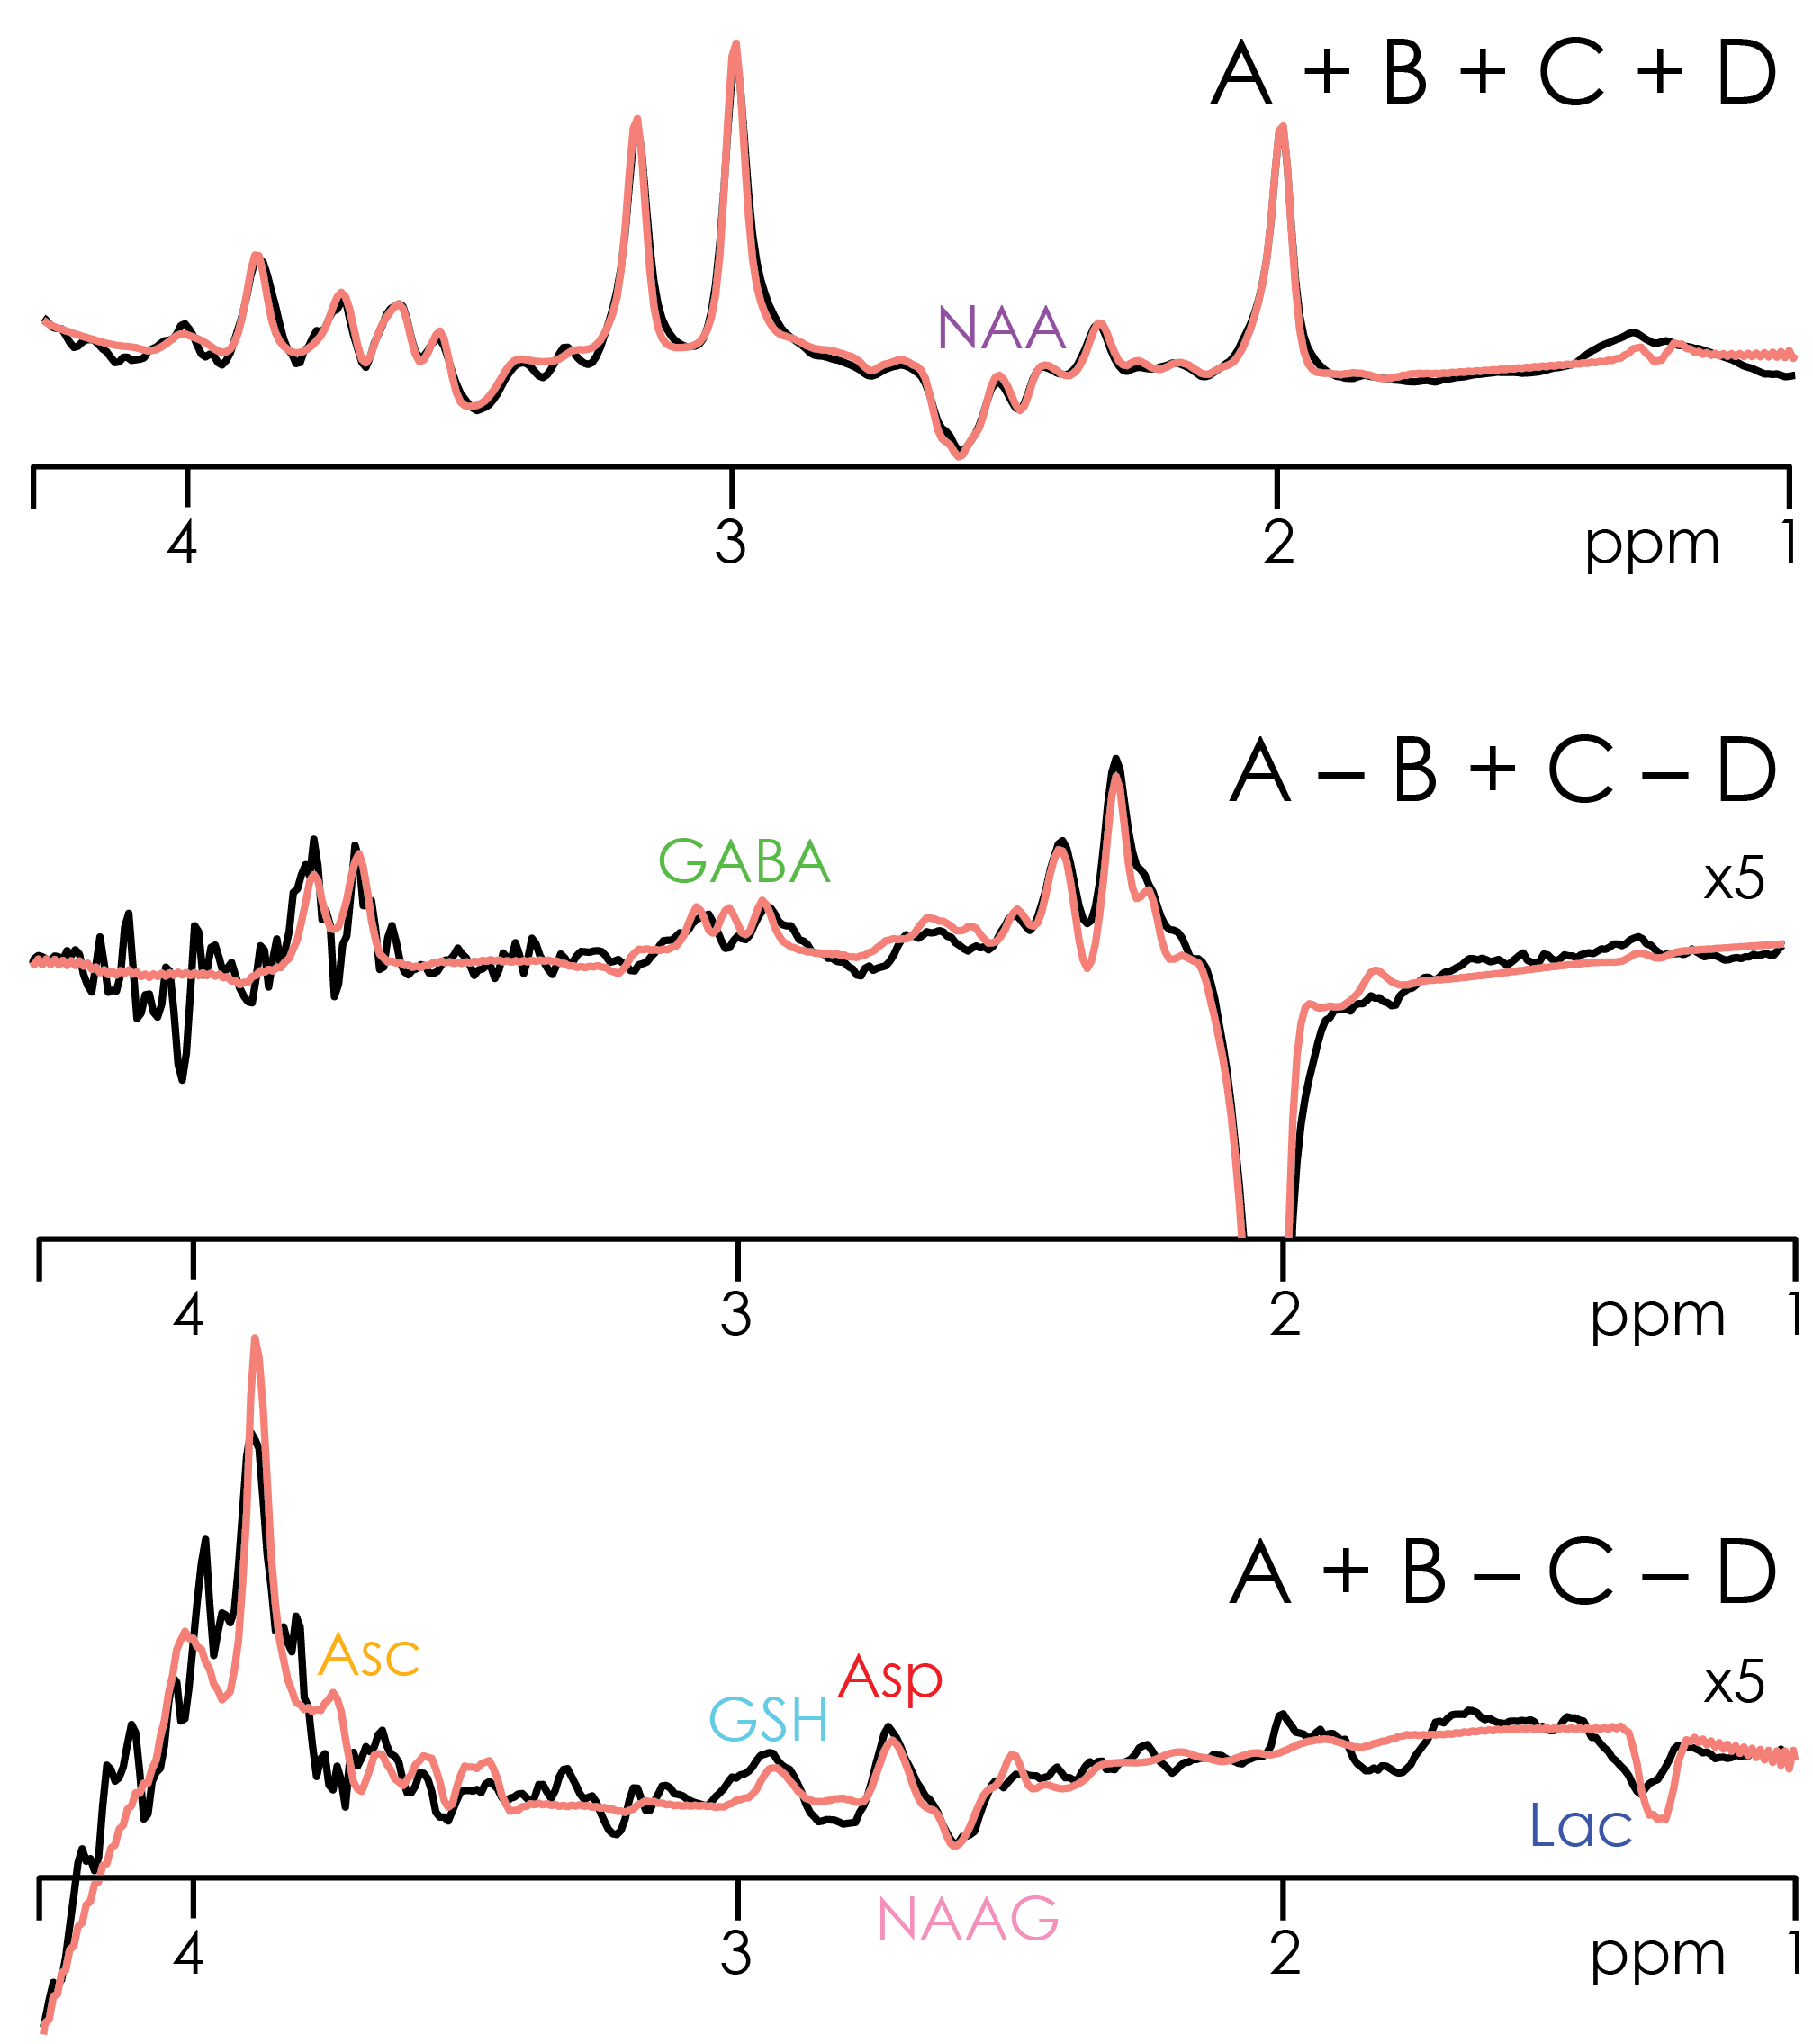
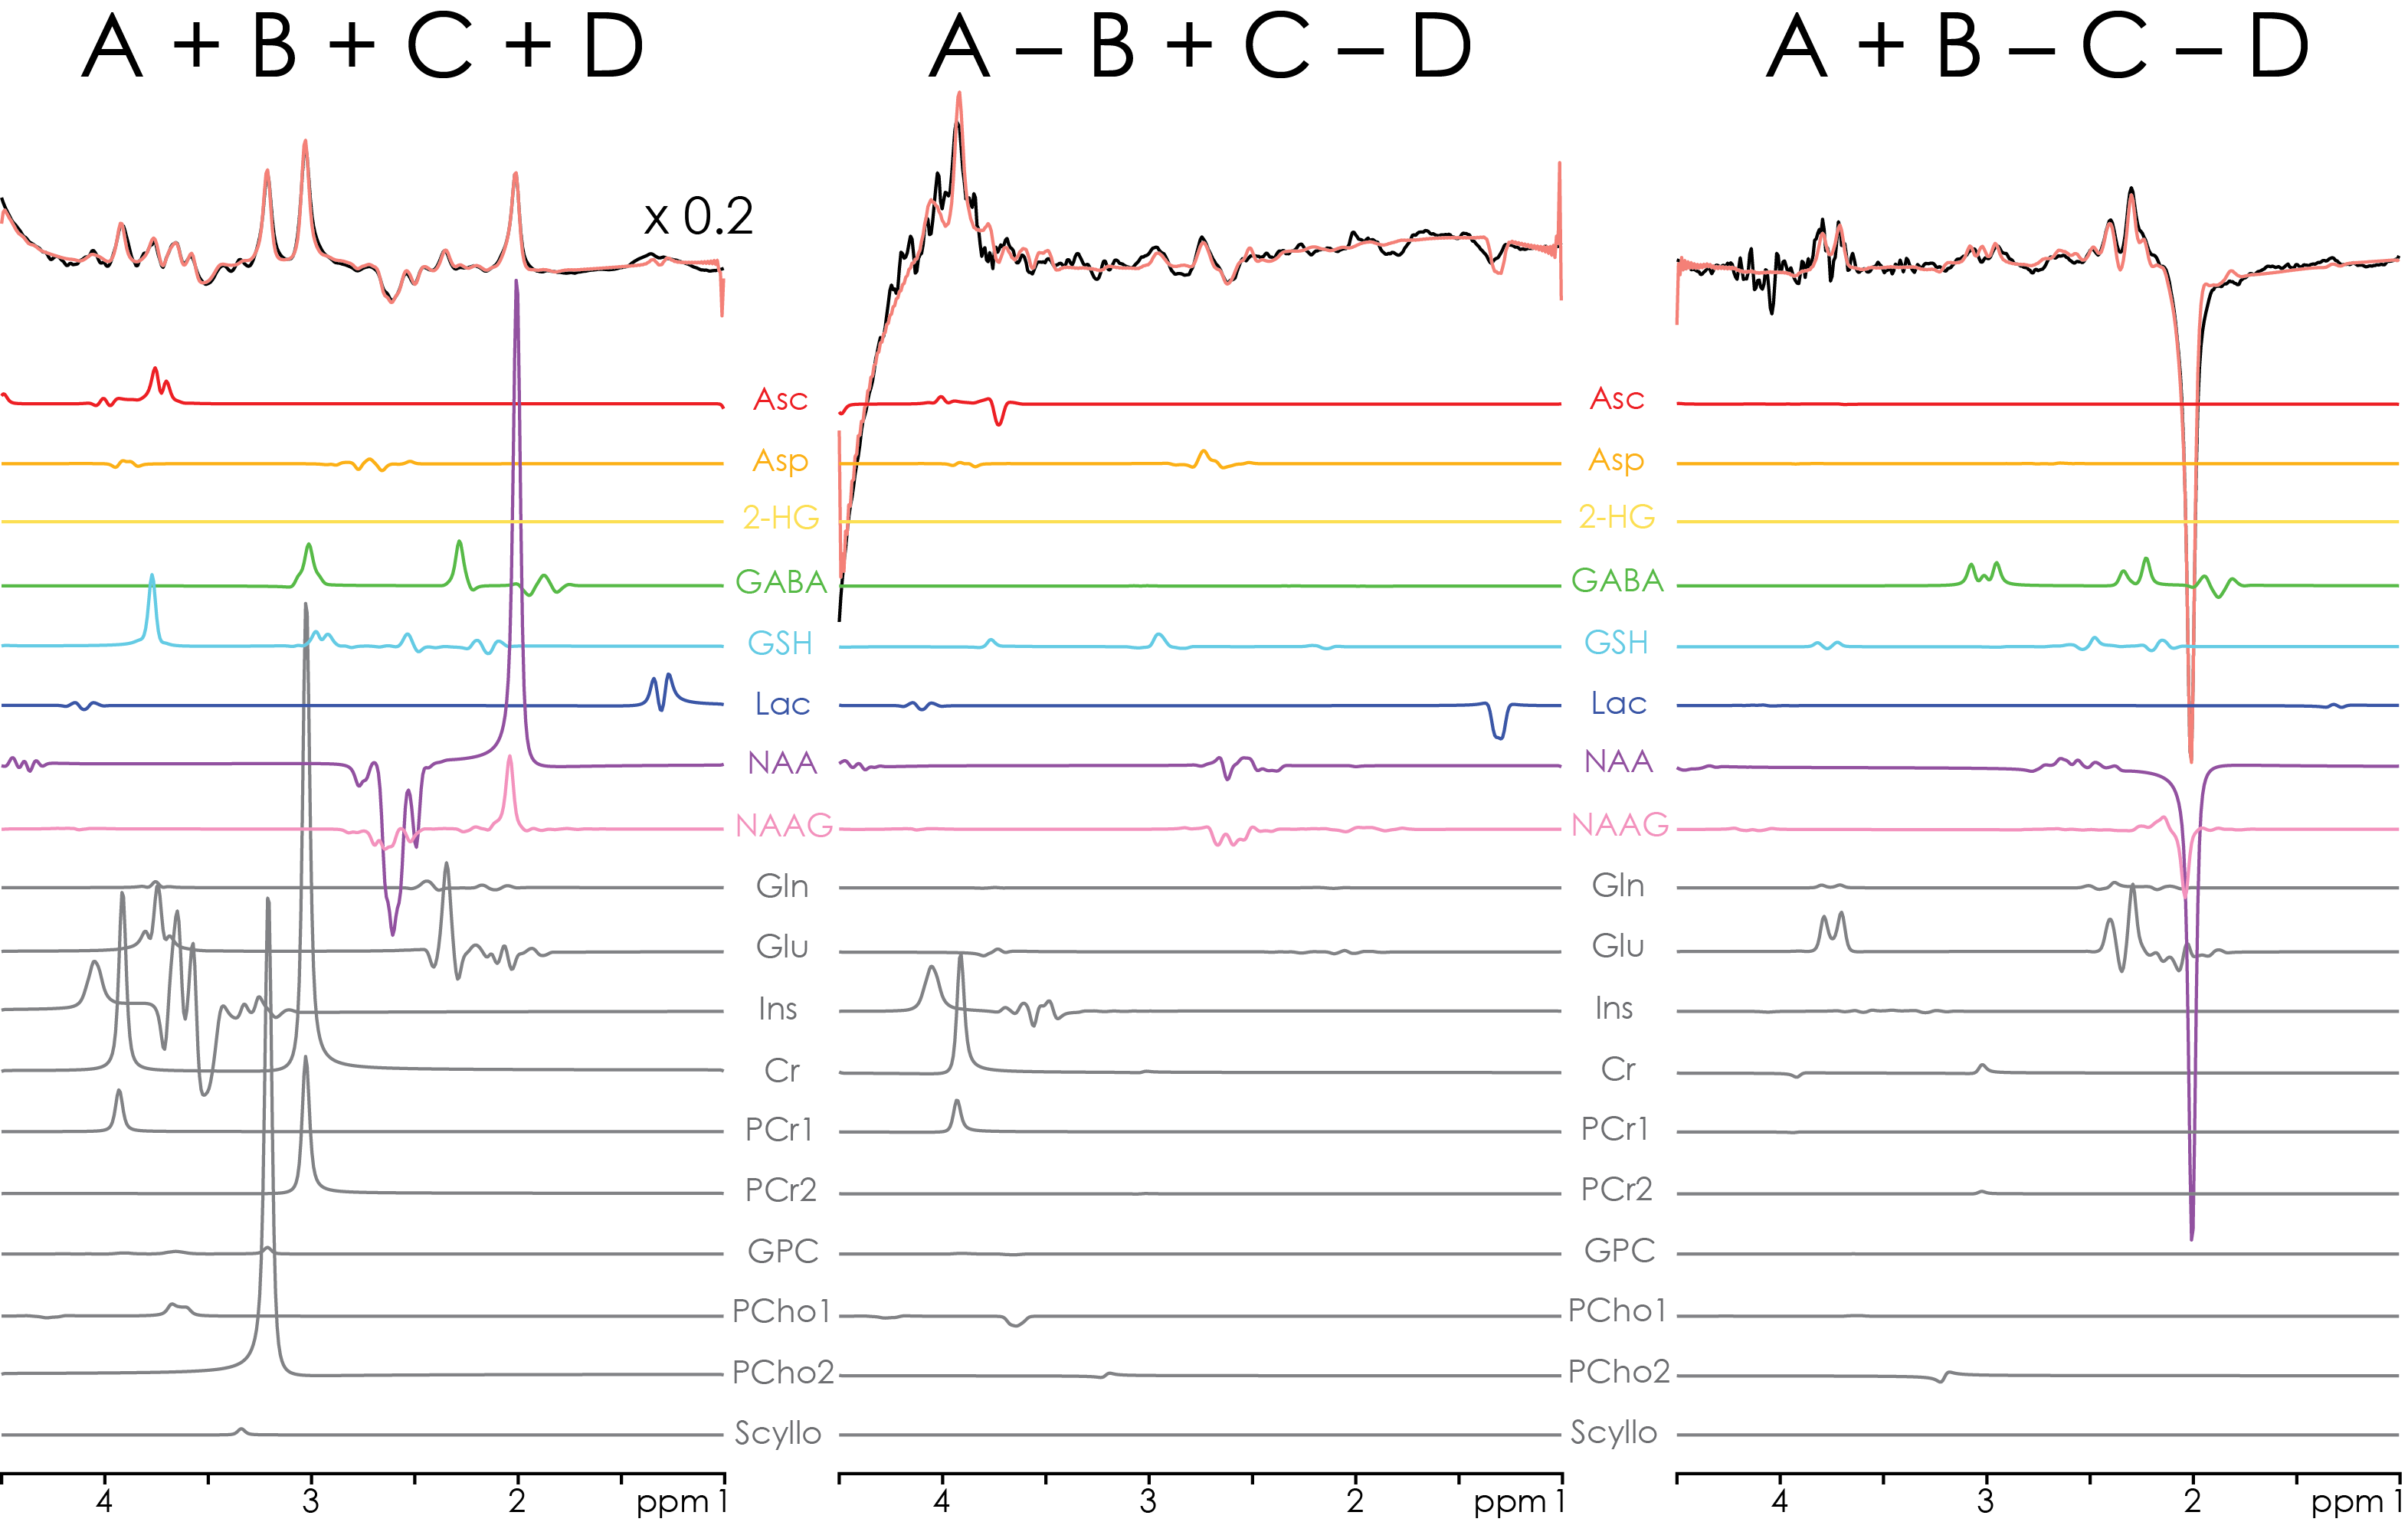
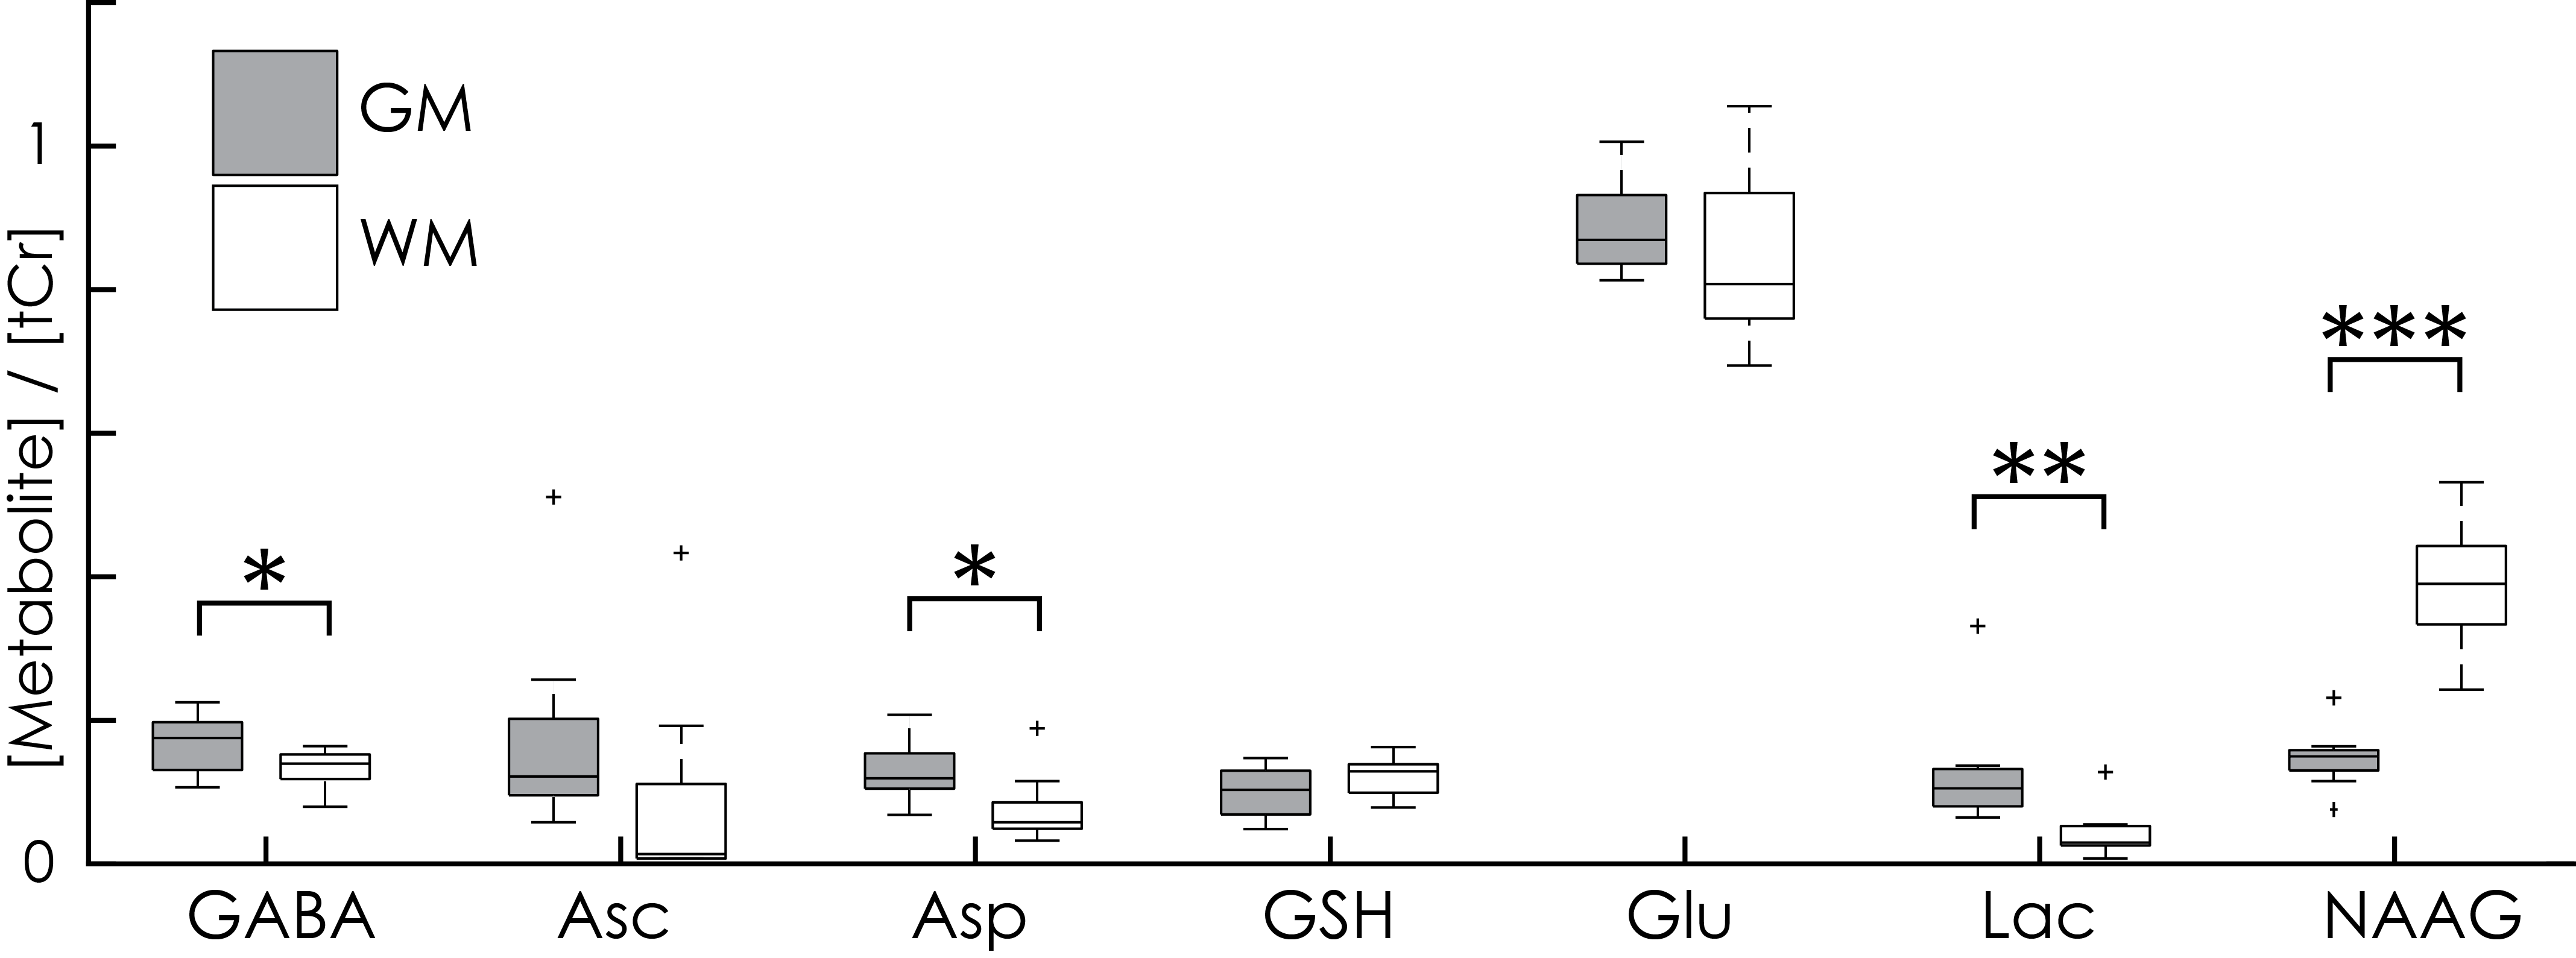
The three Hadamard combinations are shown for one subject in Fig. 3, with model fits shown in Fig. 4. In addition to the eight edited metabolites, signals from glutamine (Gln), glutamate (Glu), myo-inositol (Ins), creatine (Cr), and choline (Cho) can also be distinguished, resulting in a total of 13 quantifiable metabolites. Quantitative results from both regions and all subjects are summarized for seven metabolites in Fig. 5, demonstrating several significant between-region differences: higher levels of GABA in GM; higher levels of NAAG in WM; increased Lac levels in a voxel with substantial volume fraction of cerebrospinal fluid (here the GM voxel).
Discussion
The in vivo HERCULES spectra indicate successful implementation of the intended editing scheme, segregating coupled resonances into the intended orthogonal Hadamard combinations. Results reproduce several expected differences in GABA6, NAAG7, and Lac levels between GM and WM regions, validating the quantitative potential of the HERCULES approach. Further optimization of the editing scheme, the HERCULES-specific post-processing pipeline (e.g., frequency-and-phase correction) and the modeling will yield further improvements in the specificity and accuracy of quantification.Conclusion
Up to seven low-concentration metabolites can be simultaneously edited and quantified using the HERCULES approach, in addition to six high-concentration metabolites, providing a 7T-like neurochemical profile at 3T within a single 11-minute acquisition.Acknowledgements
This work was supported by NIH grants R01 EB016089, R01 EB023963 and P41 EB015909. NAJP receives salary support from NIH grant K99 MH107719References
1. Harris AD, Saleh MG, Edden RAE. Edited 1 H magnetic resonance spectroscopy in vivo: Methods and metabolites. Magn Reson Med. 2017;77(4):1377-1389.
2. Chan KL, Puts NAJ, Schär M, Barker PB, Edden RAE. HERMES: Hadamard encoding and reconstruction of MEGA-edited spectroscopy. Magn Reson Med. 2016;76(1):11-19.
3. Saleh MG, Oeltzschner G, Chan KL, Puts NAJ, Mikkelsen M, Schär M, Harris AD, Edden RAE. Simultaneous edited MRS of GABA and glutathione. Neuroimage. 2016;142:576-582.
4. Chan KL, Saleh MG, Oeltzschner G, Barker PB, Edden RAE. Simultaneous Measurement of Aspartate, NAA and NAAG using HERMES spectral editing at 3 Tesla. Neuroimage. 2017;155:587-593.
5. Simpson R, Devenyi GA, Jezzard P, Hennessy TJ, Near J. Advanced processing and simulation of MRS data using the FID appliance (FID-A)-An open source, MATLAB-based toolkit. Magn Reson Med. 2017;77(1):23-33.
6. Choi IY, Lee SP, Merkle H, Shen J. In vivo detection of gray and white matter differences in GABA concentration in the human brain. Neuroimage. 2006;33(1):85-93.
7. Pouwels PJ, Frahm J. Differential distribution of NAA and NAAG in human brain as determined by quantitative localized proton MRS. NMR Biomed. 1997;10(2):73-78.
Figures