3959
Simultaneous Measurement of Glutamate, Glutamine, GABA, and Glutathione by Spectral Editing Without Subtraction1National Institute of Mental Health, National Institutes of Health, Bethesda, MD, United States
Synopsis
A novel spectral editing approach was proposed to simultaneously measure glutamate, glutamine, GABA, and glutathione at 7 T. By using a single editing pulse, a relatively short echo time of 56 ms was achieved. The main targets of the signal detection were the H2 and H4 protons of GABA and the H4 protons of glutamate, glutamine, and the glutamyl moiety of glutathione. No motion-sensitive data subtraction was required.
INTRODUCTION
Glutamate, glutamine, and γ-aminobutyric acid (GABA) are the three major metabolites of the glutamatergic and GABAergic systems, and glutathione is the major oxidative stress marker. Abnormal glutamate, glutamine, GABA, and glutathione activities are associated with many neurological and psychiatric disorders (1,2,3), and thus measuring these metabolites reliably will have many applications in the studies of these disorders. In this work, we propose a new spectral editing approach, named Multi-Edit, to simultaneously measure glutamate, glutamine, GABA, and glutathione at 7 T.METHODS
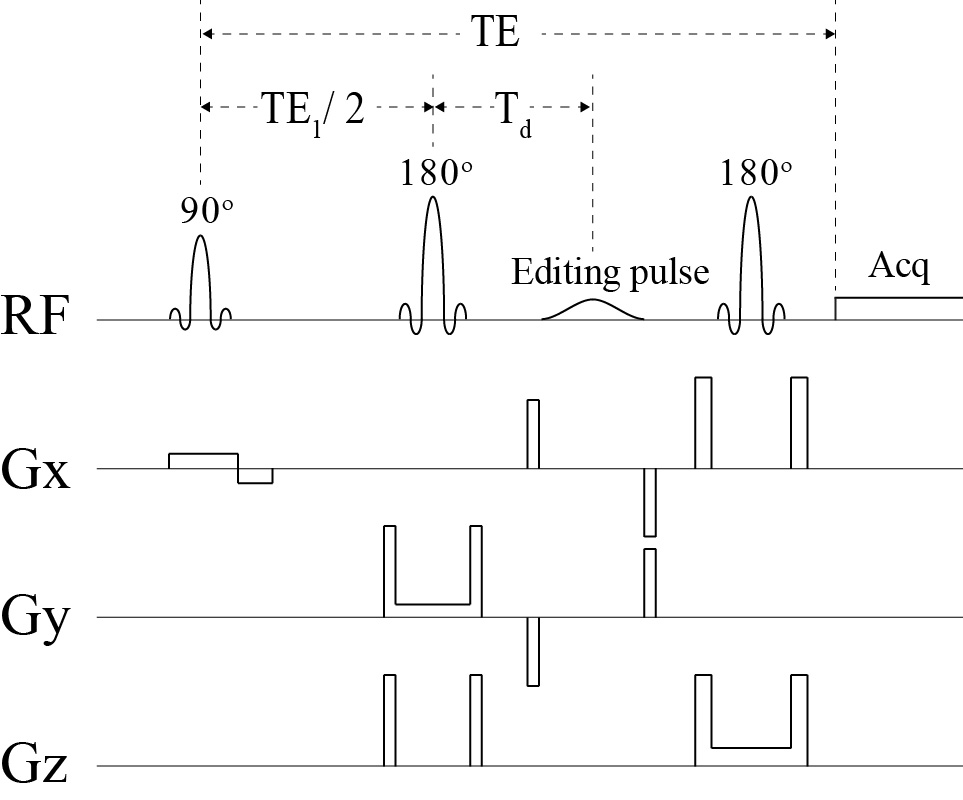
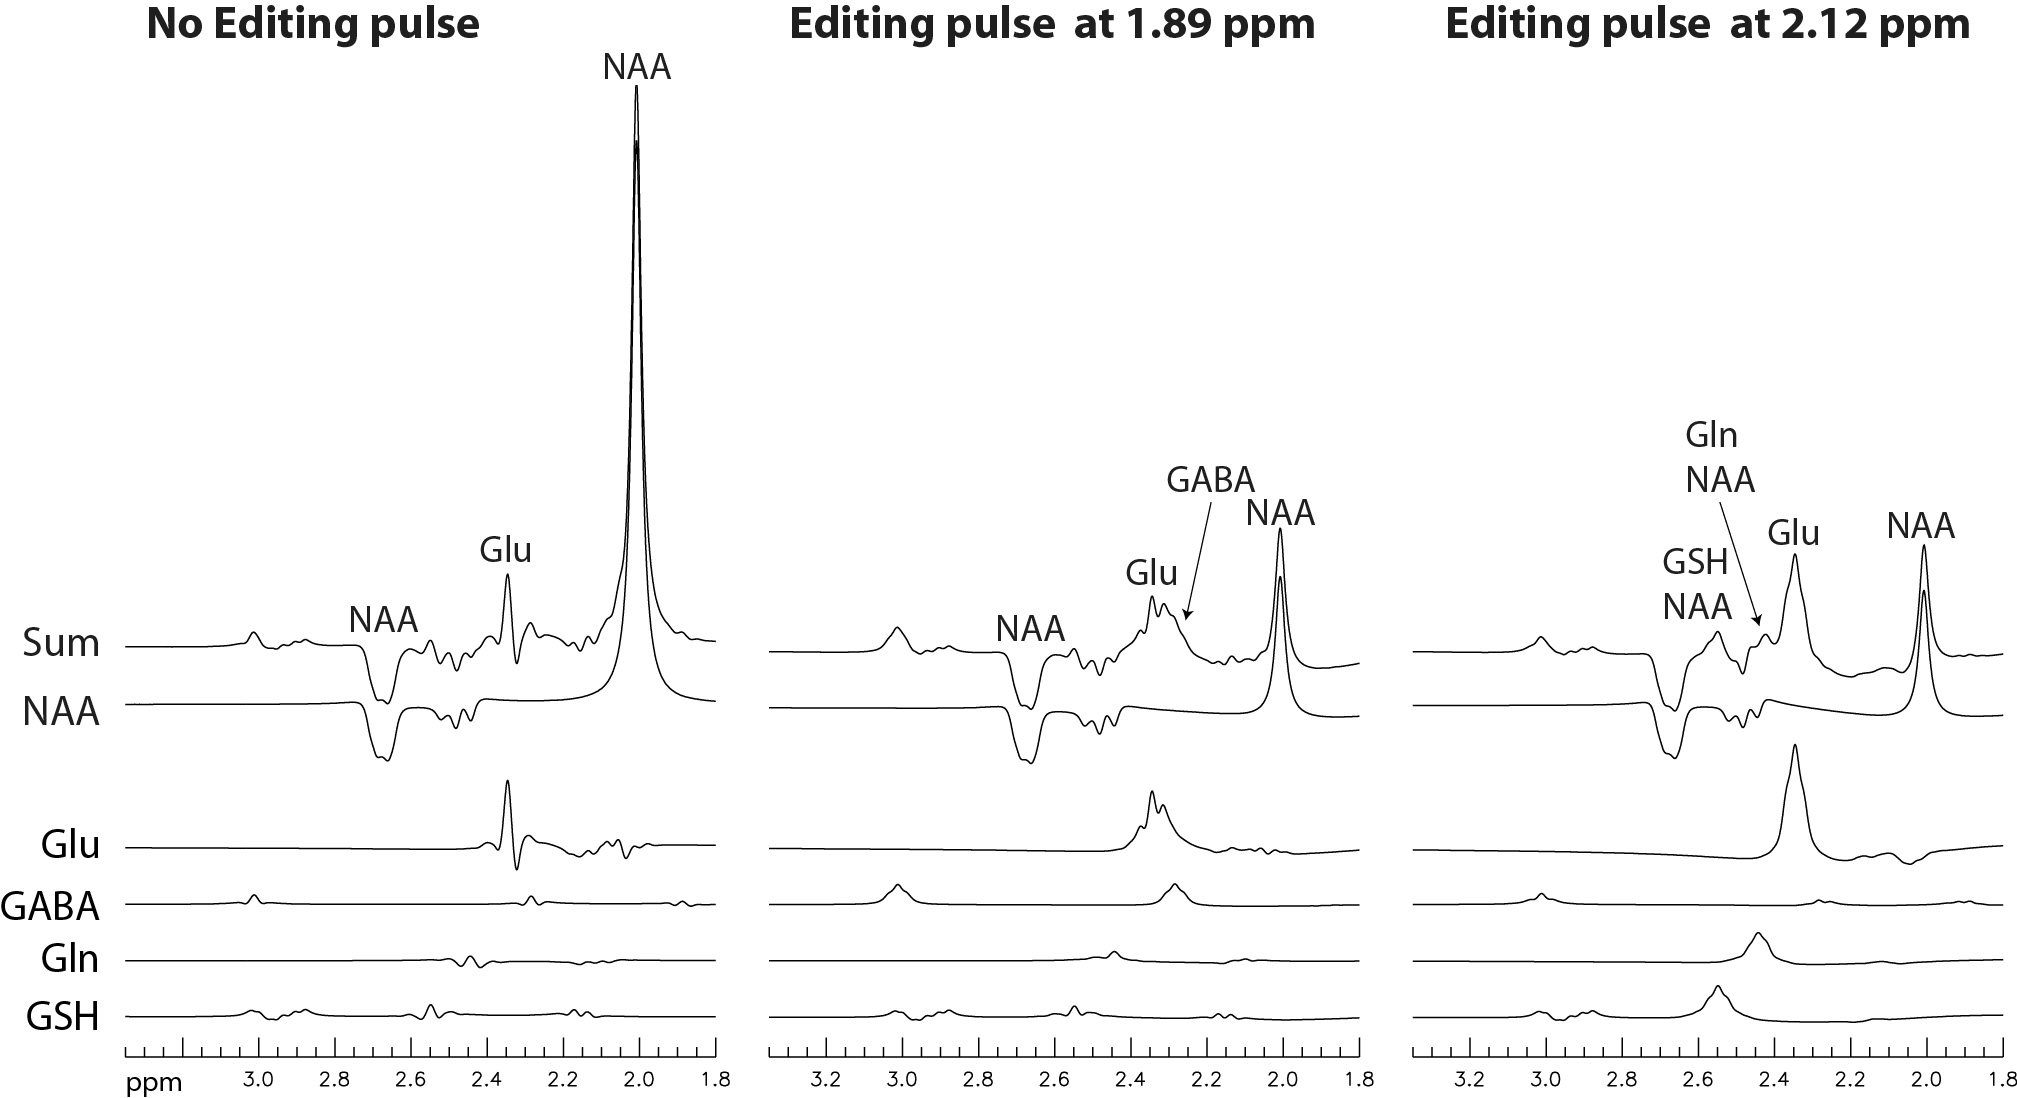
As shown in Fig. 1, the pulse sequence was a point resolved spectroscopy (PRESS) sequence with an editing RF pulse between the two 180° refocusing pulses. The editing pulse was a truncated Gaussian pulse with a duration of 10 ms and had three different settings: OFF, ON at 1.89 ppm, and ON at 2.12 ppm. These three different settings were used in an interleaved order during MRS data acquisition. Using full density matrix simulations with high spatial digitization (4), we found that at TE = 56 ms, TE1 = 40 ms, and Td = 15.3 ms, the glutamate peak at 2.34 ppm, the glutamine peak at 2.44 ppm, and the glutathione peak at 2.54 ppm were all sharp and high when the editing pulse was ON at 2.12 ppm (Fig. 2, right column). Meanwhile, both GABA peaks at 2.28 and 3.01 ppm were sharp and high when the editing pulse was ON at 1.89 ppm (Fig. 2, middle column).
Five healthy volunteers were scanned on a Siemens 7 T scanner equipped with a 32-channel receiver head coil. For each subject, MRS data were collected twice using the proposed pulse sequence from a 2 × 2 × 2 cm3 voxel in the grey matter dominant region of pregenual anterior cingulate cortex (pgACC). The collected 32-channel free induction decay (FID) data were combined into single-channel FIDs and Fourier transformed into the frequency domain to obtain spectra for all 72 data averages. Bloch-Siegert phase shifts caused by the single editing pulse were corrected by multiplying the spectra with the complex-conjugate of the phasor functions (Fig. 3) which were computed using density matrix simulations of the localized voxel. Frequency drift history due to system instability and subject motion was determined by fitting the total creatine (tCr) and total choline (tCho) peaks. The corrected spectra were separately averaged into three spectra, corresponding to the three different settings of the editing pulse. These three spectra were fitted simultaneously in the range of 1.8 – 3.35 ppm by linear combinations of the basis functions using an in-house developed fitting program. When computing the basis functions of the metabolites, the effects caused by the frequency drifts were corrected (5) and the Bloch-Siegert phase shifts were also removed.
RESULTS
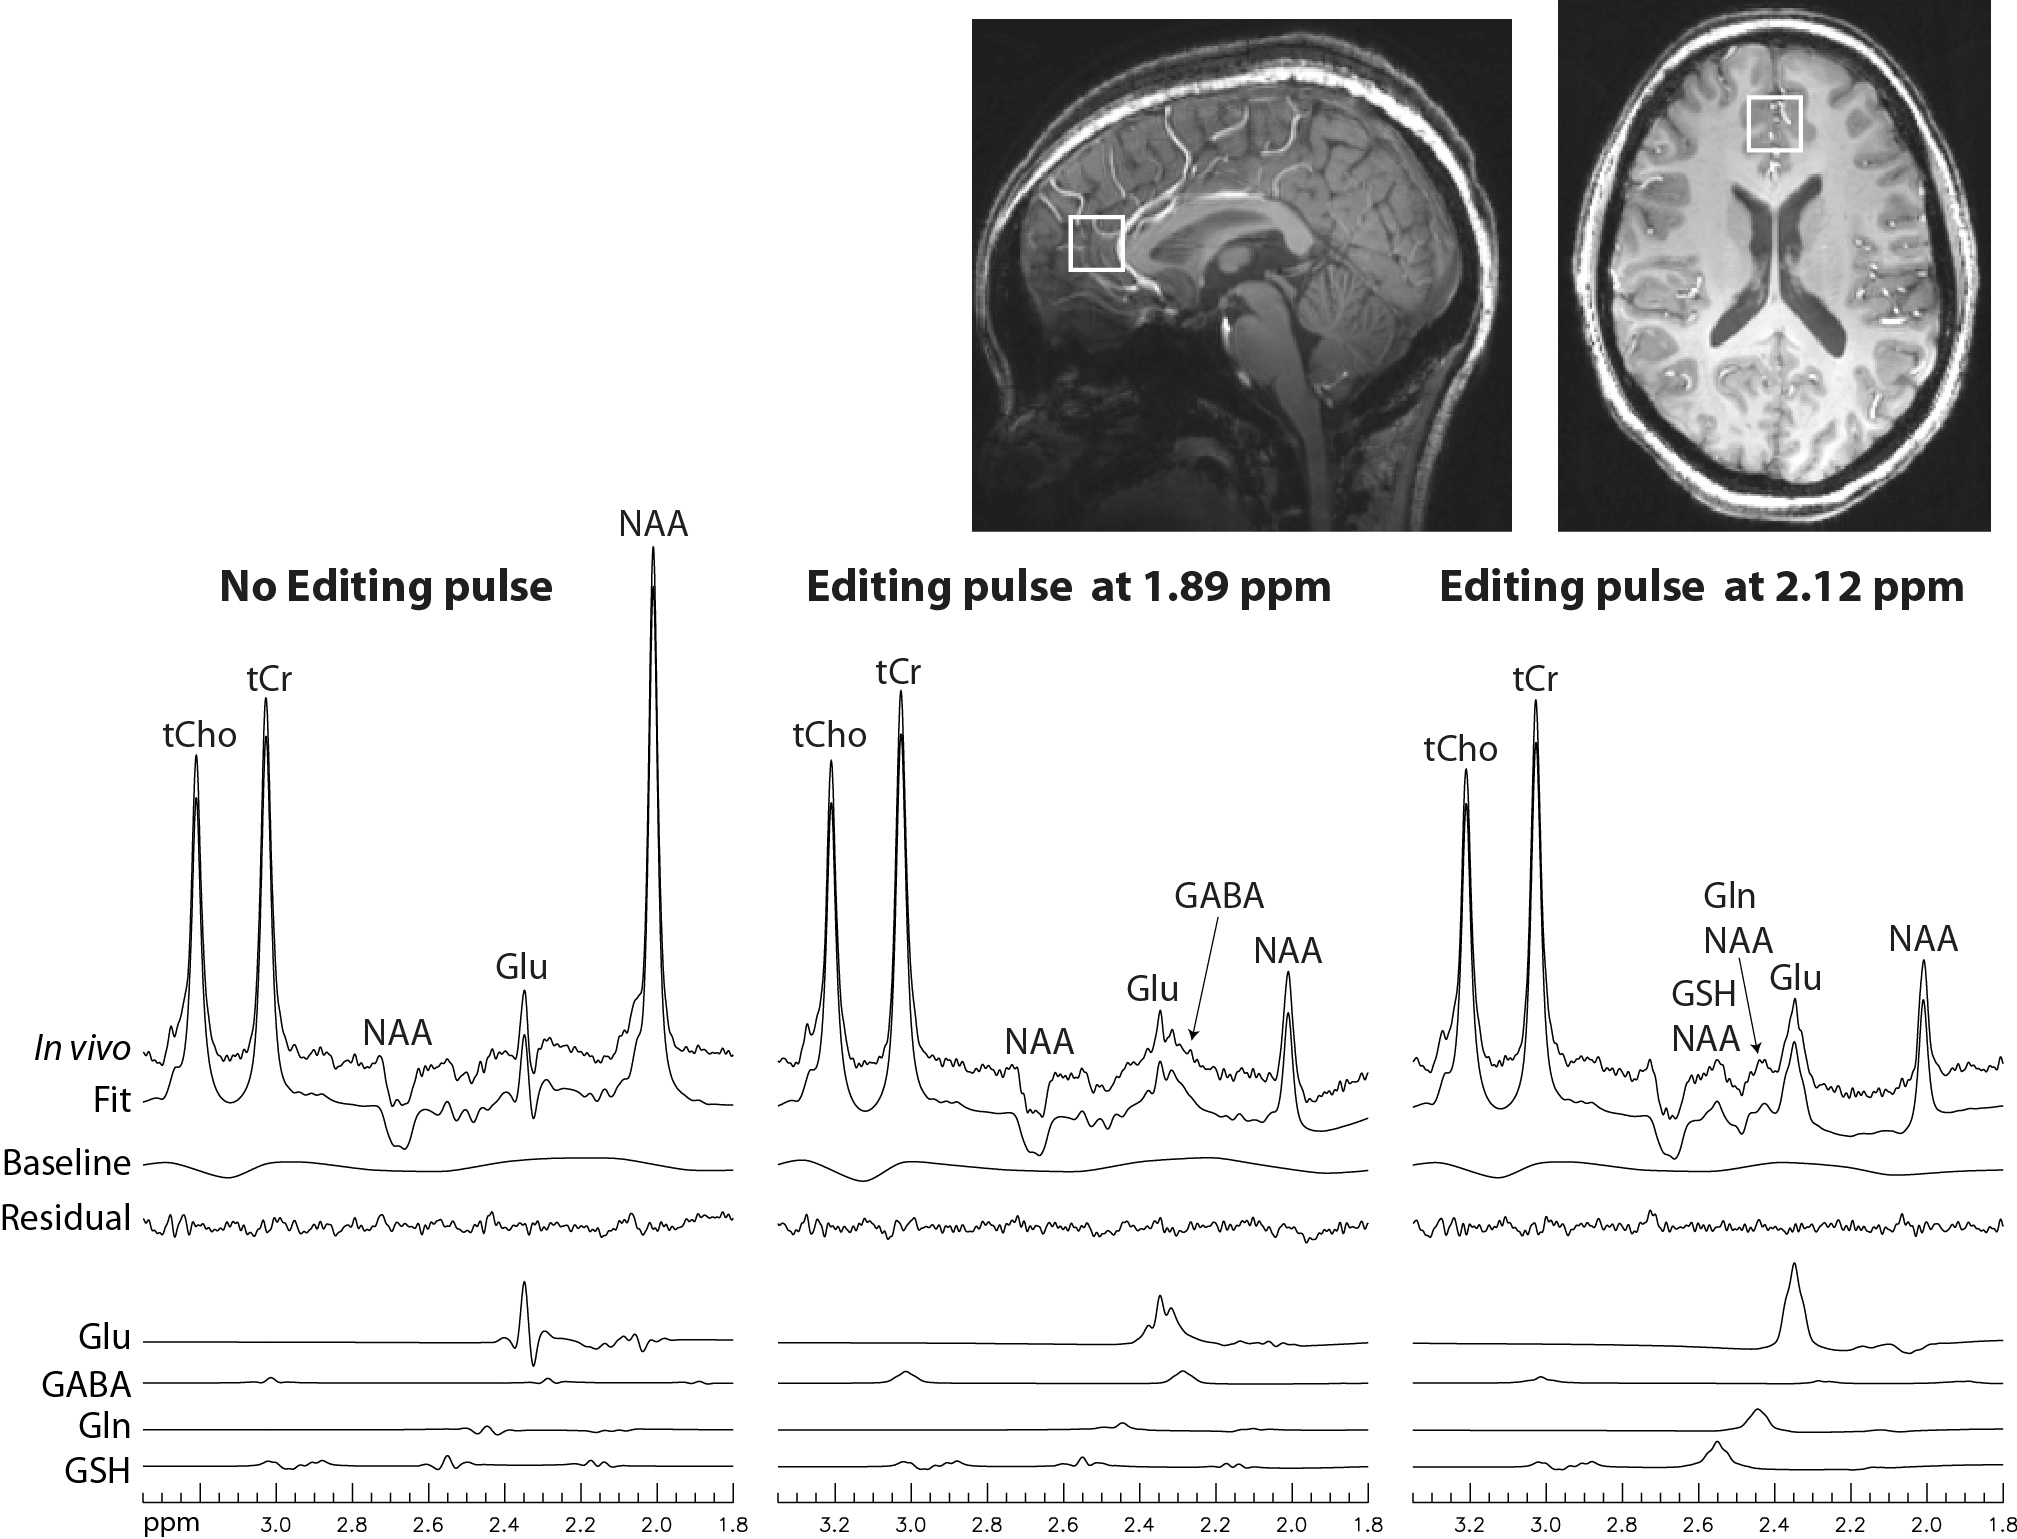
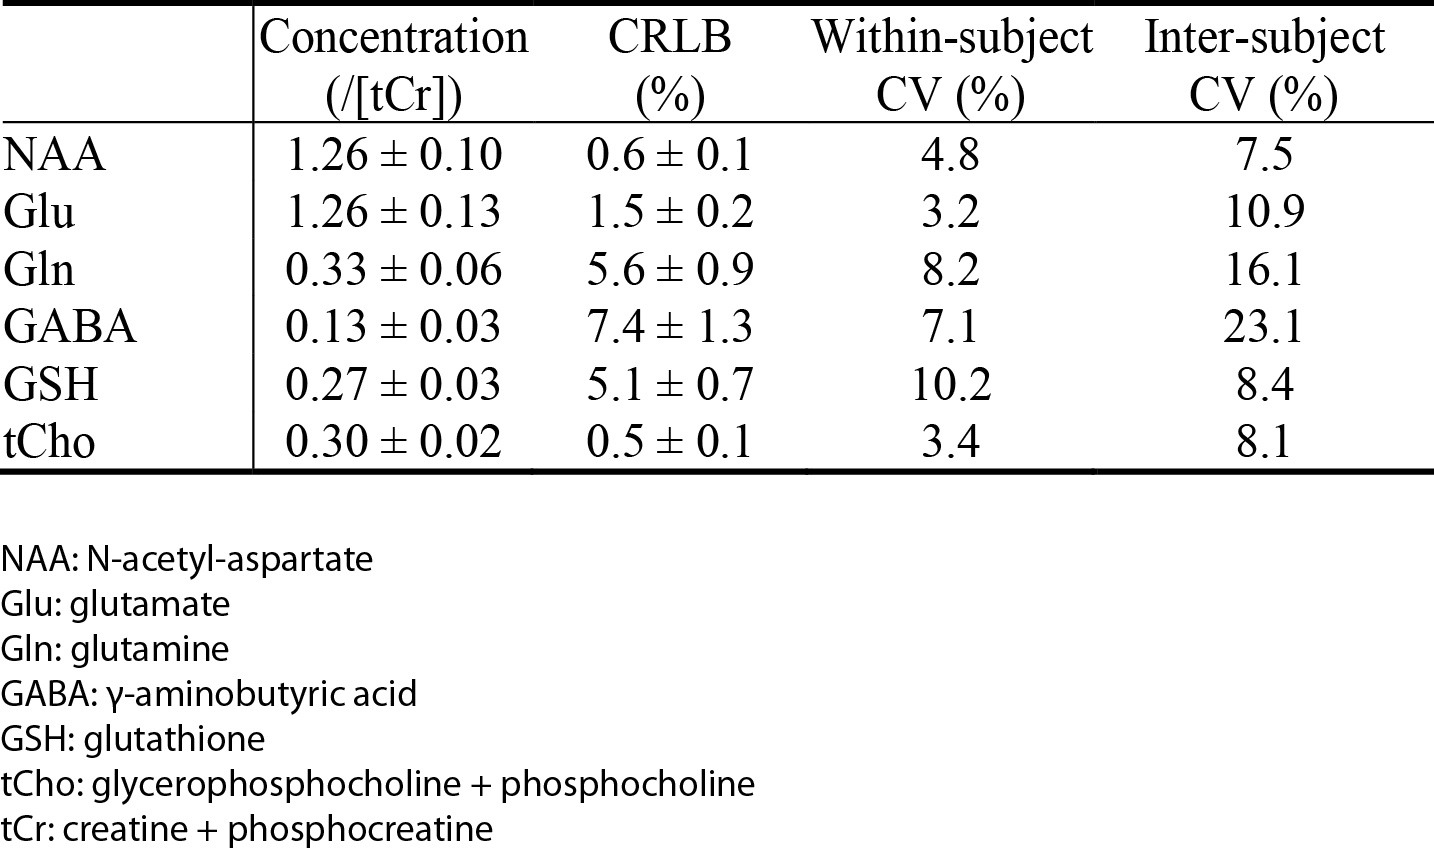
Reconstructed spectra and corresponding fits of one healthy volunteer are displayed in Fig. 4. The fits match the in vivo spectra very well and the fit residuals are small. The glutamine peak at 2.44 ppm is visually distinguishable from the glutamate peak in the in vivo spectrum with editing ON at 2.12 ppm (right column). In the in vivo spectrum with editing ON at 1.89 ppm (middle column), the GABA peak at 2.28 ppm lies on the right shoulder of the glutamate peak. The amplitude of the GABA peak at 2.28 ppm reaches about 1/3 of the glutamate peak amplitude, which is favorable for reliable quantification of GABA. As given in Table 1, the Glu/tCr, Gln/tCr, GABA/tCr, and GSH/tCr ratios were found to be 1.26 ± 0.13, 0.33 ± 0.06, 0.13 ± 0.03, and 0.27 ± 0.03, respectively; the corresponding within-subject CVs were found to be of 3.2%, 8.2%, 7.1%, and 10.2%, respectively; the corresponding inter-subject CVs were found to be of 10.9%, 16.1%, 23.1%, and 8.4%, respectively.DISCUSSION AND CONCLUSION
A novel spectral editing approach was proposed to simultaneously measure glutamate, glutamine, GABA, and glutathione. By using a single editing pulse, a relatively short TE of 56 ms was achieved. The main targets of the signal detection were the H2 and H4 protons of GABA and the H4 protons of glutamate, glutamine, and the glutamyl moiety of glutathione. No motion-sensitive data subtraction was required. Instead, frequency drifts due to subject motion and system instability were recorded and corrected in data fitting. Concentrations of glutamate, glutamine, GABA, and glutathione were measured from a 2 x 2 x 2 cm3 voxel in vivo in less than 4.5 min with high precision.Acknowledgements
This work was supported by the intramural programs of the NIH and NIMH.References
- Wong CGT, Bottiglieri T, Snead OC. GABA, gamma-hydroxybutyric acid, and neurological disease. Annals of Neurology 2003;54:S3-S12.
- Ramadan S, Lin A, Stanwell P. Glutamate and glutamine: a review of in vivo MRS in the human brain. Nmr in Biomedicine 2013;26(12):1630-1646.
- Dringen R, Brandmann M, Hohnholt MC, Blumrich EM. Glutathione-Dependent Detoxification Processes in Astrocytes. Neurochemical Research 2015;40(12):2570-2582.
- Zhang Y, An L, Shen J. Fast computation of full density matrix of multispin systems for spatially localized in vivo magnetic resonance spectroscopy. Medical Physics 2017;44(8):4169-4178.
- van der Veen JW, Marenco S, Berman KF, Shen J. Retrospective correction of frequency drift in spectral editing: The GABA editing example. Nmr in Biomedicine 2017;30(8).
Figures