3957
Assessment of tumors aggressiveness in papillary thyroid cancer (PTC) using DCE-MRIRamesh Paudyal1, Yonggang Lu2, Vaios Hatzoglou3, David Aramburu Nunez1, Andre Moreira4, Yousef Mazaheri1,3, Mithat Gonen5, Joseph O. Deasy1, Ashok Shaha6, R. Michael Tuttle7, and Amita Shukla-Dave1,3
1Medical Physcis, Memorial Sloan Kettering Cancer Center, New York, NY, United States, 2Radiology, Medical College of Wisconsin, Milwaukee, WI, United States, 3Radiology, Memorial Sloan Kettering Cancer Center, New York, NY, United States, 4Pathology, NYU Langone Medical Center, New York, NY, United States, 5Epidemiology and Biostatistics, Memorial Sloan Kettering Cancer Center, New York, NY, United States, 6Surgery, Memorial Sloan Kettering Cancer Center, New York, NY, United States, 7Medicine, Memorial Sloan Kettering Cancer Center, New York, NY, United States
Synopsis
In this study, pretreatment dynamic contrast enhanced (DCE-MRI) data was analyzed using the Tofts model (TM), extended Tofts model (ETM), and two compartment exchange model (2CXM) to quantify perfusion-related quantitaive imaging metrics in papillary thyroid cancer (PTC) patients. The histopathological features of aggressiveness were used as the standard of reference. The results indicated that the ETM provided better fit among the models. The ETM Ktrans values were able to distinguish between aggressive and non-aggressive tumors. The study concludes that pretreatment perfusion-related metric can be useful biomarkers for stratifying tumor aggressiveness in PTC patients.
Purpose:
Dynamic contrast-enhanced magnetic resonance imaging (DCE-MRI) data can be analyzed using the Tofts model (TM), extended Tofts model (ETM)1 or the general two-compartment exchange model (2CXM)2 to characterize vascular physiology3. When applied to cervix tumors, the 2CXM provided a better fit than the ETM in all patients4 whereas in rheumatoid arthritis the ETM was optimal5. In Stage IV head and neck squamous cell carcinoma patients with nodal disease, the pre-treatment estimates of skewness Ktrans was the strongest predictor of clinical outcome6. Therefore, selecting an appropriate tracer kinetic model is critically important in a DCE-MRI study7. The aims of this study were to: i) present estimates of the quantitative imaging metrics obtained with the TM, ETM, and 2CXM and determine an optimal model and ii) assess tumor aggressiveness with histopathological features in papillary thyroid cancer (PTC).Materials and Methods:
Our institutional review board approved this retrospective study. Eighteen patients (median age: 40 years, Male/Female: 6/12) with biopsy-proven PTC underwent pretreatment MRI studies on a GE 3T discovery 750 scanner with an 8-channel neurovascular phased-array coil before surgery. DCE-MRI scans were performed after anatomical T1/T2-weighted scans. A 3D-SPGR pulse sequence with multiple flip angles of 5°, 15° and 30° was used for the measurement of precontrast T1. The dynamic series before, during, and after the injection of a contrast agent (e.g., Gd-DTPA) was acquired with matrix = 256 X 128, field of view = 18-22 cm, TR/TE = 5.7/1.7 ms, phases = 50, NEX = 1, slices = 4-8, slice thickness = 5 mm, flip angle = 15°. The contrast agent (CA) was administered after acquisition of the sixth dynamic volume by antecubital vein catheters at a bolus of 0.1 mmol/kg and rate of 2 cc/s followed by saline flush. An arterial input function was extracted from the carotid artery. Regions of interest (ROIs) were drawn on the tumor by an experienced neuroradiologist using ImageJ. The ROIs were then exported to in-house MATLAB software for further analysis. The surgical tumor specimen was obtained from patients who underwent surgery after the MRI was reviewed by an experienced pathologist. Tumor aggressiveness was evaluated individually using the following six histopathologic features: tall cell variant, necrosis, vascular and/or tumor capsular invasion, extrathyroidal extension (ETE), regional metastases, and distant metastases8. For each ROI and/or voxel analysis, concentration-time curves were analyzed using the TM (i.e., Ktrans and ve), ETM (i.e., Ktrans, ve and vp), and 2CXM (i.e.,Fp, PS, ve and vp). To examine the fitting performance of each model the corrected Akaike information criterion (AICc) value was calculated. A Pearson correlation was used to examine the relationship between all comparable parameters. The Wilcoxon Rank-Sum test was used to compare models, all comparable metrics, and metrics of PTC patients with and without features of tumor aggressiveness.Results:
A representative PTC patient (female, 36 years) T1w image with ETE is shown in Figure 1.A. An example of arterial input function obtained from this patient is shown in Figure1.B. The Figure 1.C plot illustrates the time concentration data fitted with the TM, ETM and 2CXM. Table 1 shows the quantitative imaging metrics and AICc values (mean ±SD) obtained from the TM, ETM and 2CXM. The calculated mean value of plasma mean transit time from the 2CXM was 6.0 s. Figure 2 displays the parametric maps overlaid on a precontrast T1w image from the same representative patient for the TM, ETM and 2CXM (top to bottom). Fp (min-1) and PS (min-1) values were highly correlated with Ktrans (min-1) values returned by the TM (r = 0.94, p < 0.00001 for Fp and r = 0.93, p < 0.00001 for PS) and the ETM (r = 0.94, p < 0.00001 for Fp and r = 0.93, p < 0.00001 for PS). Table 2 shows tumor ROI mean metric values (mean ± SD) obtained with the TM, ETM and 2CXM for PTC patients with ETE and without ETE (no ETE). Box plots comparing the tumors ROI mean values (Figure 3) obtained from PTC patients with ETE and without ETE returned by the TM, ETM, and 2CXM. Fp, PS, and Ktrans were significantly different between PTC with ETE and without ETE (p < 0.05). The parameters ve and vp did show a trend towards the difference between ETE and without ETE PTC.Discussion:
The mean AICc value indicated that the ETM provided better fits among the models. The mean ETM Ktrans values were able to differentiate between aggressive and non-aggressive tumors in PTC patients.Conclusion:
Taken together, these results suggest that the ETM is more suitable to stratify PTC patients.Acknowledgements
This work was supported by NIH grant R21CA176660-01A1 and in part through the NIH/NCI Cancer Center Support Grant: P30 CA008748.References
1. Tofts PS, Brix G, Buckley DL, Evelhoch JL, Henderson E, Knopp MV, et al. Estimating kinetic parameters from dynamic contrast-enhanced T(1)-weighted MRI of a diffusable tracer: standardized quantities and symbols. Journal of magnetic resonance imaging : JMRI. 1999;10(3):223-32. 2. Sourbron S, Ingrisch M, Siefert A, Reiser M, Herrmann K. Quantification of Cerebral Blood Flow, Cerebral Blood Volume, and Blood-Brain-Barrier Leakage with DCE-MRI. Magnetic resonance in medicine. 2009;62(1):205-17. doi: 10.1002/mrm.22005. 3. Mills SJ, du Plessis D, Pal P, Thompson G, Buonacorrsi G, Soh C, et al. Mitotic Activity in Glioblastoma Correlates with Estimated Extravascular Extracellular Space Derived from Dynamic Contrast-Enhanced MR Imaging. Am J Neuroradiol. 2016;37(5):811-7. doi: 10.3174/ajnr.A4623. 4. Donaldson SB, West CM, Davidson SE, Carrington BM, Hutchison G, Jones AP, et al. A comparison of tracer kinetic models for T1-weighted dynamic contrast-enhanced MRI: application in carcinoma of the cervix. Magnetic resonance in medicine. 2010;63(3):691-700. doi: 10.1002/mrm.22217. 5. Ledsam JR, Hodgson R, Moots RJ, Sourbron SP. Modeling DCE-MRI at low temporal resolution: a case study on rheumatoid arthritis. Journal of magnetic resonance imaging : JMRI. 2013;38(6):1554-63. doi: 10.1002/jmri.24061. 6. Shukla-Dave A, Lee NY, Jansen JFA, Thaler HT, Stambuk HE, Fury MG, et al. Dynamic Contrast-Enhanced Magnetic Resonance Imaging as a Predictor of Outcome in Head-and-Neck Squamous Cell Carcinoma Patients with Nodal Metastases. Int J Radiat Oncol. 2012;82(5):1837-44. doi: 10.1016/j.ijrobp.2011.03.006. 7. Sourbron SP, Buckley DL. On the scope and interpretation of the Tofts models for DCE-MRI. Magnetic resonance in medicine. 2011;66(3):735-45. doi: 10.1002/mrm.22861. 8. Lu Y, Moreira AL, Hatzoglou V, Stambuk HE, Gonen M, Mazaheri Y, et al. Using diffusion-weighted MRI to predict aggressive histological features in papillary thyroid carcinoma: a novel tool for pre-operative risk stratification in thyroid cancer. Thyroid : official journal of the American Thyroid Association. 2015;25(6):672-80. doi: 10.1089/thy.2014.0419.Figures
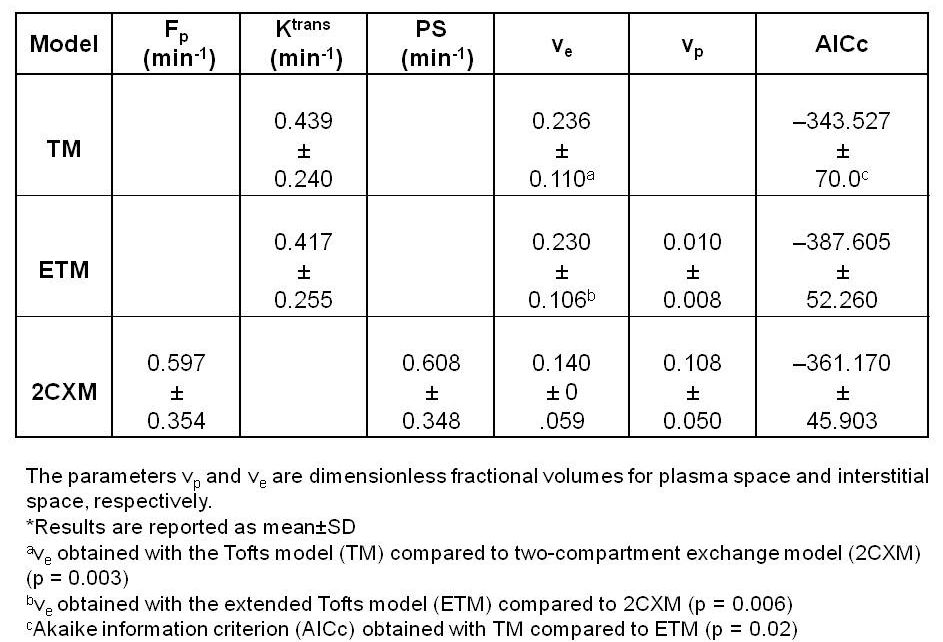
Table 1.
Summary of values of quantitative
imaging metrics and AICc from the three models *
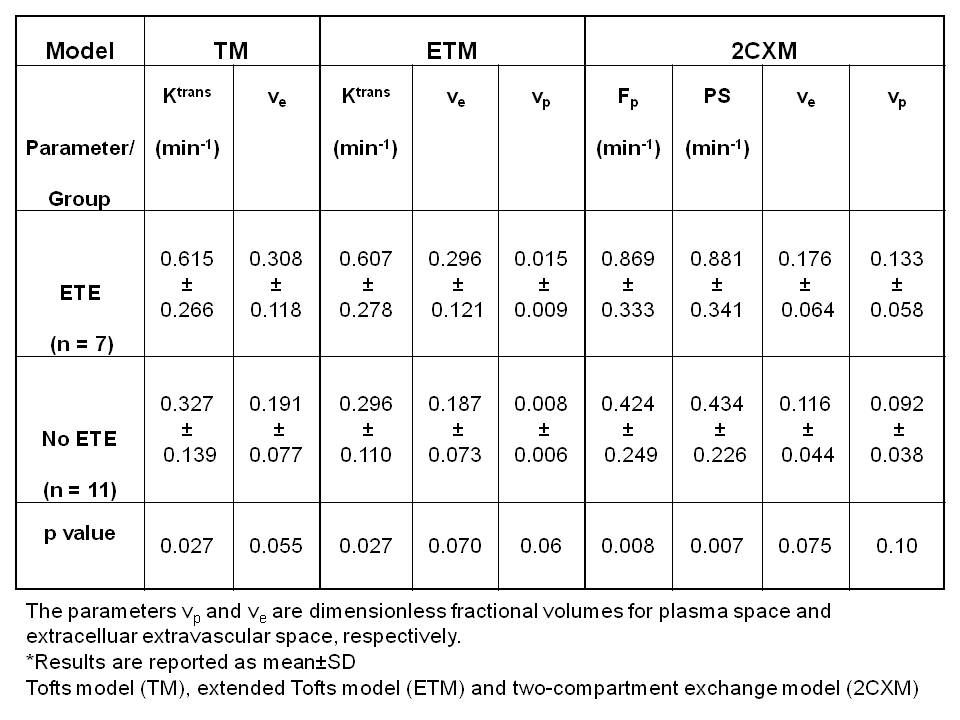
Table 2. Summary of quantitive imaging
metric values for patients with extrathyroidal extension (ETE) and without
extrathyroidal extension (no ETE) from three models*
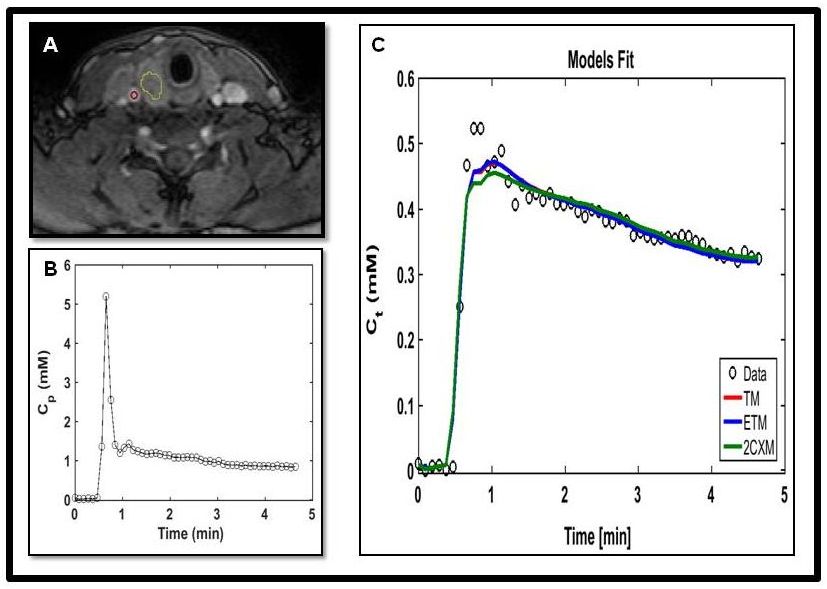
Figure 1. A. Representative T1-weighted
image within a dynamic scan at the late postcontrast phase obtained from a papillary thyroid cancer patient with extrathyroidal extension (36
years, female). Regions of interest were drawn on a tumor (yellow line) and a
carotid artery (red circle). B. A representative
arterial input function extracted from a ROI within the carotid. C.
The time course of tissue concentration of contrast agent curve from a ROI
within the tumor. Data are shown in circles (black), best fit to the Tofts
model (TM) in red, extended Tofts model (ETM) in blue and two-compartment
exchange model (2CXM) in green.
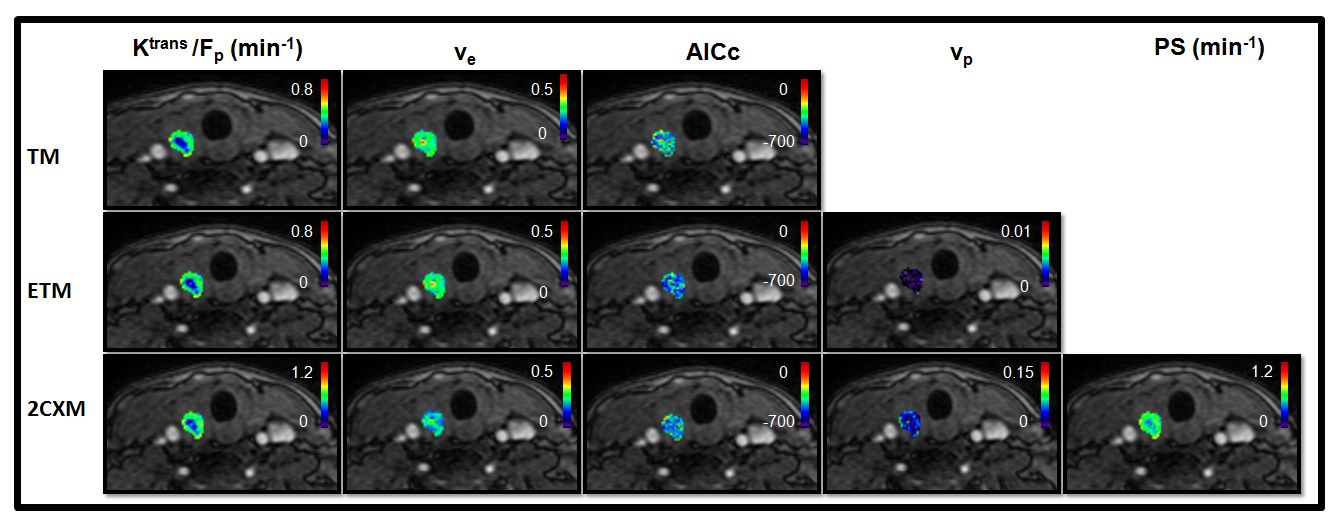
Figure 2. An example of the quantitative
imaging metrics (i.e., Ktrans [min-1], ve, vp, Fp [min-1],
and PS [min-1]) and Akaike information criterion (AICc) parametric maps overlaid on the precontrast T1-weighted
images from the same representative papillary
thyroid cancer patient with
extrathyroidal extension (female, 36 years). The parametric maps are returned
by the Tofts model (TM), extended Tofts model (ETM), and two-compartment
exchange model (2CXM) (top to bottom).

Figure 3: Boxplots comparing metric values estimated
with the Tofts model (TM), extended Tofts model (ETM), and two-compartment
exchange model (2CXM) (top to bottom). Each box plot shows minimum, first
quartile, median (black line), third quartile, and maximum values. Top row: TM
Ktrans (min-1) and ve. Middle row: The ETM Ktrans
(min-1), ve and vp. Bottom row: The 2CXM Fp
(min-1) and PS (min-1), ve and vp.
Ktrans, estimated with the TM and ETM and Fp and PS,
obtained with the 2CXM showed a significant difference between with ETE and
without ETE (p < 0.05).