3956
Hypoxia in Rat Prostate Tumors: Correlation of BOLD/TOLD MRI with [18F]FMISO PET1Radiology, UT Southwestern Medical Center, Dallas, TX, United States, 2AIM Center, Children's Health, Dallas, TX, United States, 3Clinical Cooperation, German Cancer Research Center, Heidelberg, Germany
Synopsis
18F-fluoromisonidazole ([18F]FMISO) has been exploited in positron emission tomography (PET) as an imaging radiotracer for tumor hypoxia. The accumulation of [18F]FMISO must depend on both hypoxia and perfusion. In this study, we investigated [18F]FMISO activity in the AT1 tumor rat model and found that [18F]FMISO produced conflicting results in the poorly perfused hypoxic tumors. The preliminary results indicate that BOLD and TOLD MRI can provide complimentary information for interpretation of the [18F]FMISO results.
Introduction
Hypoxia is associated with tumor aggressiveness, metastatic spread and resistance to multiple treatments. 18F-fluoromisonidazole ([18F]FMISO) has been exploited in positron emission tomography (PET) as an imaging radiotracer for tumor hypoxia [1]. However, the accumulation of [18F]FMISO must depend on both hypoxia and effective delivery via perfusion. These two factors could lead to conflicting results. Blood-oxygen-level-dependent (BOLD) and tissue-oxygen-level-dependent (TOLD) MRI assess the oxygenation in vasculature and tissue, respectively, through the endogenous paramagnetic contrast caused by deoxyhemoglobin and molecular oxygen. Measurement of BOLD and TOLD with an oxygen breathing intervention can provide information of oxygen delivery [2]. Dunning prostate R3327-AT1 tumor is an anaplastic, fast growing tumor subline, which has been reported to show extensive hypoxia [3]. Using the AT1 tumor rat model, we compared [18F]FMISO uptake with BOLD and TOLD MRI.Methods
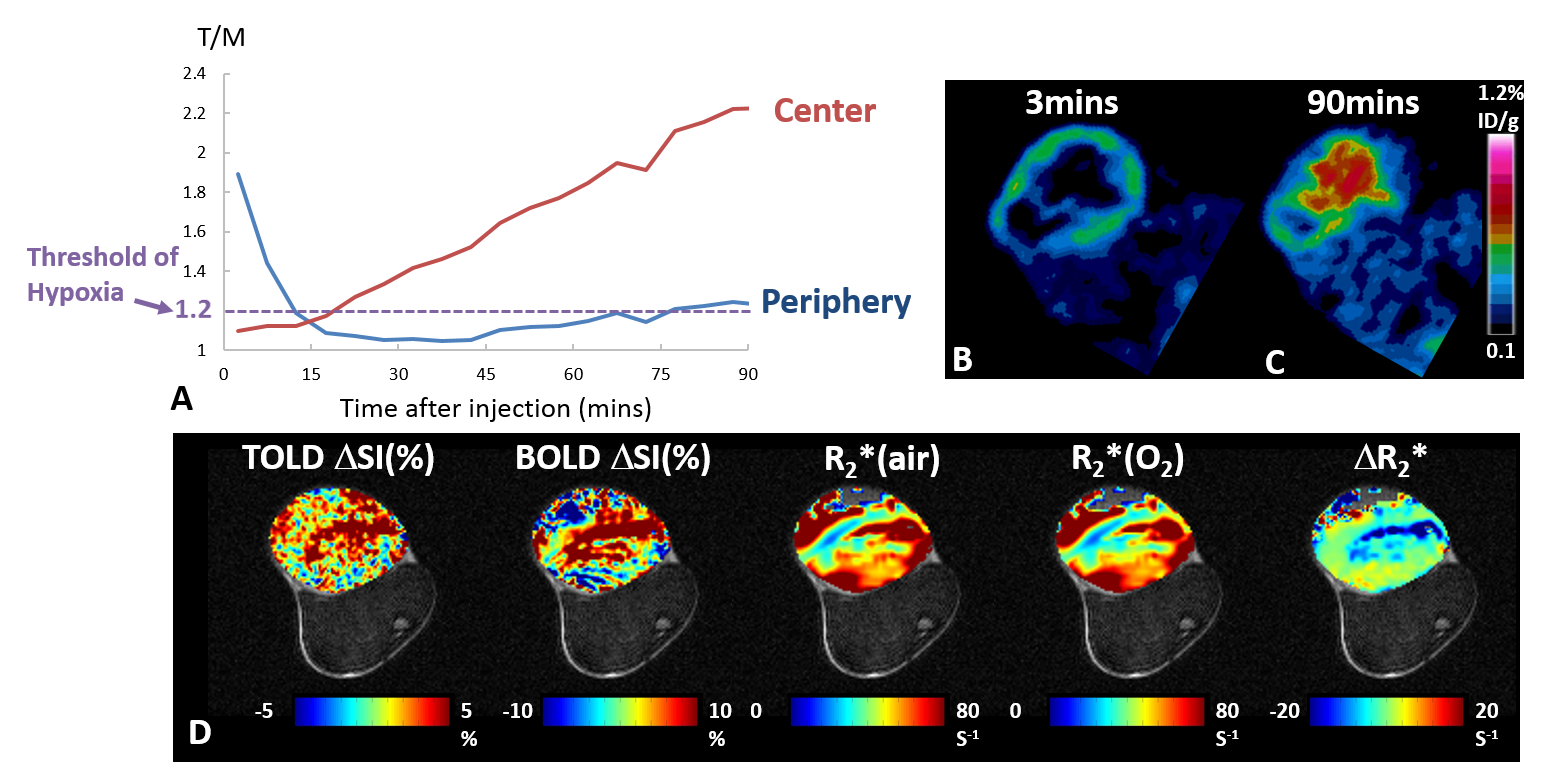
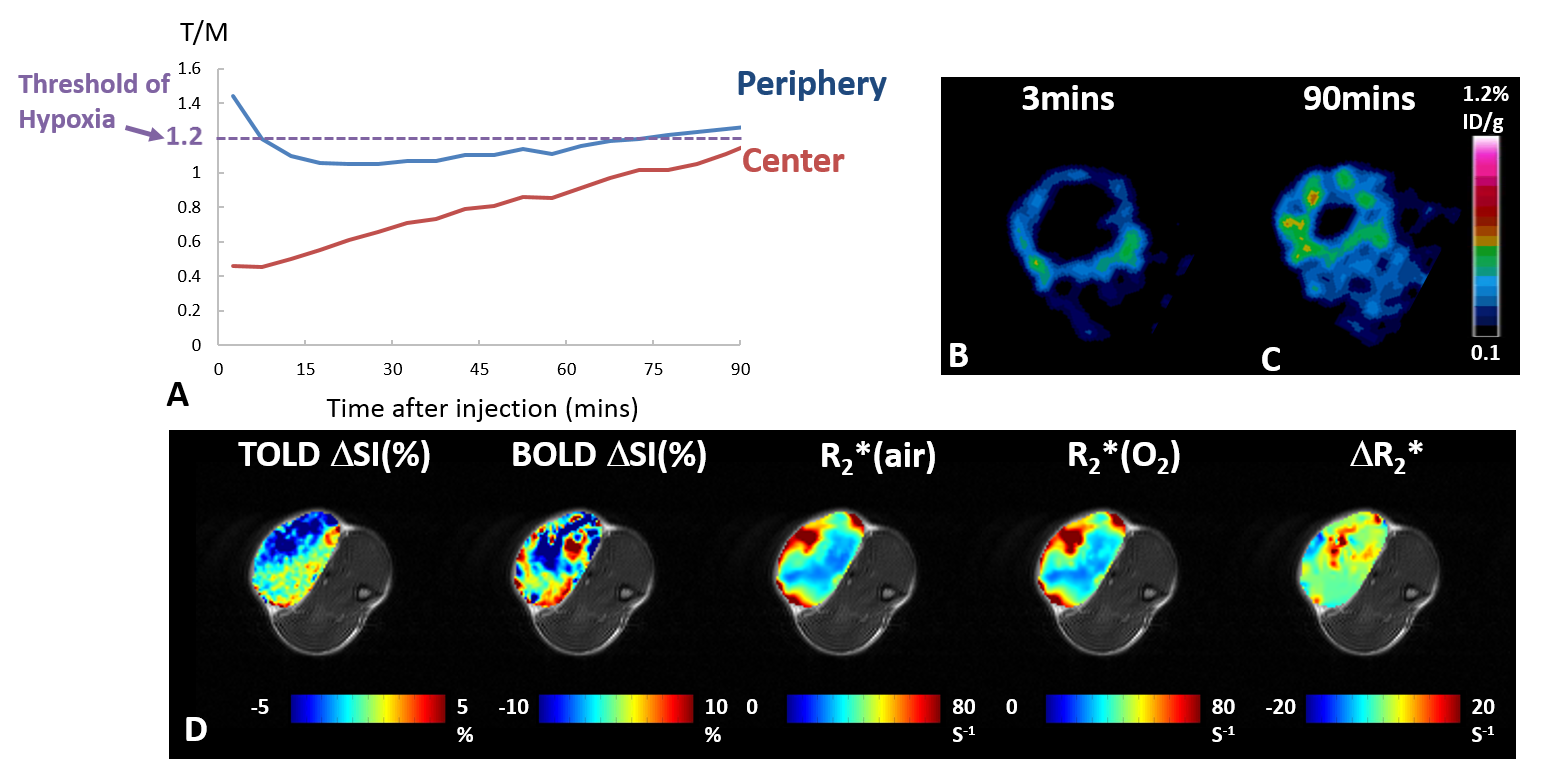
AT1 tumors were implanted subcutaneously in five adult male Copenhagen rats. MRI was performed using a horizontal bore 4.7-T magnet with homebuilt 3.5-cm diameter single-turn solenoid volume coil. Animals were anesthetized with isoflurane and kept warm using a circulating warm water blanket. Interleaved BOLD (multi-echo gradient echo; TR = 150 ms, ten echo times from 6 to 69 ms, flip angle = 20°) and TOLD (gradient echo; TR/TE = 30/5 ms, flip angle = 45°) measurements were acquired with an oxygen challenge (from air to 100% O2). PET studies were performed on a Siemens Inveon Multimodality PET/CT scanner. Each rat was injected with [18F]FMISO (570-600 µCi in 200 µl saline) via tail vein. Immediately after the injection, a dynamic PET scan was initiated and continued for 90 min. Animals were then sacrificed for pimonidazole staining. Measurements in tumor center (defined as 60% of tumor diameter in the center) and periphery (the outer ring) were investigated for both MRI and PET data. The PET “hypoxia threshold” was defined as [18F]FMISO %ID/g tumor to muscle ratio (T/M) > 1.2 (%ID/g: percentage injected dose per body weight), as suggested in previous studies [1].Results and Discussion
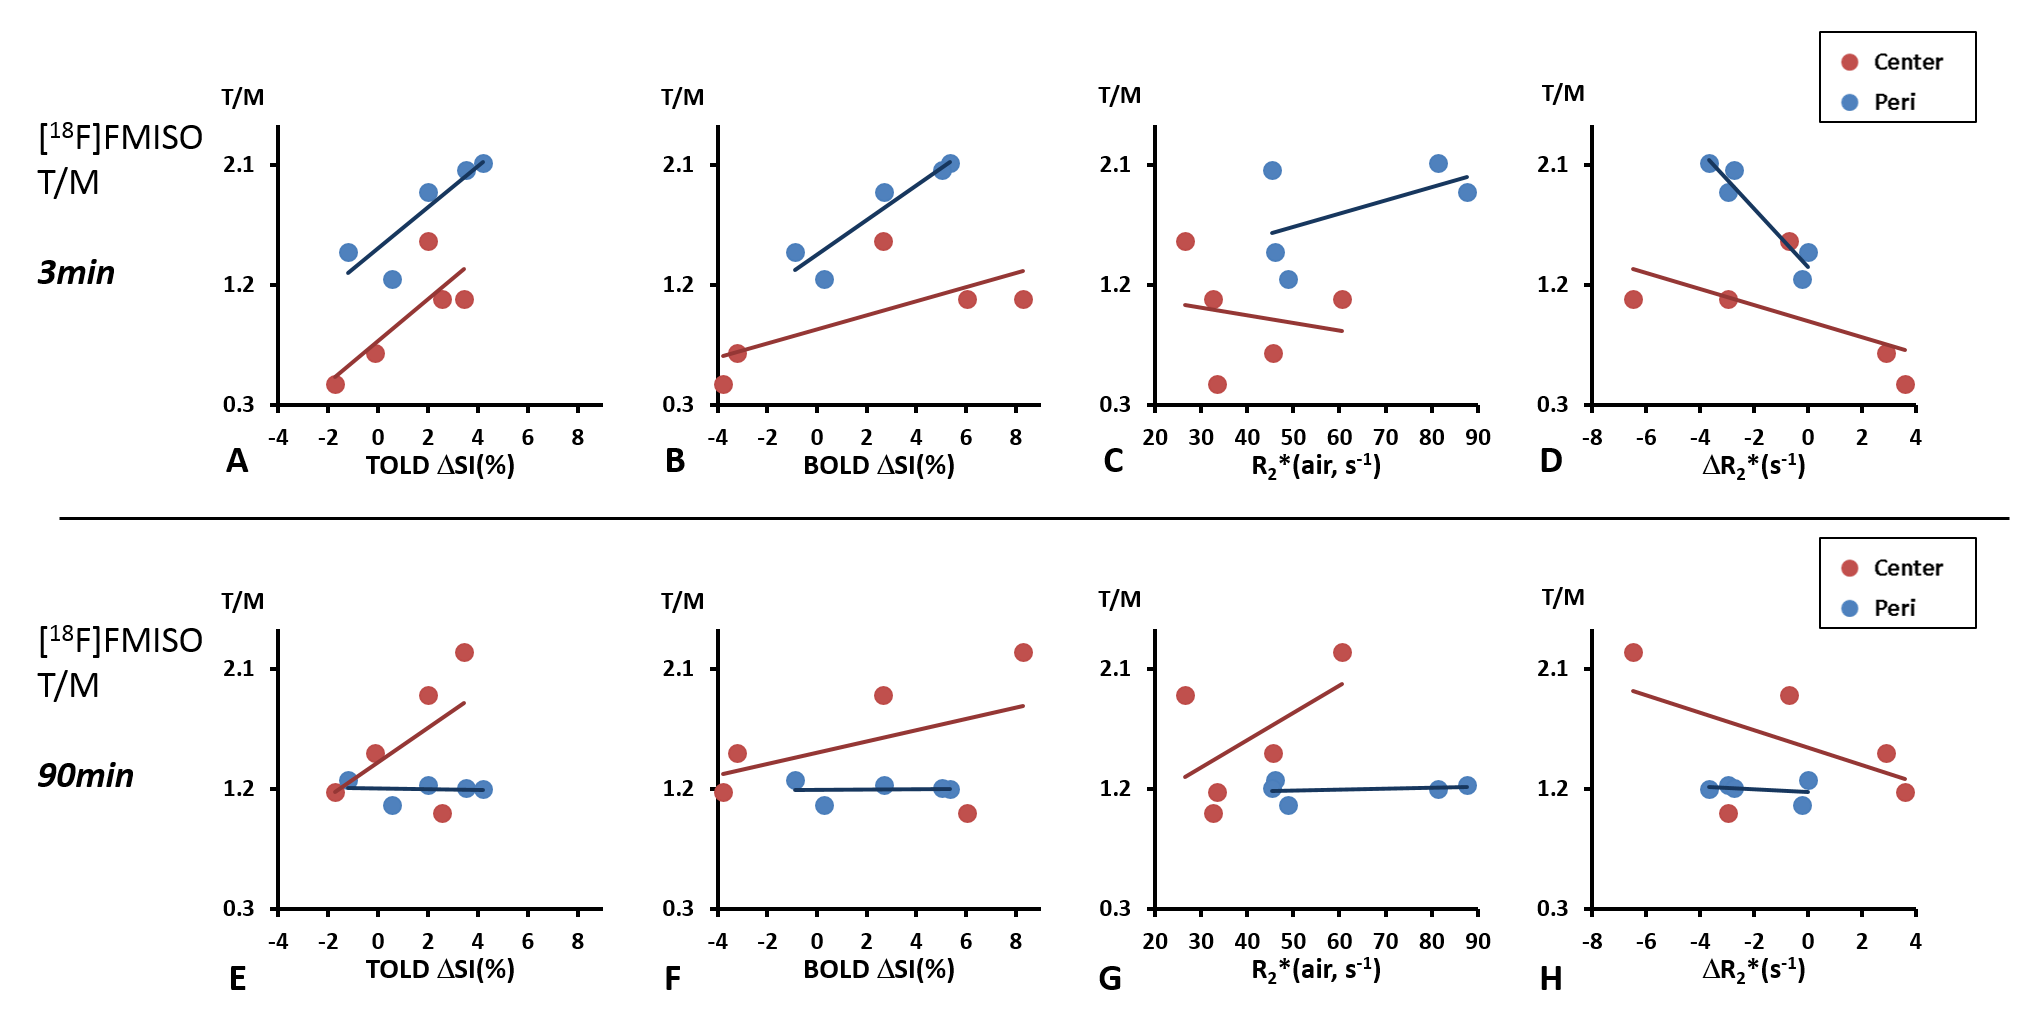
Pimonidazole immunohistological staining revealed extensive hypoxia in the AT1 tumors as expected. High [18F]FMISO activity was observed in the tumor periphery immediately after injection, showing a ring enhancement pattern. This peripheral enhancement decreased rapidly in all the tumors, though eventually stabilized above the hypoxia threshold for 4 out of 5 tumors. The activity in the tumor center increased gradually for 90 min exhibiting a different pharmacokinetic behavior compared to tumor periphery. In the tumors with sufficient perfusion (a representative case shown in Fig. 1), [18F]FMISO PET showed measurements consistent with the hypoxia distribution. Both tumor periphery and center reached the hypoxia threshold at 90 min with much greater accumulation in the center than periphery. BOLD and TOLD MRI of this tumor showed positive responses in ΔSI(%) and negative response in R2* upon oxygen breathing challenge, all consistent with the characteristic of efficient oxygen delivery. However, in tumors with large non-perfused areas, [18F]FMISO PET showed conflicting results (a representative case shown in Fig. 2). The accumulation of [18F]FMISO at 90 min showed a ring of high accumulation in the tumor periphery but minimal uptake in the tumor center, which was likely due to lack of perfusion/delivery to this region. This tumor was not responsive to oxygen breathing challenge revealed by BOLD and TOLD. Figure 3 shows correlations between MRI measurements and [18F]FMISO T/M at two time points. Modest to strong correlations were found between [18F]FMISO T/M at 3 min and TOLD ΔSI(%), BOLD ΔSI(%) and ΔR2* (Pearson correlation coefficient |r| ranging from 0.61 to 0.95). Considering that the [18F]FMISO activity at 3 min is perfusion dependent, the strong correlations with MRI parameters responding to oxygen breathing challenge are reasonable. At 90 min, [18F]FMISO T/M in tumor periphery did not correlate with any MRI parameters. However, at 90 min [18F]FMISO T/M in tumor center showed trends between [18F]FMISO T/M and MRI (|r| ranging from 0.45 to 0.55) similar to correlations at 3 min. These results suggest that perfusion limitation, rather than the existence of hypoxia, dominates the [18F]FMISO accumulation in the center of the poorly perfused AT1 tumors.Conclusion
In the poorly perfused hypoxic tumors, [18F]FMISO produced conflicting results. The preliminary findings indicate that BOLD and TOLD MRI can provide complimentary information for interpretation of the [18F]FMISO results.Acknowledgements
Investigations were supported in part by CPRIT RP140285, as well as NCI R01 CA139043, U24 CA126608, P41 EB015908 and P30 CA142543.References
1. Krohn, K.A., et al., J. Nucl. Med., 49, 129S-148S (2008).
2. Hallac, R.R., et al., Magn. Reson. Med., 71, 1863-1873 (2014).
3. Glowa, C., et al., Cancer Lett., 378, 97-103 (2016).
Figures