3953
Comparison of 2D and 3D dynamic contrast enhanced perfusion magnetic resonance imaging in patients with colorectal cancer1Computer Assisted Clinical Medicine, Medical Faculty Mannheim, Heidelberg University, Mannheim, Germany, 2Institute of Clinical Radiology and Nuclear Medicine, Medical Faculty Mannheim, Heidelberg University, Mannheim, Germany
Synopsis
This study investigated the influence of quantitative 3D volume dynamic contrast enhanced-MRI in rectal cancer on perfusion parameters compared to the data obtained by a selecting a single tumor slice as typically performed in clinical routine. Data analysis of five patients showed deviations of up to 28 % for Plasma Flow, 28 % for Plasma Volume and 36 % for Mean Transit Time. An examination of the entire tumor volume is therefore advisable in order to additionally guarantee intra-observer reproducibility.
Introduction
The clinical benefit of magnetic resonance imaging (MRI) is far-reaching and is used both for local staging of primary rectal cancer prior to therapy and for predicting the outcome of treatment.1 Recently, the additional benefit of functional MRI parameters such as quantitative perfusion parameters including plasma flow (PF), plasma volume (PV) or mean transit time (MTT) has become apparent.2 Most perfusion MRI studies currently focus exclusively on one specific slice of the tumor for parameter calculation.3 In contrast to that, we investigated the influence of quantitative 3D volume dynamic contrast enhanced-MRI in rectal cancer on perfusion parameters compared to the data obtained by selecting a single tumor slice. The choice of one particular slice depends on the performing physician, thus whole tumor imaging guarantees a better reproducibility. Furthermore, the examination of several slices enables the determination of the heterogeneity of the tumor. As 3D perfusion MR imaging data is often already available to evaluate volume-resolved quantitative parameters this method could enable the mapping of overall changes in the whole tumor volume resulting in a better treatment prediction.Materials and Methods
Retrospective data analysis of MR perfusion parameters of the pelvis of five patients (5 male, 64 ± 5 years) with rectal cancer was performed. Dynamic contrast enhance (DCE)-MRI data were acquired with a 3 T whole body scanner (Magnetom Skyra, Siemens Healthineers, Erlangen, Germany) using a 3D TWIST sequence and parameters TE/TR/FA=1.44ms/3.6ms/15°, matrix-size=192x117, FoV = 259mmx158mm and 20 slices, covering arteries for AIF and tumor tissue sufficiently. The temporal resolution was 5 seconds and a total of 70 volumes were acquired. Gadolinium-based contrast agent (Dotarem®, Guerbert, France) was injected after 50 seconds, i.e. the 10th volume.
Perfusion quantification was performed as follows: (1) One region of interest (ROI) was chosen in a supplying artery serving as an arterial input function (AIF). (2) One ROI was selected within the tumor volume by a performing physician according to the standard clinical procedure of analyzing DCE-MRI data using the Osirix DICOM viewer (Pixmeo, Geneva, Switzerland). (3) Four additional ROIs were drawn on slices around the selected central tumor slice to delineate the entire tumor volume.
Perfusion parameters (PF, PV, MTT) in the tumor were calculated pixel-wise for each individual slice separately using a 2 compartment uptake model (2CU) implemented in an in-house developed perfusion plugin (UMMPerfusion).4, 5 Additionally, the mean values of areas of the slices within the volume were calculated and the relative deviation of the smallest to the largest area as well as from the single slide chosen in step (2) to the mean area was calculated.
Results
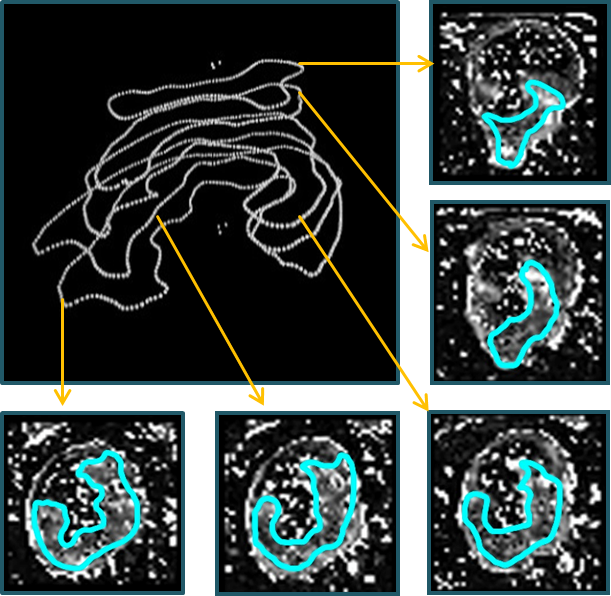
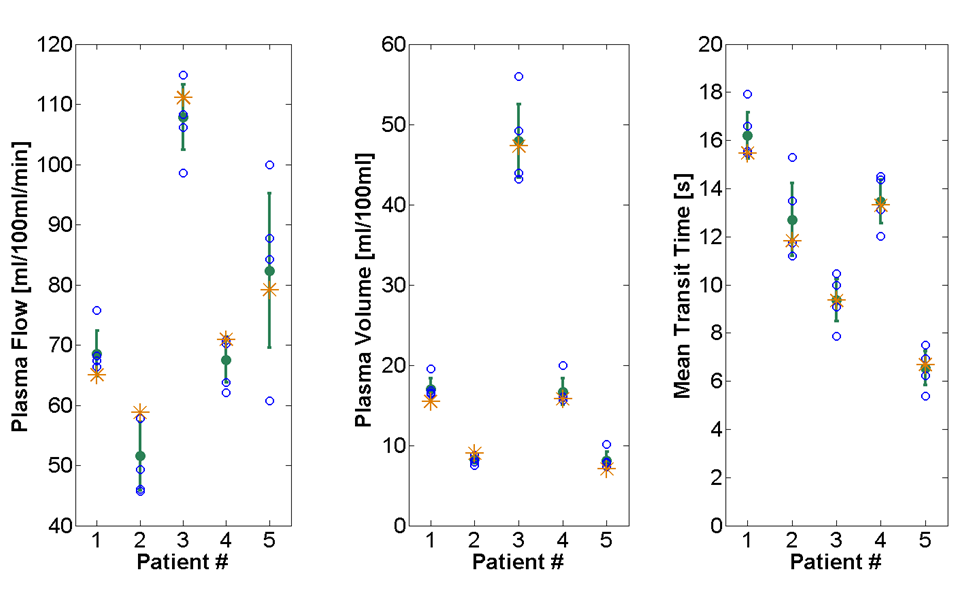
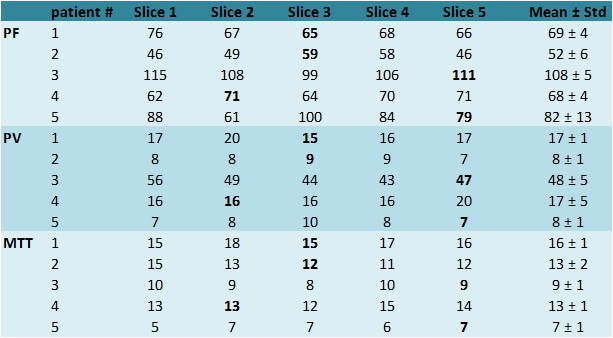
A 3D representation of the tumor volume and the five corresponding slices with pixel-wise calculated perfusion parameters (e.g. PF) of the tumor of an exemplarily chosen patient are shown in Figure 1. The mean tumor size of the single slices for all five patients was (5 ± 2) cm2 and the mean overall tumor volume was (7 ± 2) cm3 (with a slice thickness of 3.6 mm). Visualization of perfusion parameters for all slices (including the single slice delineated by the performing physician) and mean values with standard deviation for all patients are presented in Figure 2 and corresponding values are given in Table 1. Data analysis showed that mean values of the single slice deviate up to 12% for PF, 14% for PV, and 7% for MTT (with 3 of 15 values lying outside the one sigma confidence interval) compared to the perfusion parameters acquired over the whole volume. Furthermore, the deviations between slices with the smallest and largest value in a tumor volume were calculated, which showed even larger deviations from 28% for PF and PV and 36% for MTT.Conclusion
This study demonstrates that perfusion parameters obtained only in a single slice selected by physicians in clinical routine may differ greatly from the mean values derived in a whole tumor volume. The difference between minimum and maximum values within a volume is even more severe. It shows that due to the heterogeneous morphology of most tumors, the evaluation of perfusion parameters of the entire tumor for analysis seems mandatory to determine different degrees of tumor vascularity, necrosis or hemorrhage. Another advantage is the precise definition of the volume of interest whereas individual slice selection suffers from intra observer variance. In summary, a recommendation for determination of 3D perfusion parameters can be made, especially if volume data is already available and can thus contribute to a more targeted therapy.Acknowledgements
This research project is part of the Research Campus M²OLIE and funded by the German Federal Ministry of Education and Research (BMBF) within the Framework “Forschungscampus: public-private partnership for Innovations” under the funding code 13GW0092D.References
[1] Calamante et al. (2013). Arterial input function in perfusion MRI: A comprehensive review. Progress in nuclear magnetic resonance spectroscopy, 74:1-32
[2] Attenberger et al. (2014). Multi-parametric MRI of rectal cancer–Do quantitative functional MR measurements correlate with radiologic and pathologic tumor stages? European Journal of Radiology, 83:1036-1043
[3] Koh et al. (2013). Primary Colorectal Cancer: Use of Kinetic Modeling of Dynamic Contrast-enhanced CT Data to Predict Clinical Outcome, Radiology, 267(1):145-154
[4] Gaa et al. (2017). Comparison of perfusion models for quantitative T1 weighted DCE-MRI of rectal cancer, Scientific Reports-UK, 7:12036
[5] Zöllner et al. (2016). An open source software for analysis of dynamic contrast enhanced magnetic resonance images: UMMPerfusion revisited, BMC Med Imaging, 16 (7): 1-1
* These authors contributed equally to this work.
Figures