3949
Correlation of Native Liver T1 mapping to post contrast T1 mapping, Apparent Diffusion Coefficient (ADC) and Dynamic Contrast Enhancement (DCE) Maps in a Rabbit Model for Liver Cancer1Radiology and Biomedical Imaging, Yale University, New Haven, CT, United States, 2Medicine, Yale University, New Haven, CT, United States, 3U/S Imaging and Interventions, Philips Research North America, Cambridge, MA, United States, 4PreScience Labs, Westport, CT, United States
Synopsis
We investigated native T1 mapping for detection of liver tumors in comparison to multi-parametric MRI. In 13 rabbits with implanted 2 week VX2 tumor, 9 of which underwent transarterial chemoembolization (TACE), native T1 mapping showed a similar spatial pattern compared to dynamic contrast enhanced (DCE) imaging, apparent diffusion coefficient maps (ADC), and post-contrast T1 maps. Native T1 is highest in central necrosis, intermediate in viable hypervascular tumor, and lowest in normal liver.
Introduction
Hepatocellular Carcinoma (HCC) is currently detected using DCE to visualize tumors which are primarily supplied by the hepatic artery, in contrast to normal liver which is mainly perfused from the portal vein. A non-contrast MRI method for HCC detection with similar diagnostic accuracy to dynamic contrast enhancement (DCE) would improve patient care, especially in patients contraindicated for contrast agent. Our goal was to investigate native T1 mapping for detection of liver tumor in multi-parametric MRI.Methods
All studies were approved by our institution's IACUC. Thirteen New Zealand white rabbits were surgically implanted with VX2 tumors in the liver as previously established by our co-investigators(1) , with growth for two weeks after implantation. Nine of the 13 rabbits were subsequently treated with transarterial chemoembolization (TACE). All imaging was performed on a 3.T Prisma scanner (Siemens, Erlangen, Germany) in a 15channel Knee coil, 1-4 days post-TACE Diffusion weighted imaging (DWI) was performed (similar to Ref. 2) using 80 mT/m gradients, 3 b-values, 50 s/mm2, 400 s/mm2 and 800 s/mm2, in 3 orthogonal directions. The scan was a 2D EPI single shot sequence, FOV of 200 x 160 mm, and partial Fourier factor 6/8, GRAPPA factor 2, and a matrix of 112, TR/TE/q=2.6s/42ms/90°, 2.1 x 2.1 x 2.5 mm3 with 20 slices covering the liver, and averaging (N=5-8). Fat suppression was applied with SPAIR. No respiratory gating was employed. Total imaging time was 5:25 minutes. The DWI images were fit automatically to an exponential function to generate Apparent Diffusion Coefficient (ADC) maps. 3D T1 mapping was performed, prior to and after DCE, using 3D GRE, with a 5, 8, 12,15° flip angles, with B1-mapping for correction of flip angles, and offline fitting in Matlab (3). Scan parameters were: resolution: 0.5 x 0.5 x 2.5mm, 200mm x 120 mm FOV, 192 x 100 matrix. DCE was performed during an injection of 0.1mmol/kg of Gd-DTPA, using a 3D VIBE[CD4] sequence with CAIPIRINHA parallel imaging factor of 2 in both ky and kz (3) . Scan parameters were: TR/TE/q = 3.4ms/1.3ms/9°, 0.5 x 0.5 x 2.5mm, 200mm x 120 mm FOV, 192 x 100 matrix, partial Fourier factor 6/8, 32 slices, fat suppression with SPAIR. The frame time was 2-3 s per volume. The DCE data was analyzed to obtain percent enhancement in the portal venous phase. The rabbits were sacrificed immediately, tumors resected, and histopathology performed.Results
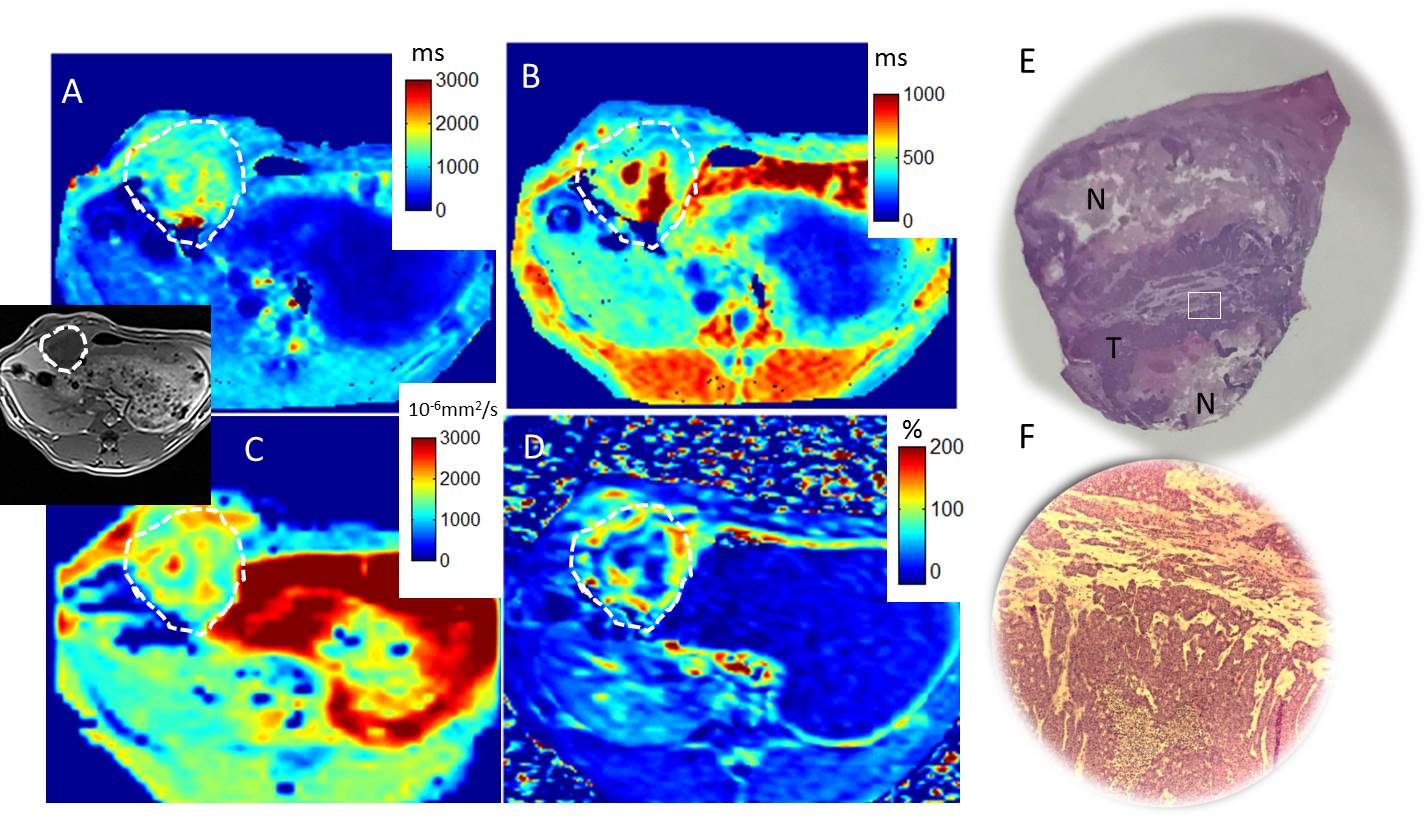
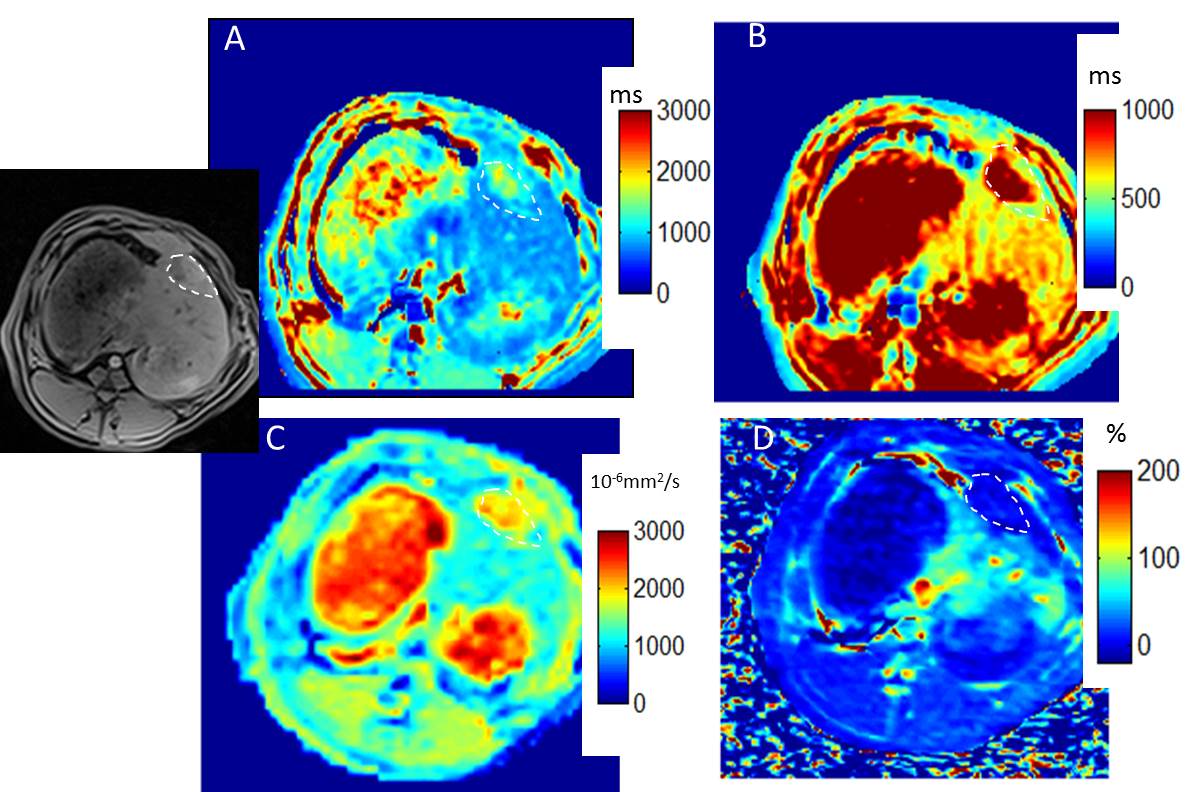
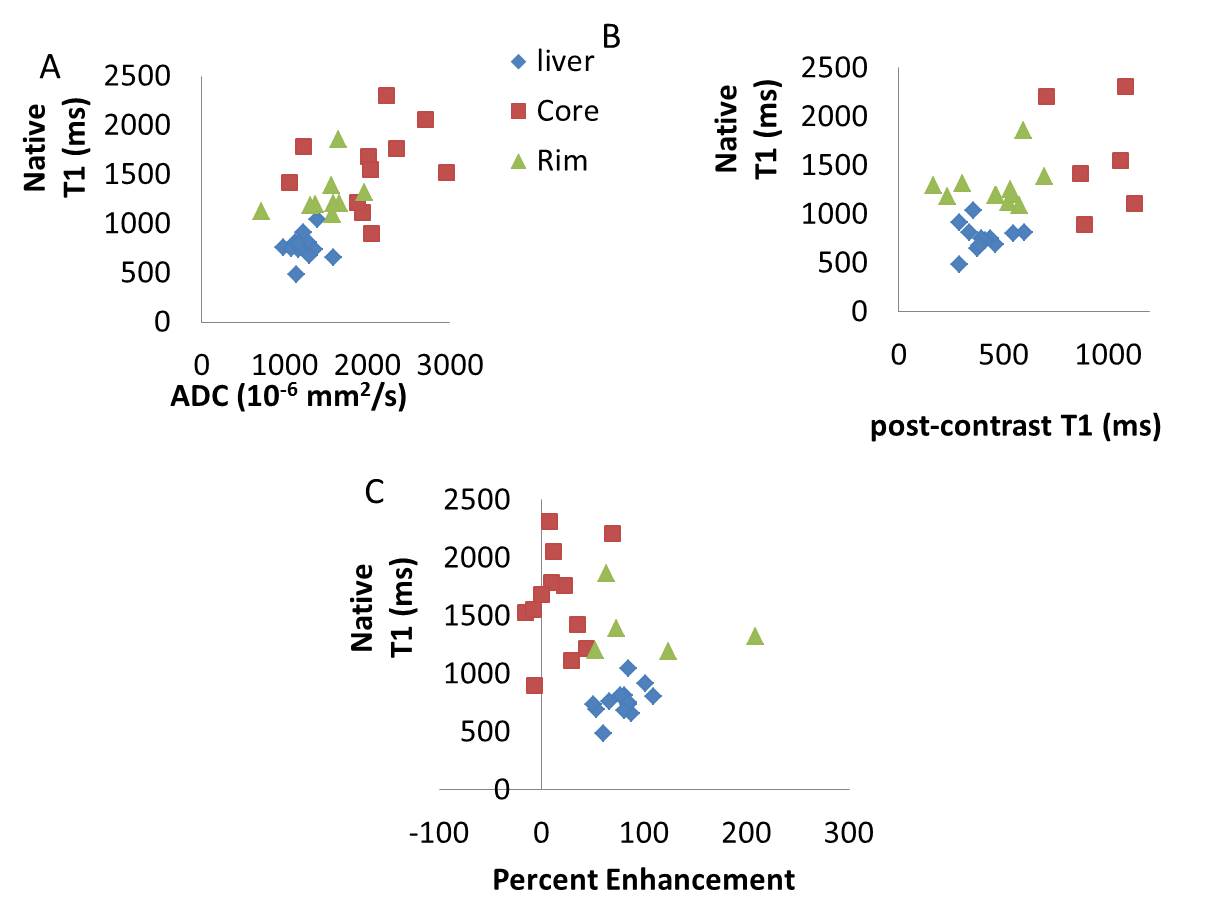
The average tumor maximal diameter was 16 +/-6mm. Figure 1 shows multiparametric mapping in a rabbit with a large untreated liver tumor. Figure 1E-F shows the gross pathology of the whole tumor (roughly matched to the axial MRI), and a hematoxylin and eosin stain from one section, which shows both a necrotic region and a region of living tumor. Figure 2 shows similar maps in a rabbit post-TACE, where the tumor appears embolized and there is no enhancement. The tumors with and without TACE exhibit heterogeneity, which is reflected in the native T1 maps. The gross pathology roughly matches the native T1 map and other maps, showing multiple layers of necrotic and viable tumor. Overall, native T1 correlated well with ADC values, and post-contrast T1 (both R2=0.39, p<0.01) in areas of normal liver, tumor core and periphery/rim in all rabbits (Figure 3). The measurements of the tumor rim show variable contrast, often with enhancement and lower post-contrast T1, but an abnormal nativeT1.Discussion
In our study, native T1 liver mapping depicted the highly heterogeneous tumor morphology. Necrotic regions are known to have higher ADC values (5). Our study also found this, and furthermore the necrotic regions had higher native T1, less contrast enhancement, and consequently higher post-contrast T1. Our study also identified highly vascular tumor regions with lower ADC, and greater enhancement than normal liver, and a native T1 that was intermediate between the higher T1 of necrotic regions and the lower T1 of normal liver. If viable tumor regions could be reliably identified as intermediate T1s on native T1 maps—without use of contrast agent—this would impact patient care.Acknowledgements
The authors gratefully acknowledge support for this study from NIH NCI R01 CA206180, Boston Scientific and the Yale Liver Center Pilot Grant for funding.References
1. Tacher V et al. Multimodality Imaging of Ethiodized Oil-loaded Radiopaque Microspheres during Transarterial Embolization of Rabbits with VX2 Liver Tumors. Radiology. 2016;279(3):741-53.
2. Wu H et al. Diffusion weighted multiparametric MRI. JMRI, 44 (2016) p. 708f
3. Cheng HL, Wright GA. Rapid high-resolution T(1) mapping by variable flip angles: accurate and precise measurements in the presence of radiofrequency field inhomogeneity. Magn Reson Med. 2006 Mar;55(3):566-74.
4. Budjan J et al. CAIPIRINHA-Dixon-TWIST (CDT)-volume interpolated breath hold examination (VIBE) for dynamic liver imaging. Eur J. Radiology, 83 (2014) p. 2007ff
5. Vossen JA. Diffusion-Weighted and Gd-EOB-DTPA Contrast-Enhanced Magnetic Resonance Imaging for Characterization of Tumor Necrosis in an Animal Model. JCAT 2009;33(4):626-30
Figures