3947
Bio-orthogonal MR imaging – A novel method proposed for metastatic cancer detection1Chemical Engineering, Brigham Young University, Provo, UT, United States, 2Electrical Engineering, Brigham Young University, Provo, UT, United States
Synopsis
Metastatic tumors (METs) cause 90% of cancer deaths since their small size makes detection difficult. A bio-orthogonal method is demonstrated where two distinct detection molecules and mechanisms are employed with minimal interference. Gadolinium (Gd) and Iron-Oxide-Particles (IOP) with respective MRI T1 and T2* scans were hypothesized to produce orthogonality in the resulting images. In vitro experiments showed respective minimum detectability limits of Gd and IOP at 1µL, 0.25µM and 0.5µL, 6µM. Ex vivo experiments demonstrated Gd and IOP detection at 0.313-0.625mM. Thus the plausibility of bio-orthogonal MET detection to reduce the likelihood of false positive and negative diagnoses is very high.
Introduction
Metastatic tumors (METs) are responsible for the death of about 90% of cancer patients with solid tumors1. METs can be as small as 0.125µL in volume. Due to the small sizes of METs, conventional imaging produces many false positive diagnoses. This research uses two simultaneous detection methods, both of which must be positive for positive identification of a MET. When the detection methods are “orthogonal” to each other (not projecting one onto the other) then the occurrence of a false diagnosis is reduced significantly. Bio-orthogonal, as defined here, is employing two totally different biomolecular detection molecules and mechanisms which do not interfere with each other.
Two Magnetic Resonance Imaging (MRI) contrast agents, Iron-Oxide-Particles (IOP) and Gadolinium (Gd), were hypothesized to be orthogonally detectable in sequence using T2* and T1 scans, respectively. These studies show that Gd and IOP can be detected bio-orthogonally in gel phantoms and in excised tissue. These studies are to show the proportionate ratios in which Gd and IOP can be bio-orthogonally detected.
Methods
A 3T Siemens instrument with a 12 channel Magnetom head coil was used at the BYU MRI facility to image with T1 and T2* scans. Parameters for 3D T1-weighted GRE scan were TR/TE = 200/5ms, flip angle was 90°, and matrix size was 64 x 64 with a slice thickness of 1.25mm and field of view of 128 x 128 mm. Parameters for the T2*-weighted GRE scan were TR/TE = 11/5ms, flip angle was 25°, and the same field of view and resolution as the T1-weighted scan were used.
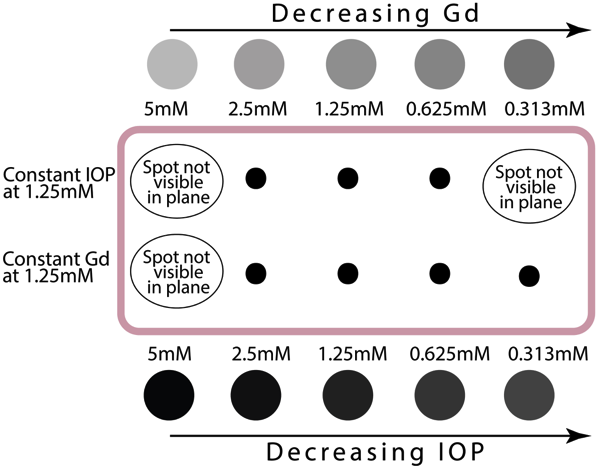
Phantom agarose gels were prepared in plastic petri dishes to determine detectability limits of concentration and volume. Gadolinium (Gd) and Iron Oxide Particle (IOP) suspensions were each created using MultiHance from Bracco and Magnetite Particles from Sciventions, respectively. Gd and IOP were respectively injected into separate gels using a syringe pump and Teflon needle. Stable volumes were created ranging by orders of two of Gd: 1–256 mm3 (µL), and of IOP: 0.5, and 1–64 µL. Using the same injection method, separate gels were injected with 8 µL volumes in decreasing concentration to determine detectability limits of Gd and IOP, respectively. Gd was injected in concentrations ranging from 64–0.06 µMol/L, IOP was injected in a separate gel in concentrations of 94–1 µMol/L.
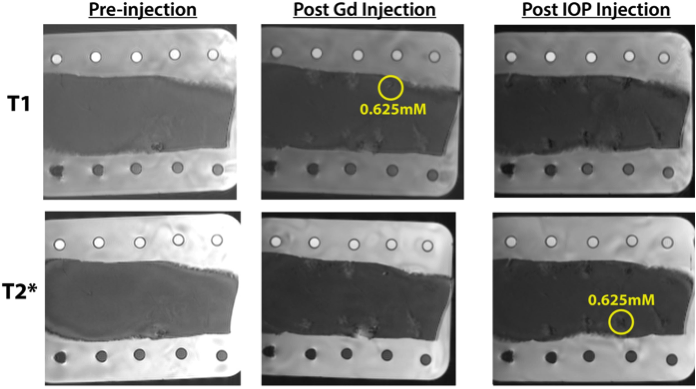
Porcine fat submerged in 1.5mM Cupric Sulfate solution (for background) was used as an ex vivo model to determine minimum detectable concentration limits in biological tissue. Separate injections of Gd and IOP suspensions at concentrations of 5, 2.5, 1.25, 0.625, and 0.313 mM were each made into the tissue using a Teflon needle to administer 0.1-0.2 mL. Pre-injection reference T1 and T2* scans were taken before any contrast agent administration and post-injection scans were taken after administration of both Gd and IOP suspensions, respectively.
Results
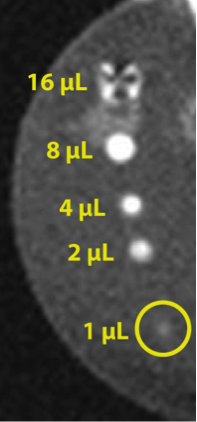
We showed that we can detect Gd and IOP in a phantom gel, respectively, at 1 µL and 0.5 µL volumes, at 0.25 µM and 6 µM concentrations. See Fig.1. We also showed that the minimum detectable injection concentration for both contrast agents in excised porcine tissue was between 0.313-0.625 mM. See Figs. 2 and 3.Discussion
The detectability limits seen both in vitro and ex vivo show the possibility of detecting 1 µL volumes at low concentrations. This corresponds to the likelihood of early MET detection if the site can be targeted with these contrast agents. The sequential detection of each agent shows the promise of bio-orthogonal detection and the resultantly high probability to virtually eliminate false positive and greatly reduce false negative diagnoses.Conclusion
It was shown that Gd and IOP can be imaged independent of each other in sequence on their respective scans in the same location. This shows that these two agents are bio-orthogonally detectable in vitro and ex vivo. This is crucial to the future of MET detection with MRI. If these agents can be delivered directly to the cancer site in the body it is very plausible that MRI scans can confirm the location of the site with much greater accuracy than conventional methods.Acknowledgements
Acknowledgements are given to both the BYU MRI Facility and the Chemical Engineering Department for there generous contribution of resources to these studies.References
- P. Mehlen and A. Puisieux, Metastasis: a question of life or death. Nat Rev Cancer. 2006; 6(6):449–458.
Figures