3945
The effect of sunitinib on human melanoma xenografts assessed with MRI and intravital microscopy1Oslo University Hospital, Oslo, Norway
Synopsis
We evaluated the effect of sunitinib on melanoma xenografts with dynamic contrast-enhanced MRI (DCE-MRI), diffusion weighted MRI (DW-MRI), intravital microscopy, and immunohistochemistry. An MR-compatible dorsal window chamber was used to compare parametric MR images with high resolution intravital microscopy images of the tumor vasculature. Sunitinib treatment reduced vessel density, increased the hypoxic tumor fraction, and induced necrosis, and DCE-MRI and DW-MRI were sensitive to these microenvironmental effects. The MR-compatible window chamber allowed daily assessment of both the morphology and function of tumor vasculature and may be a valuable tool to verify treatment-induced effects observed in parametric MR images.
Introduction
Antiangiogenic treatments may alter the tumor microenvironment and hence
influence the effect of conventional therapies1. Magnetic resonance
imaging (MRI) has frequently been used to assess early effects of
antiangiogenic treatments. In many of these studies, treatment-induced effects
on the tumor microenvironment were not assessed with non-MR techniques.
Consequently, it is not always clear how the changes in MR-derived parameters
were related to the tumor microenvironment. In the current study we evaluated
the effect of sunitinib treatment with dynamic contrast-enhanced MRI (DCE-MRI),
diffusion weighted MRI (DW-MRI), intravital microscopy, and
immunohistochemistry. We use an MR-compatible dorsal window chamber to compare parametric
MR images with high resolution intravital microscopy images of the tumor
vasculature.Methods
A-07 melanoma xenografts grown in dorsal window chambers or as flank tumors were used as tumor model. Tumor-bearing mice were treated with sunitinib (40 mg/kg/day for 4 days) or given vehicle, and were subjected to DCE-MRI, DW-MRI, intravital microscopy, and histological examination. Parametric images of Ktrans and ADC were produced from DCE-MRI and DW-MRI respectively2. Morphologic parameters of tumor vascular networks were assessed from high-resolution transillumination images, and tumor blood supply times (BST) were assessed from first-pass imaging movies3. Microvascular density, hypoxic fraction, and necrotic fraction were assessed from immunohistochemical preparations by using CD31 and pimonidazole as a markers for microvessels and hypoxia.Results and discussion
Sunitinib-treated
flank tumors showed reduced Ktrans
and increased ADC values, reflecting reduced microvascular density, increased
hypoxic fraction, and increased necrotic fraction as revealed by
immunohistochemistry (Figure 1). The MR-compatible dorsal window chamber did
not induce artifacts in MR-images, and allowed a direct comparison of
MR-derived parametric images with high-resolution intravital microscopy images
(Figure 2). Ktrans
reflected both the morphology (vessel density) and the function (BST) of tumor
vascular networks. The window chamber preparation allowed daily assessment of
the tumor vasculature during growth and during treatment (Figure 3A).
Sunitinib-treated tumors showed reduced vessel density, increased vessel
segment lengths, and increased vessel diameters (Figure 3B). Treatment-induced
effects on the tumor vasculature were apparent after 2 days of treatment, and
were more pronounced after 4 days of treatment. Hypoxic regions were found in
sunitinib-treated window chamber tumors and the hypoxic regions colocalized with
avascular regions or regions with very low vessel density. Avascular regions
were not found in untreated window chamber tumors, and these tumors did not
show hypoxic regions. Together these observations suggest that hypoxia was a
result of treatment-induced reductions in tumor blood supply.Conclusion
Sunitinib treatment affected the tumor microenvironment. DCE-MRI and DW-MRI were sensitive to sunitinib-induced effects that occurred within four days of treatment. The MR-compatible window chamber allowed daily assessment of both the morphology and function of tumor vasculature, and may be a valuable supplement to immunohistochemical preparations to verify treatment-induced effects in parametric MR-images.Acknowledgements
No acknowledgement found.References
1. Horsman MR, Siemann DW. Pathophysiologic effects of vascular-targeting agents and the implications for combination with conventional therapies. Cancer Res. 2006; 66:11520-11539.
2. Gaustad JV, Simonsen TG, Smistad R, et al. Early effects of low dose bevacizumab treatment assessed by magnetic resonance imaging. BMC Cancer. 2015;15:900.
3. Øye KS, Gulati G, Graff BA, et al. A novel method for mapping the heterogeneity in blood supply to normal and malignant tissues in the mouse dorsal window chamber. MicrovascRes. 2008;75:179-187.
Figures
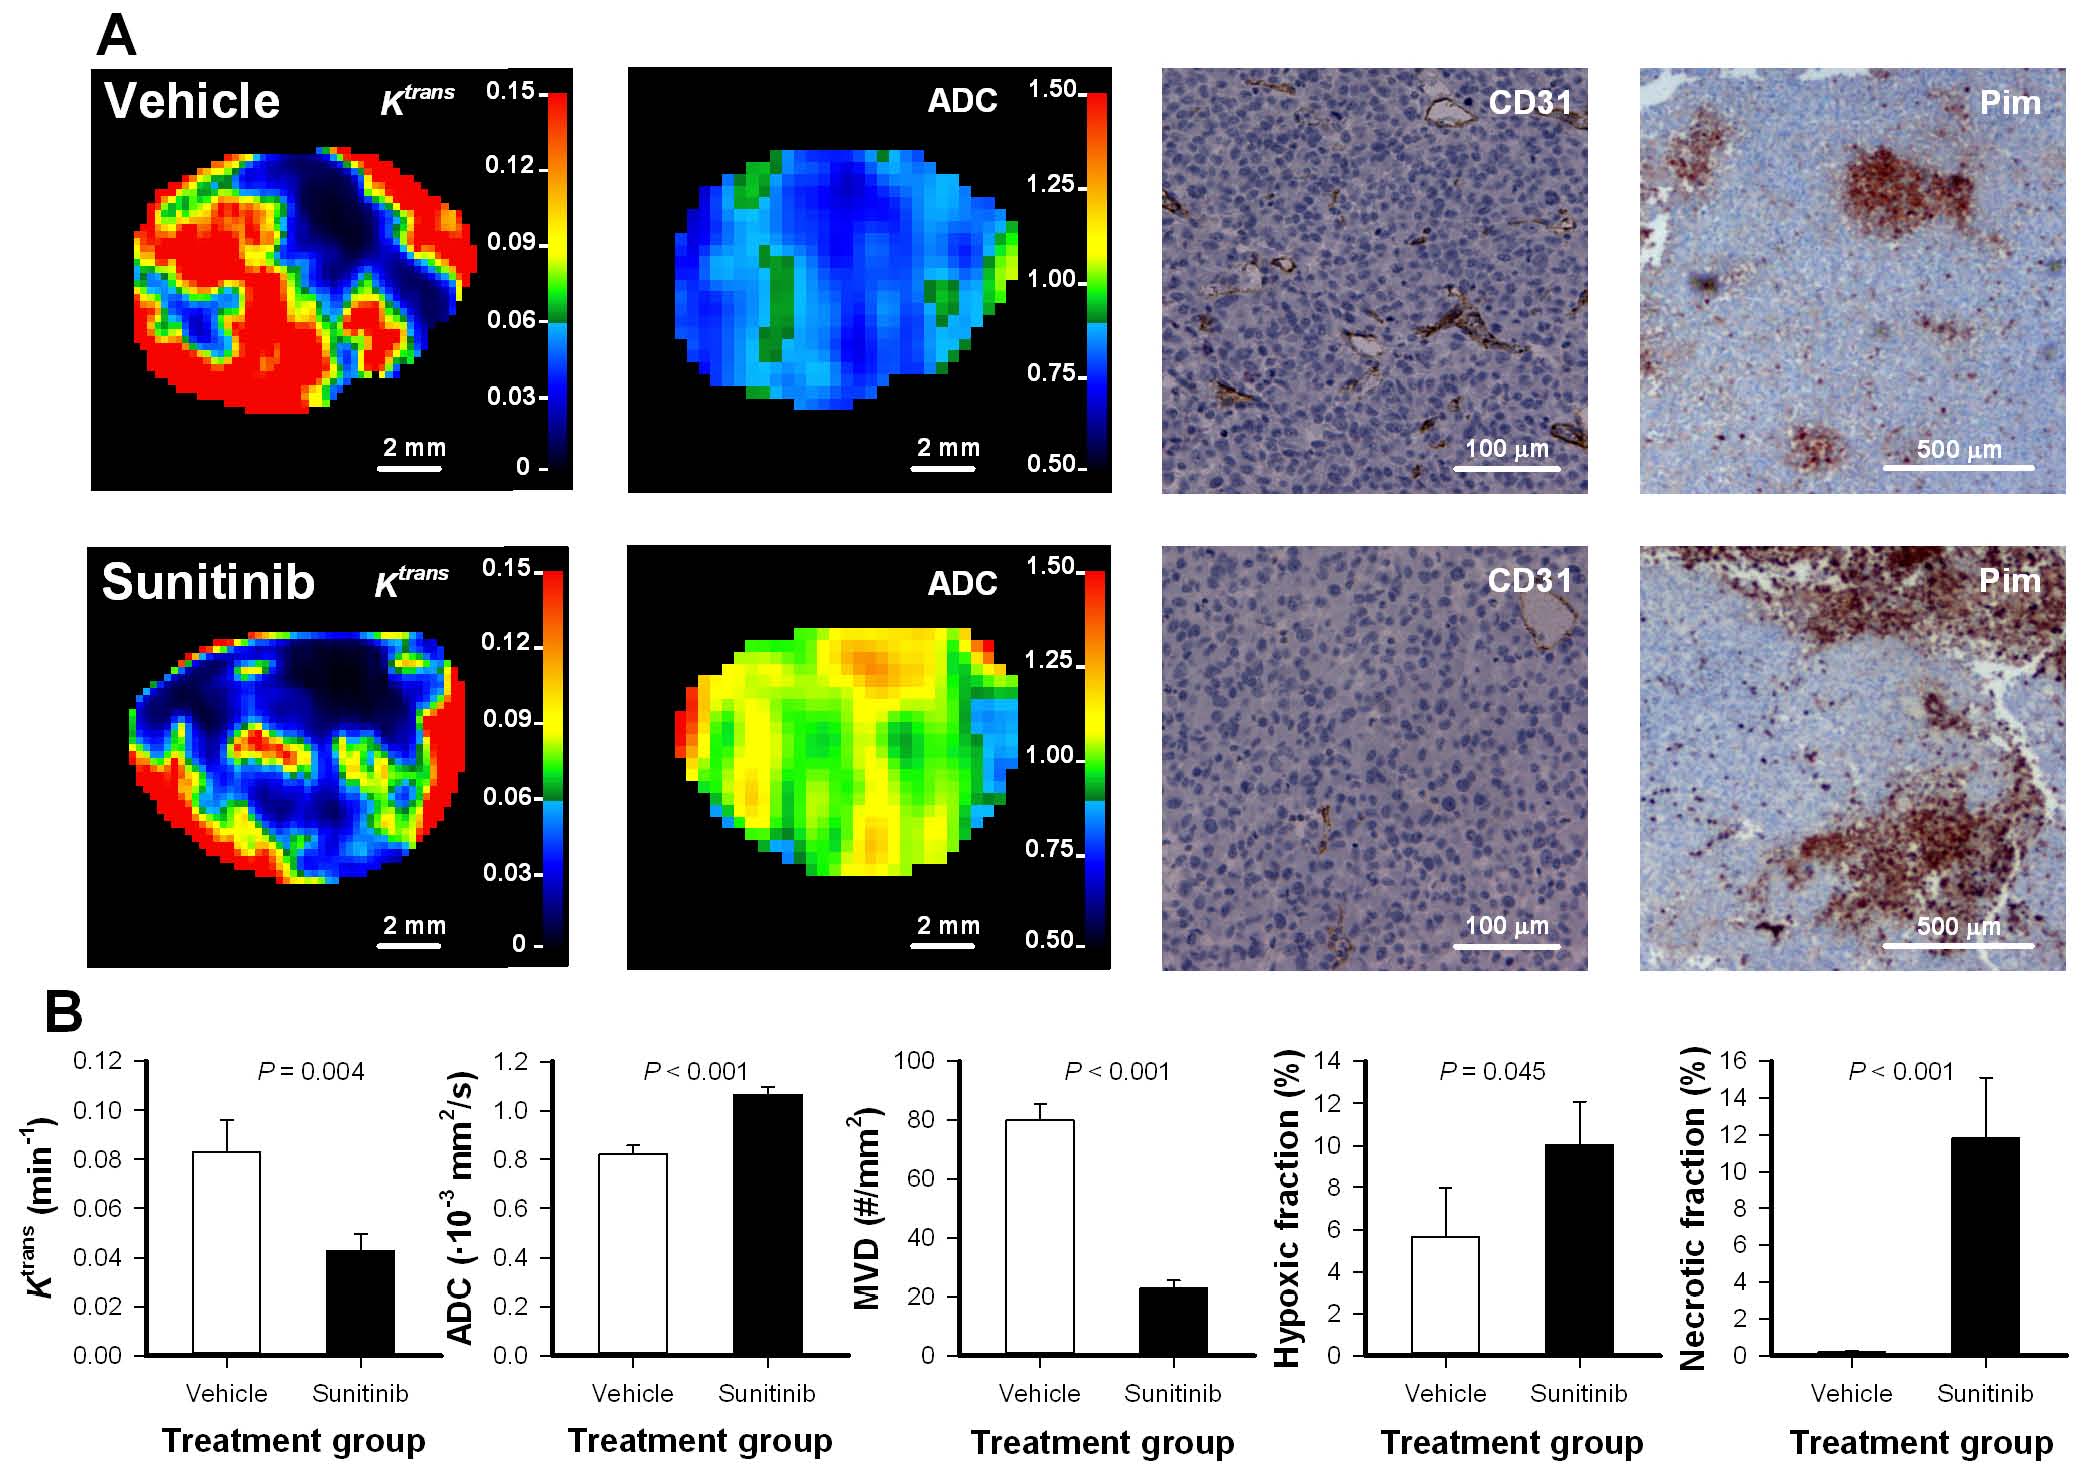
Figure 1. The effect of sunitinib assessed with MRI and immunohistochemistry.
A, Ktrans image, ADC image, and immunohistochemical preparations stained for microvessels (CD31) and hypoxic regions (pimonidazole). The images show a representative untreated tumor (upper row) and a representative sunitinib-treated tumor (lower row). B, Ktrans, ADC, microvascular density (MVD), hypoxic fraction, and necrotic fraction in untreated and sunitinib-treated tumors. Columns, means of 11-15 tumors; bars, SEM.
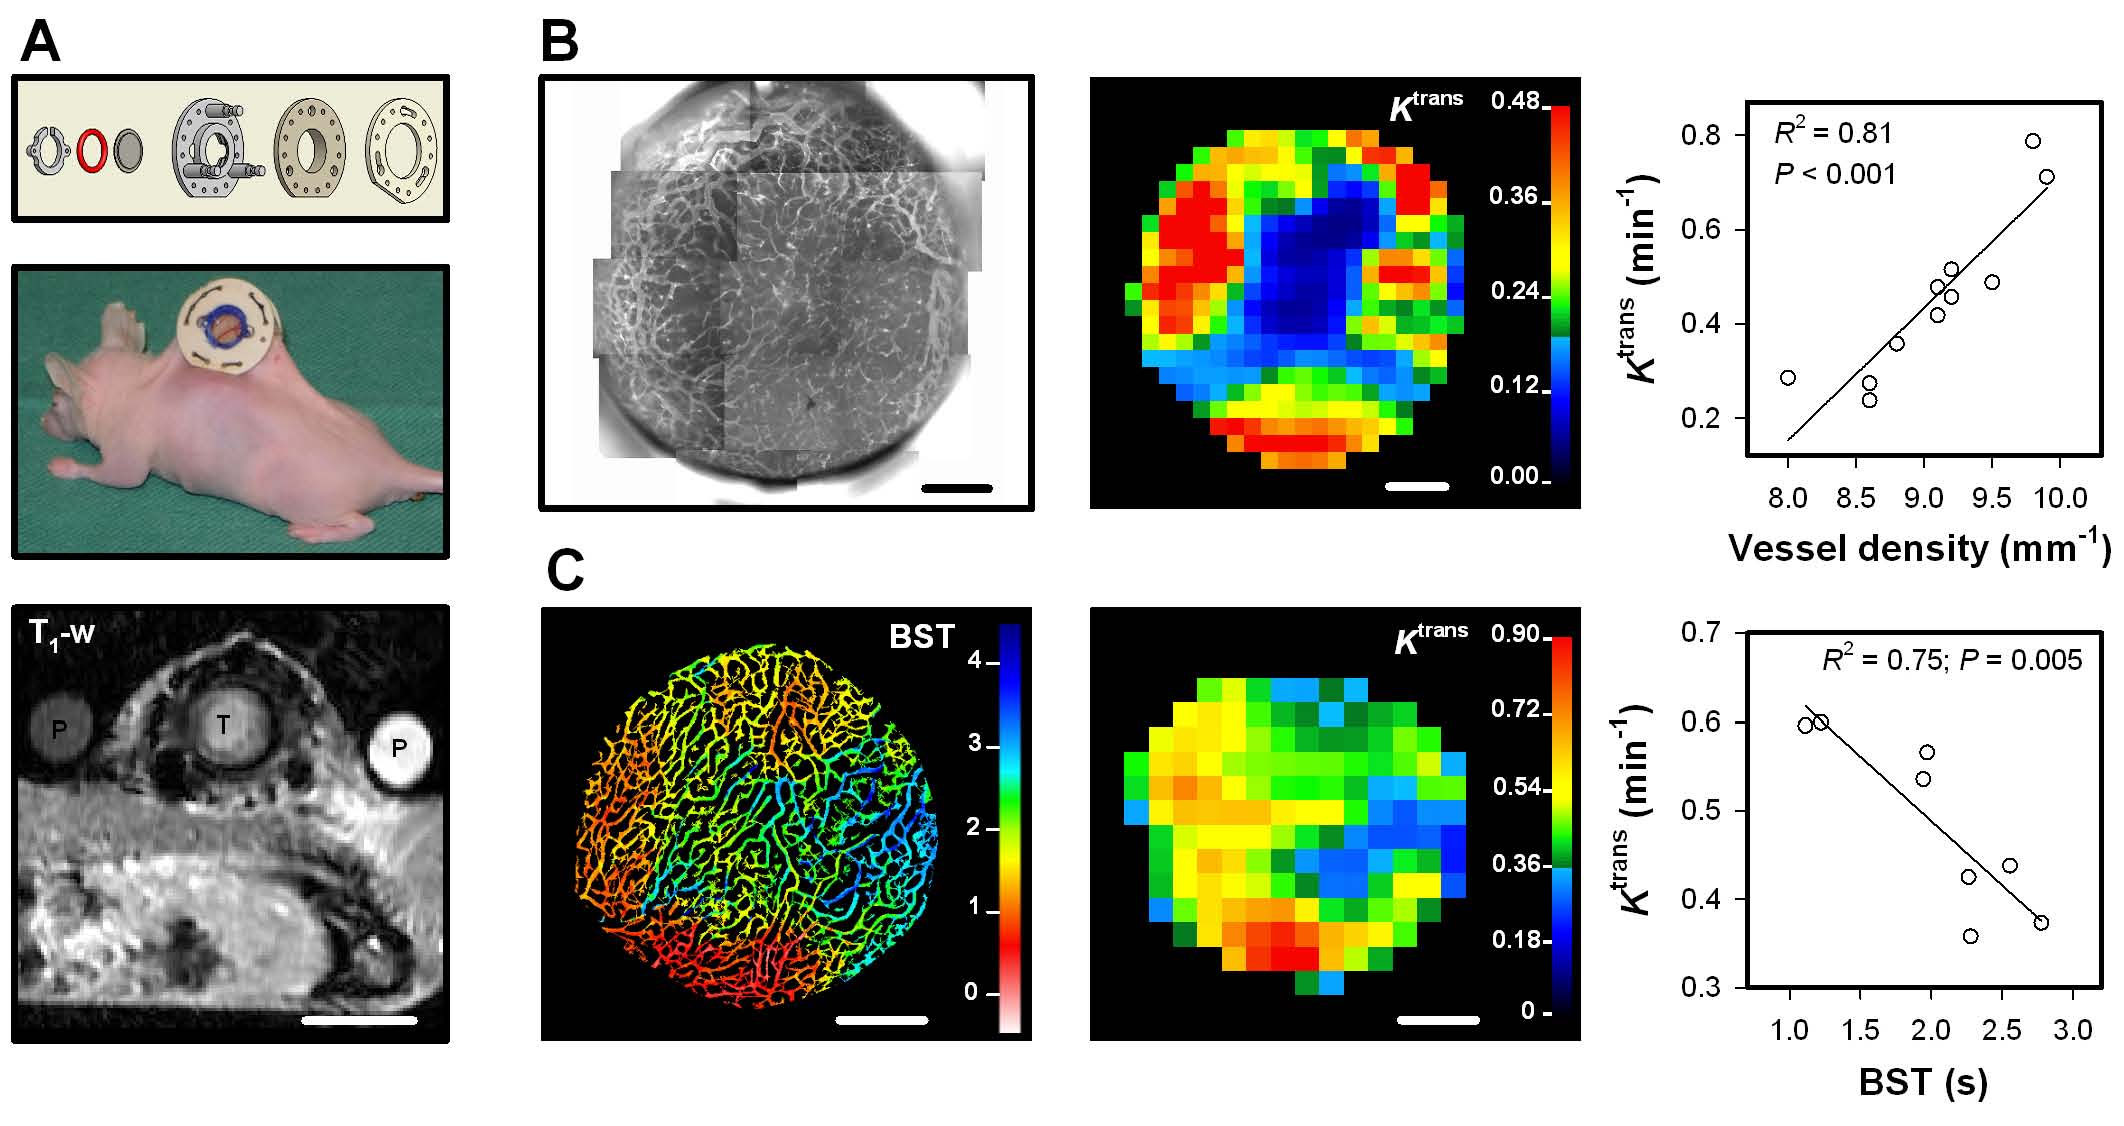
Figure 2. MR-compatible dorsal window chamber.
A, Technical drawing of our MR-compatible dorsal window chamber, and photograph and T1-weighted gradient echo image showing a mouse with an implanted window chamber. T, tumor; P, calibration phantoms. B, Intravital microscopy and Ktrans image of a representative tumor, and median Ktrans versus density of large-diameter vessels (>20μm) in individual tumors. Vessels are filled with fluorescence-labeled dextran and appear bright in the intravital microscopy image. C, Blood supply time (BST) and Ktrans image of a representative tumor, and median Ktrans versus median BST in quadratic ROIs. Scale bars, 10mm (A) and 1mm (B-C).
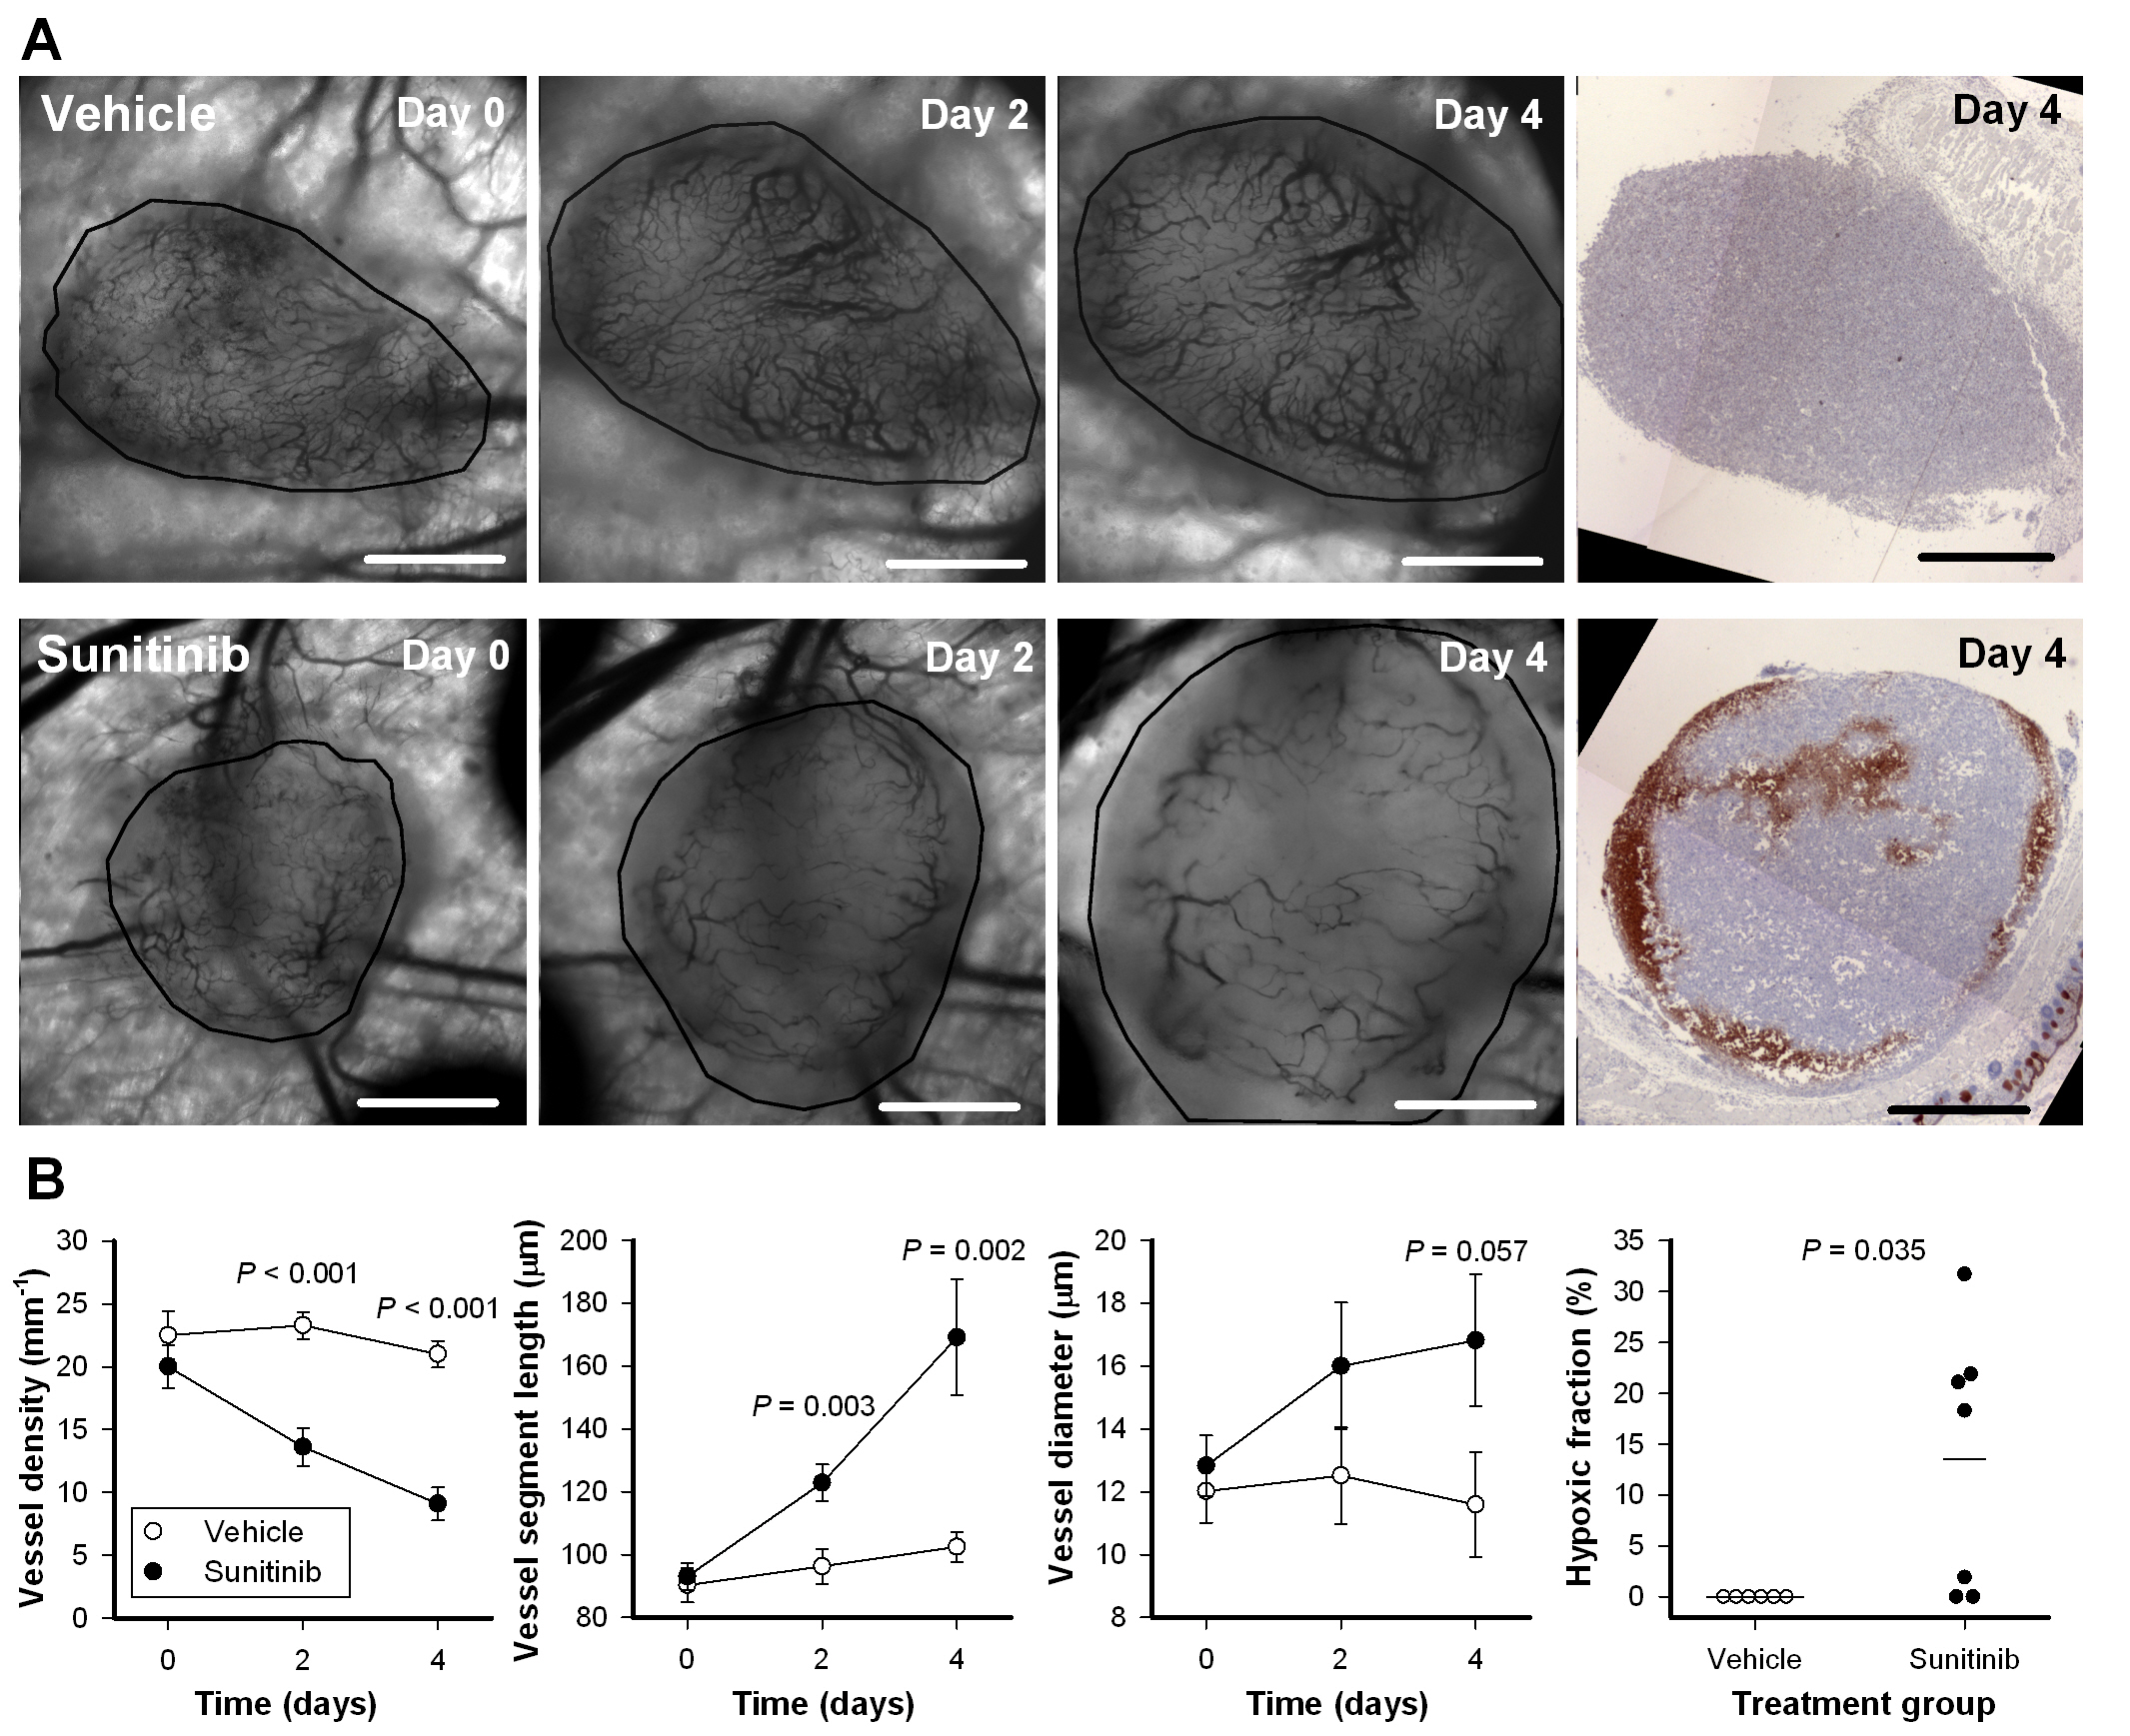
Figure 3. The effect of sunitinib assessed with intravital microscopy.
A, Intravital microscopy images recorded before (day 0) and during treatment (day 2 and 4), and immunohistochemical preparation stained for hypoxic regions (day 4). The images show a representative untreated tumor (upper row) and a representative sunitinib-treated tumor (lower row). Scale bars, 1mm. B, Vessel density, median vessel segment length, and median vessel diameter versus time, and hypoxic fraction in untreated and sunitinib-treated tumors. Points, means of 6-9 tumors or individual tumors; bars, SEM.