3944
Population variation in tumour microvascular characteristics1University of Manchester, Manchester, United Kingdom, 2formerly AstraZeneca, Alderley Park, United Kingdom, 3AstraZeneca, Cambridge, United Kingdom, 4AstraZeneca, Alderley Park, United Kingdom
Synopsis
It is unclear from the literature whether microvascular characteristics vary according to primary tumour type, although this is important for e.g. patient selection in drug development. DCE-MRI data were obtained covering 342 tumours and 13 tumour types. Median Ktrans for non-glioma tumours had geometric mean (95% CI) of 0.15 min-1 (0.05 min-1, 0.45 min-1). There was insufficient separation between posterior densities to predict tumour Ktrans given primary tumour type. This demonstrates that where microvascular characteristics are relevant for inclusion in a clinical trial or for beginning a specific treatment, it is not generally possible to select on tumour type alone.
Introduction
We set out to assess if population-level assessments of DCE-MRI data can identify phenotypical differences in microvascular function between tumour types. Most studies of tumour microvascular function, for example using dynamic contrast-enhanced MRI (DCE-MRI) [1], have investigated changes in the measured parameters due to intervention, and there has been no large study investigating typical microvascular characteristics across tumour types using consistent methodology. It is therefore unclear whether these characteristics vary significantly according to primary tumour type, although this may have relevance for patient selection in the drug development context and for clinical treatment selection; identification of tumour-type specific microvasculature would be useful when testing therapies reliant on local drug delivery and accumulation [2] or when outcome is suggested to be dependent on pre-treatment characteristics. We used a retrospective analysis of a large number of DCE-MRI datasets acquired and analysed using a consistent methodology to characterise typical microvascular characteristics according to primary tumour type.Methods
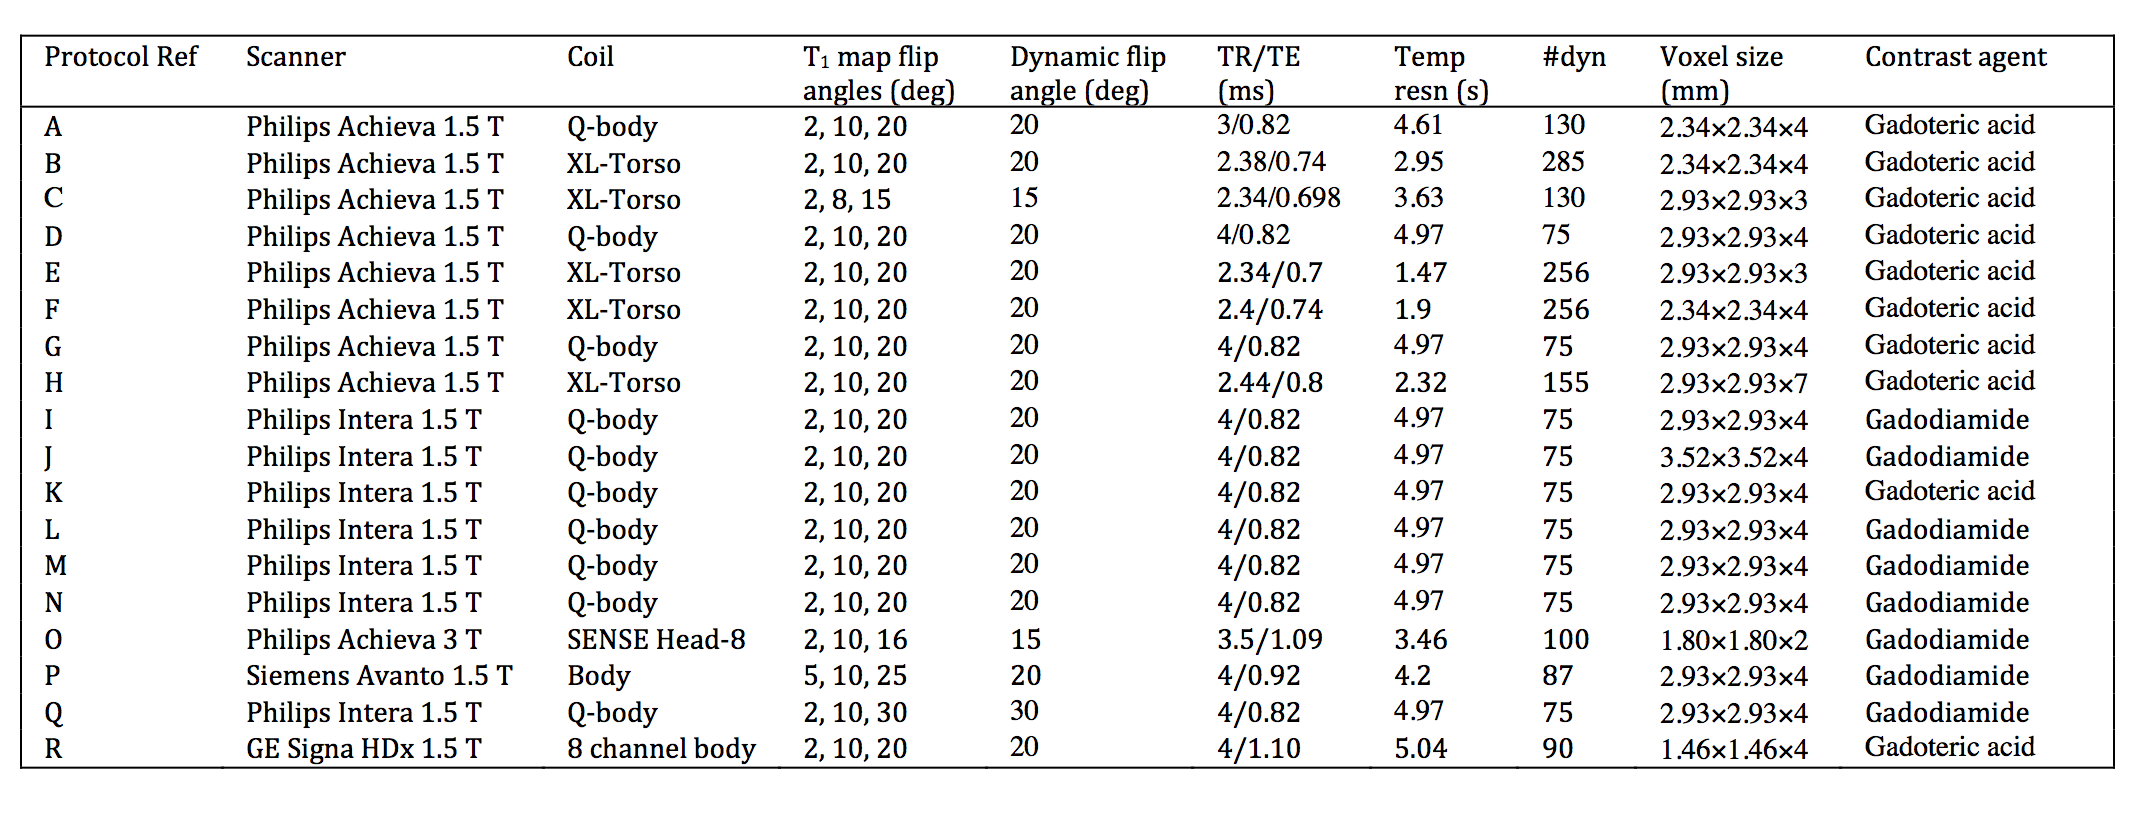
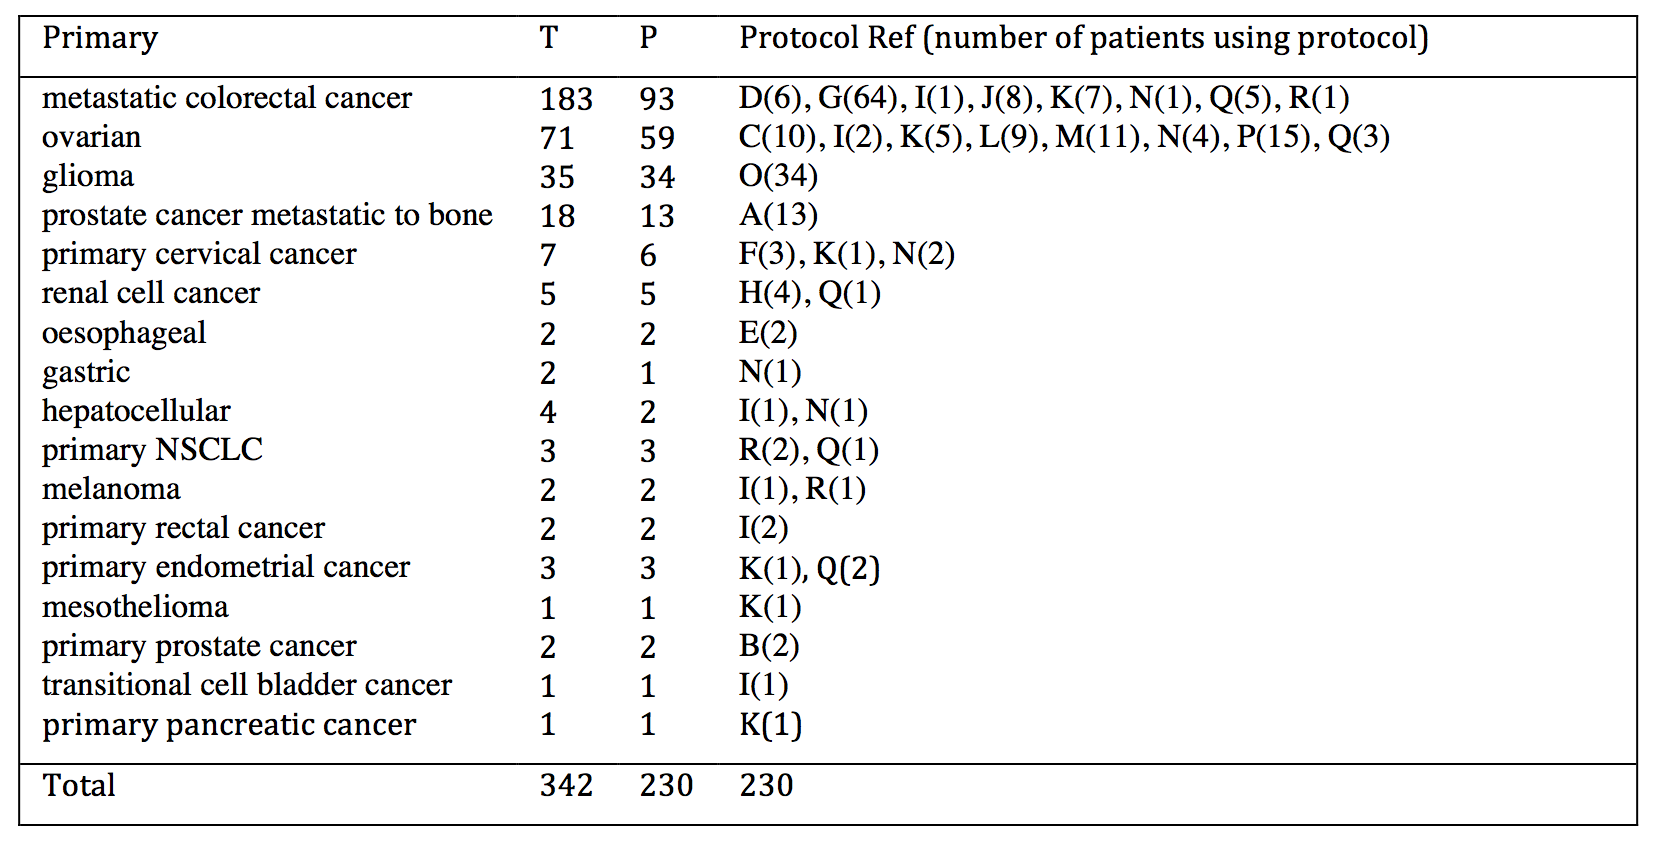
DCE-MRI data were obtained from a retrospective analysis of 342 tumours in 230 patients covering 13 tumour types as detailed in Table 1. All data were acquired using volumetric spoiled gradient echo sequences as outlined in Table 2. A variable flip angle approach was used prior to contrast agent injection to calculate baseline T1, and this was followed by a set of dynamic acquisitions during which contrast agent was injected using a power injector with consistent dosing and flow rate. Uptake curves during the dynamic time course were fitted using the extended Tofts model. A model of the posterior density of median and standard deviation of the log-transformed Ktrans for each primary tumour type was built to enable direct comparison of the contrast agent kinetic characteristics of each tumour type.Results
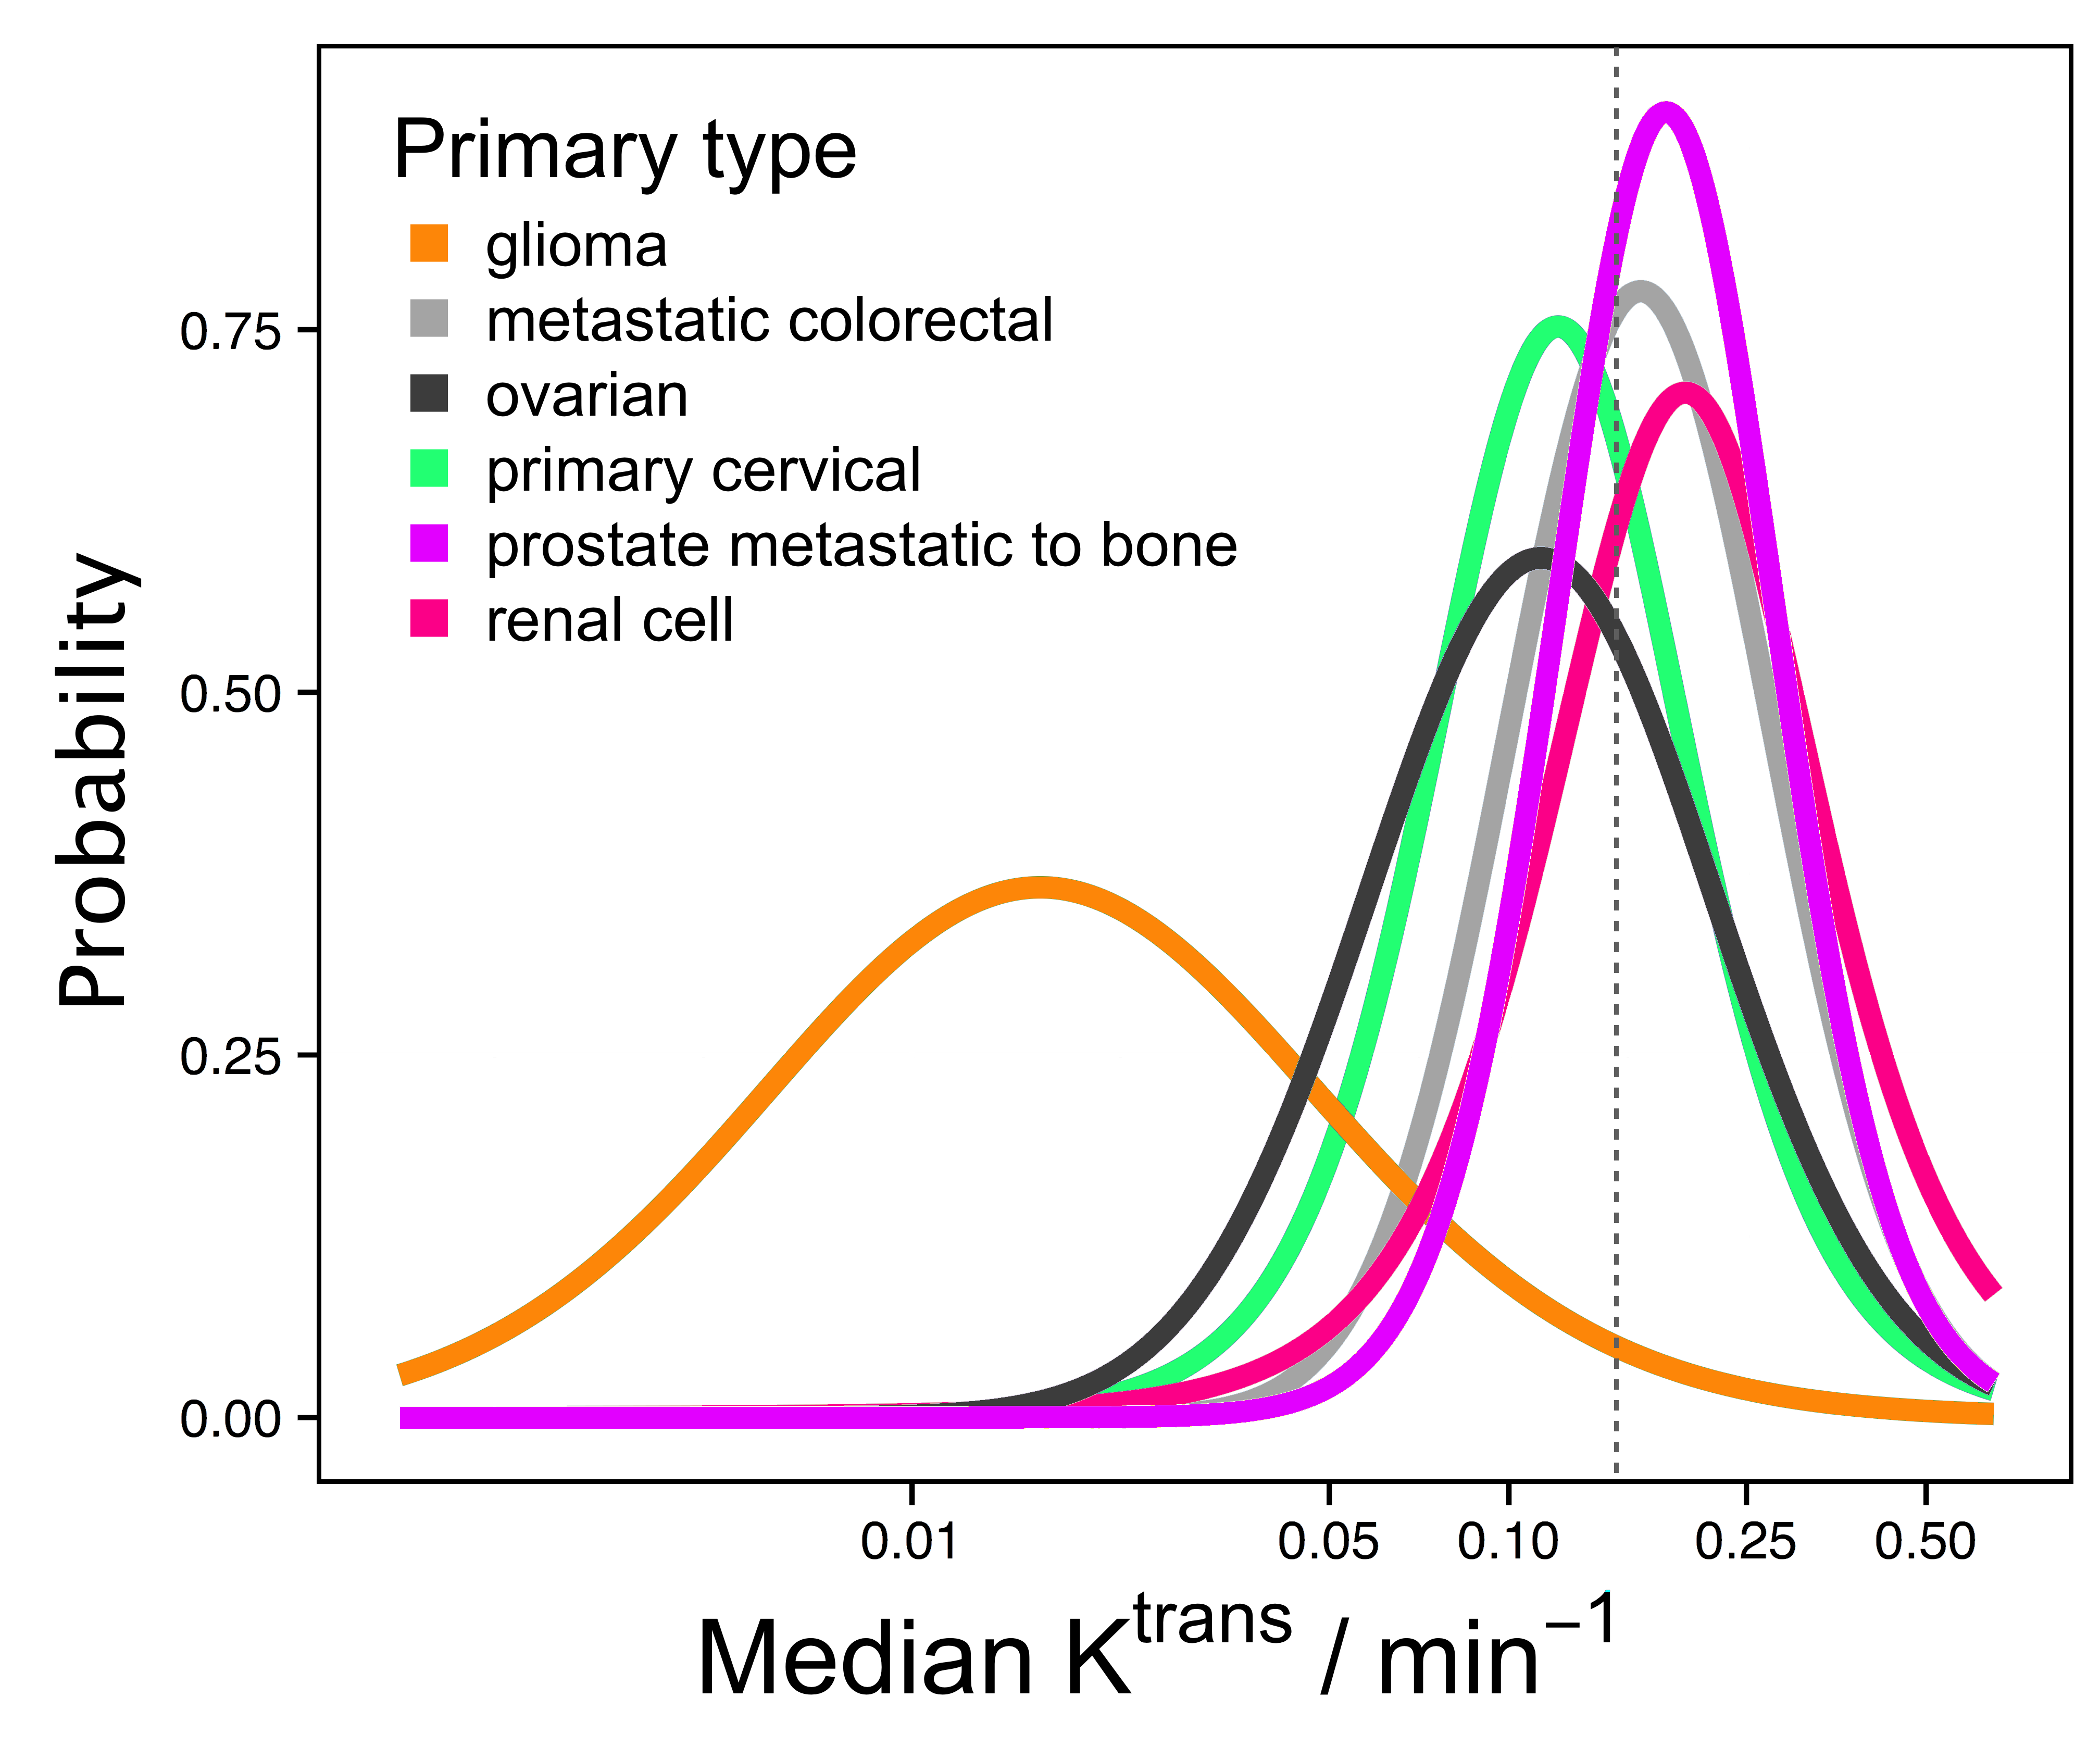
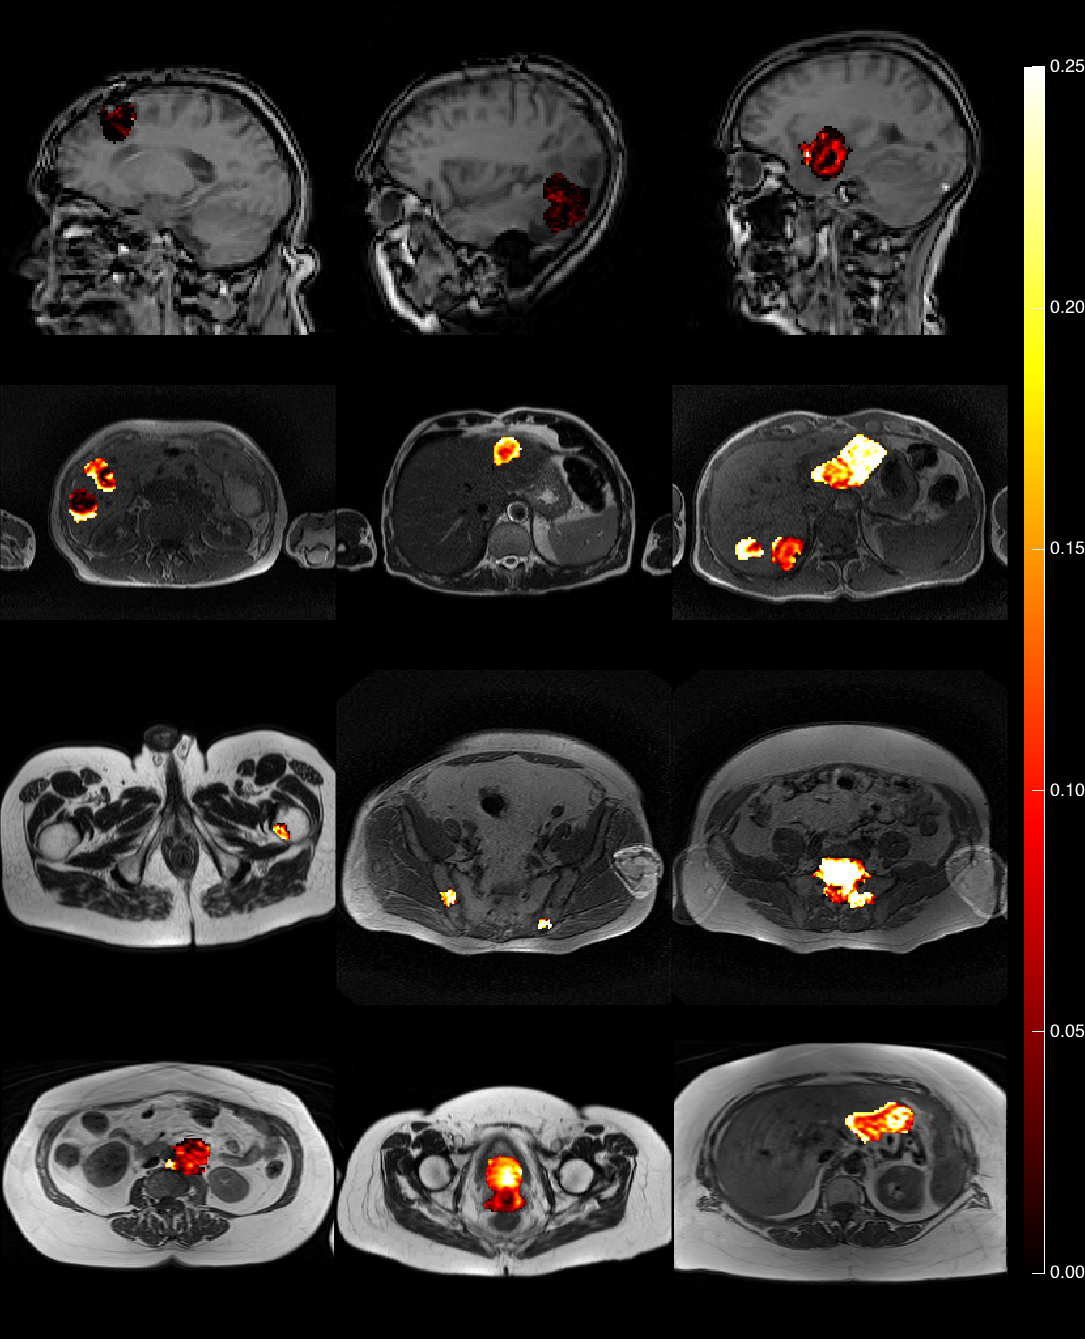
45% of patients were male. Median weight was 73 kg (range 44-120 kg). Median age was 62 years (range 26-81 years). A range of 1 to 7 tumours were observed per patient. Just over half (54%) of the imaged tumours included in this study were from patients with colorectal primaries. A further 21% were from patients with ovarian primaries. Patients with gliomas and prostate primaries formed the next largest groups of 10% and 5% of tumours respectively. Figure 1 shows that gliomas had median Ktrans of 0.016 min-1, which was significantly lower than the Ktrans for all other tumour types investigated. For non-glioma tumours, Ktrans ranged from 0.10 (cervical) to 0.21 min-1 (prostate metastatic to bone) and variability within a tumour type exceeded differences between tumour type. The geometric mean (95% CI) of median Ktrans for the non-glioma tumour types was 0.15 min-1 (0.05 min-1, 0.45 min-1). There is insufficient separation between the posterior densities to be able to predict the Ktrans value of a tumour given the primary tumour type, except to say that the median Ktrans for gliomas are below 0.05 min-1 with 80% probability, and median Ktrans measurements for the remaining tumour types are between 0.05 and 0.4 min-1 with 80% probability. Example parameter maps are shown in Figure 2.Discussion
We have performed a large retrospective study of multiple tumour types collected over a number of years with harmonized acquisition protocols and identical tracer kinetic analysis. We have shown in this robustly controlled study that all primary tumours exhibit such widely varying microvascular characteristics that primary tumour type alone is generally an insufficient basis on which to select patients for these characteristics. If microvascular characteristics are considered relevant for inclusion in a clinical trial or for beginning a specific treatment, then it is not possible to select for these characteristics on tumour type alone, with the possible exception of glioma. This may be particularly relevant in the case of larger drug molecules, where tumour tissue exposure is highly dependent on characteristics such as perfusion and vascular permeability [3,4]. Basing trial or treatment eligibility on DCE-MRI screening for microvascular characteristics may therefore be required to enable the identification of individual tumours susceptible to rapid accretion of treatment compounds in early clinical trials, or those tumours more likely to respond in a personalised medicine setting.Acknowledgements
No acknowledgement found.References
[1] O’Connor JPB, Jackson A, Parker GJM, Roberts C, Jayson GC. Dynamic contrast-enhanced MRI in clinical trials of antivascular therapies. Nature Reviews Clinical Oncology 2012;9(3):167–177.
[2] Tofts PS, Brix G, Buckley DL, Evelhoch JL, Henderson E, Knopp MV, Larsson HBW, Lee TY, Mayr NA, Parker GJM, Port RE, Taylor J, Weisskoff RM. Estimating kinetic parameters from dynamic contrast-enhanced T1-weighted MRI of a diffusable tracer: Standardized quantities and symbols. J Magn Reson Imaging 1999;10(3):223–232.
[3] Taurin S, Nehoff H, Greish K. Anticancer nanomedicine and tumor vascular permeability; Where is the missing link? Journal of Controlled Release 2012;164(3):265–275.
[4] Stapleton S, Allen C, Pintilie M, Jaffray DA. Tumor perfusion imaging predicts the intra-tumoral accumulation of liposomes. Journal of Controlled Release 2013;172(1):351–357.
Figures