3942
DCE-MRI with a targeted contrast agent for characterizing prostate cancer aggressivenessZheng-Rong Lu1 and Zheng Han1
1Case Western Reserve University, Cleveland, OH, United States
Synopsis
Conventional dynamic contrast-enhanced MRI (DCE-MRI) has been used for tumor characterization based on tumor vascularity and permeability using non-targeted small molecular contrast agents. In this study, we investigate the effectiveness of DEC-MRI with a targeted MRI contrast agent for characterization of prostate cancer of different aggressiveness in comparison with a clinical agent. Distinctive Ktrans and Ve values were obtained between the high-risk PC3 and low-risk LNCaP tumors using the targeted agent, but not for the clinical agent, Gd(HP-DO3A). DCE-MRI with this targeted contrast agent could increase accuracy in characterizing prostate cancer aggressiveness.
Introduction
Conventional DCE-MRI of cancer employs small gadolinium-based contrast agents, and measures the leakiness of tumor microvasculature in comparison to that in surrounding normal tissues. However, tumor vascular parameters quantified by DCE-MRI have not provided robust differentiation between high-risk and low-risk tumors. Targeted contrast agents have demonstrated the promise in enhancing detection sensitivity and specificity of prostate cancer. In this study, we have investigated the potential of DEC-MRI with a targeted contrast agent specific to an oncoprotein, extradomain B fibronectin (EDB-FN), in tumor extracellular matrix to distinguish the aggressiveness of prostate tumors.Methods
All MRI was performed using a 7 Tesla Bruker Biospin system. Balb/c nude male mice were subcutaneously inoculated with 107 LNCaP or PC3 cells in 100 µL matrigel. LNCaP and PC3 tumors represent low-risk and high-risk prostate cancers, respectively. The EDB-FN specific agent, ZD2-Gd(HP-DO3A) was used as the contrast agent. A 3D FLASH gradient echo sequence was used for DCE imaging. The parameters were: TR=10 ms, TE=1.05 ms, flip angle=15°, number of average=1, FOV=3.53 cm × 3.53 cm× 2.04 cm, matrix size=128 × 96 × 17. Temporal resolution is 4.32 s. Resolution is 0.276 mm × 0.368 mm × 1.2 mm. Images were acquired rapidly for 90 seconds before a bolus of 0.1 mmol/kg body weight ZD2-Gd(HP-DO3A) was i.v. injected. A clinical agent Gd(HP-DO3A) was used as a control. A transverse T1-weighted spin echo multislice multiecho (MSME) sequence of higher spatial resolution was used to acquire image of the mouse at the tumor location before injection and after DCE acquisition (parameters: field of view (FOV), 3×3 cm; slice thickness, 1.2 mm; interslice distance, 1.2 mm; TR, 500 ms, TE, 8.1 ms; flip angle, 90°; average, 2; matrix size, 128 × 128). DCE imaging continued for about 30 min. A custom MATLAB program was used for fitting the signal intensities to the non-linear Tofts model. The Ktrans and Ve values were calculated for tumor rim and core separately.Results
Figure 1a and b show that PC3 tumors demonstrated higher contrast enhancement at 30 min after injection of the contrast agent, ZD2-Gd(HP-DO3A). Whereas, relatively lower contrast enhancement can be seen in LNCaP tumors and both tumors using non-targeted Gd(HP-DO3A). To evaluate the binding kinetics of the targeted agents in both tumor models more quantitatively, DCE-MRI was performed, which revealed that Ktrans values measured with ZD2-Gd(HP-DO3A) were significantly higher in the peripheral regions of the PC3 tumors, compared to their cores, while the Ktrans values were relatively high all across the LNCaP tumors (Figure 1a and Figure 1c). On the other hand, Ktrans values measured with ProHance were also high across both the tumor models. This result indicates that both PC3 and LNCaP tumors are perfused and vascularized in the tumor rim. The extracellular-extravascular space volume fraction (Ve) values measured with ZD2-Gd(HP-DO3A) were higher in the periphery of the PC3 tumors than the LNCaP ones (Figure 1a and c). Interestingly, ZD2-Gd(HP-DO3A) resulted in a gradual increase in signal intensity in the inner core regions of the PC3 tumors during the period of data acquisition; however, in the LNCaP tumor cores, it showed rapid wash-in and wash-out kinetics, similar to the clinical agent (Figure 1b). This is likely due to the fact that the strong binding of ZD2-Gd(HP-DO3A) to EDB-FN in the rim of the PC3 tumors limits its diffusion into the inner cores at the early stages of DCE-MRI, resulting in relatively low Ktrans values of ZD2-Gd(HP-DO3A) in the PC3 tumor cores. The reversible binding of ZD2-Gd(HP-DO3A) may then lead to its gradual diffusion and binding as well as signal increase in the inner cores over time. These results verified the binding specificity of ZD2-Gd(HP-DO3A) and revealed the intriguing DCE-MRI features that were not presented by conventional non-targeted contrast agents.Discussions
To our knowledge, this is the first time that a targeted contrast agent is tested for prostate cancer imaging in DCE-MRI. Unlike DCE-MRI with a conventional non-targeted imaging agent, the imaging biomarkers revealed by this method is not limited to vascularity, permeability and perfusion of the tumor, but also indicate expression of cancer oncoprotein, EDB-FN, and binding kinetics of agent. The results revealed the differences between high-risk tumors and low-risk tumors in Ktrans, Ve, and binding kinetics. Our study could potentially open a new avenue for DCE-MRI using targeted contrast agents to improve the diagnosis and risk-stratification of prostate cancer.Acknowledgements
This work is funded in part by NIH R01 CA211762.References
1. Alonzi R, Padhani AR, Allen C. Dynamic contrast enhanced MRI in prostate cancer. Eur J Radiol. 2007. 2.Kim JK, Hong SS, Choi YJ, et al. Wash-in rate on the basis of dynamic contrast-enhanced MRI: Usefulness for prostate cancer detection and localization. J Magn Reson Imaging. 2005. 3. Han Z, Li YJ, Roelle S, et al. Targeted Contrast Agent Specific to an Oncoprotein in Tumor Microenvironment with the Potential for Detection and Risk Stratification of Prostate Cancer with MRI. Bioconjugate Chem. 2017. 4. Banerjee S R, Ngen E J, Rotz M W, et al. Synthesis and Evaluation of GdIII‐Based Magnetic Resonance Contrast Agents for Molecular Imaging of Prostate‐Specific Membrane Antigen. Angewandte Chemie International Edition, 2015. 5. Cardenas-Rodriguez J, Howison CM, Pagel MD. A linear algorithm of the reference region model for DCE-MRI is robust and relaxes requirements for temporal resolution. Magn Reson Imaging. 2013. 6. Tofts PS, Brix G, Buckley DL, et al. Estimating kinetic parameters from dynamic contrast-enhanced T 1-weighted MRI of a diffusable tracer: standardized quantities and symbols. Journal of Magnetic Resonance Imaging. 1999.Figures
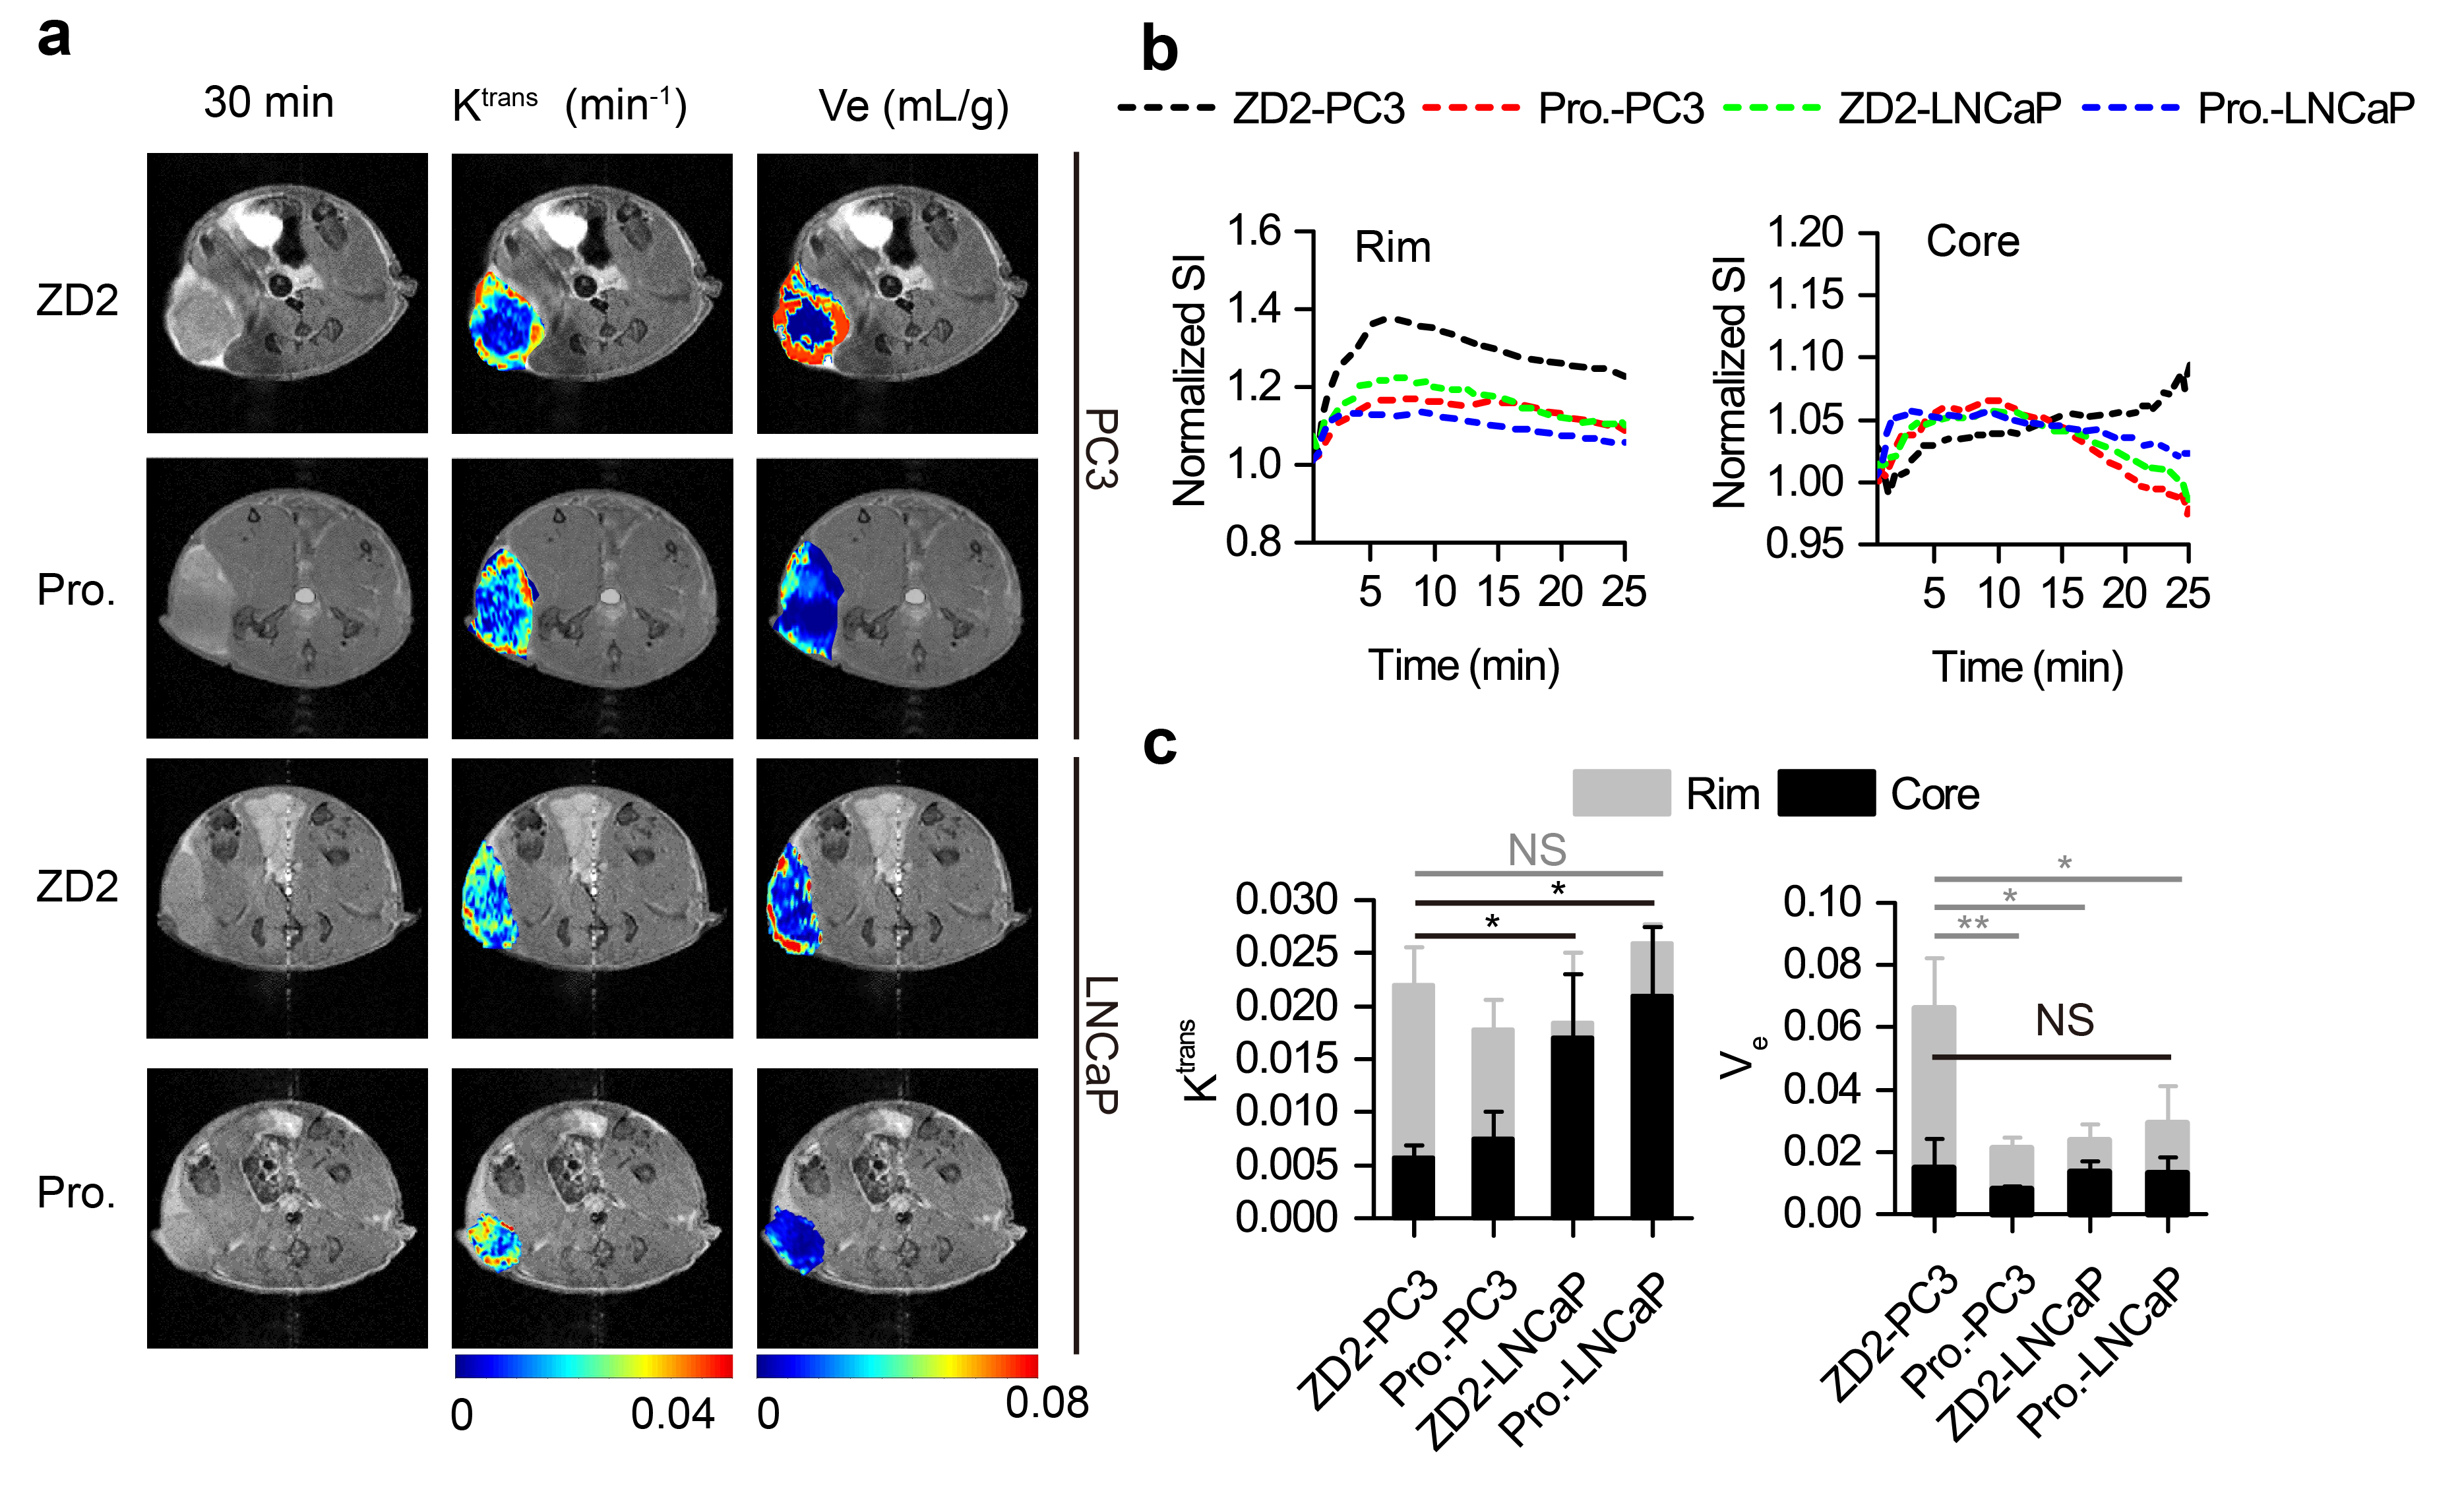
Figure 1. a) Representative axial T1-weighted images, overlaid with color-coded
Ktrans maps and Ve maps at 30 min post-injection of
ZD2-Gd(HP-DO3A) (ZD2) and ProHance (Pro.). b) Dynamic signal intensity in the
tumor rim and tumor core, normalized to the average tumor signal intensity before
contrast injection. c) Comparison of
Ktrans and Ve in the different groups shown in (a) (n = 3-4; NS., not significant for
all tumor rim Ktrans; unpaired two-tailed t-test: *, P < 0.05). Data and statistical
analysis of the tumor rim and core regions are represented in grey and black
colors, respectively.