3940
Tumorigenesis in glioblastoma multiforme: Longitudinal mapping of glioma growth and extracellular pH1Department of Biomedical Engineering, Yale University, New Haven, CT, United States, 2Department of Radiology and Biomedical Imaging, Yale University, New Haven, CT, United States
Synopsis
Tumorigenesis in glioblastoma multiforme (GBM) is complex and depends on interactions of tumor cells with the tumor microenvironment. A limiting factor in translating preclinical GBM treatment studies is being able to longitudinally and non-invasively map the tumor microenvironment in the same tumor over days and weeks. Here we describe a multi-modal MRI study of glioma growth and metabolism in human-derived models of GBM that differ in levels of hypoxia, angiogenesis, and necrosis. We demonstrate successful longitudinal mapping of tumor growth and extracellular pH in the same U87 and U251 gliomas. We find that despite significant tumor growth, acidosis plateaus early.
Introduction
Glioblastomas (GBMs) are the most frequently occurring and aggressive primary CNS tumor in adults1. Although MRI is used for initial detection and size monitoring after treatment2, there remain numerous unmet imaging needs as many findings are nonspecific and do not allow for direct mapping of the tumor microenvironment that may be reflective of treatment response. Tumorigenesis in GBMs is complex and involves metabolic changes in tumor cells and interactions with the extracellular matrix. GBMs undergo a metabolic shift towards glycolysis resulting in acidification of the extracellular environment, which promotes tumor invasion, angiogenesis, and proliferation3,4. Human-derived models of GBM, such as U251 and U87, display many of the microenvironment characteristics of human GBMs including hypoxic regions, enhanced angiogenesis, and development of necrosis. Further, quantitative pHe mapping using Biosensor Imaging of Redundant Deviation in Shifts (BIRDS) has revealed highly acidic tumors where pHe changes reflect tumor viability and response to therapy5,6. However, BIRDS requires the use of paramagnetic contrast agents (TmDOTP5-)7,8 and limitations due to the need for sufficient contrast agent accumulation have previously prevented longitudinal pHe measurements. However, organic anion transporter inhibitors (probenecid), can slow renal clearance of the contrast agent9. Here we demonstrate that a coinfusion of probenecid and TmDOTP5- can allow for repeated longitudinal pHe mapping in the same tumor over time and when combined with multi-modal imaging can be useful in measuring tumor growth and monitoring acidosis in the tumor microenvironment.Methods
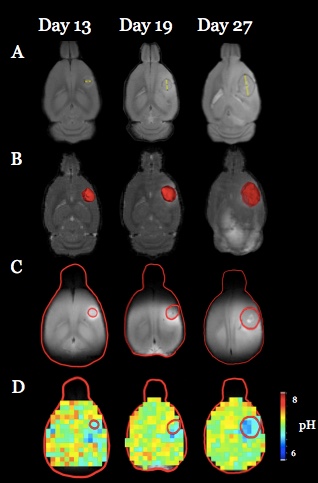
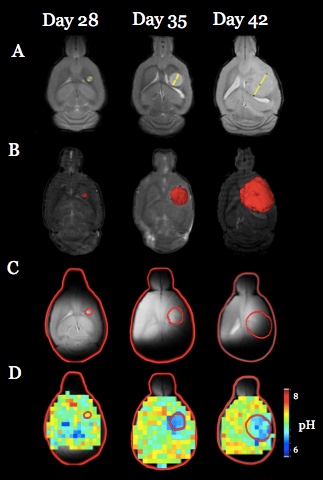
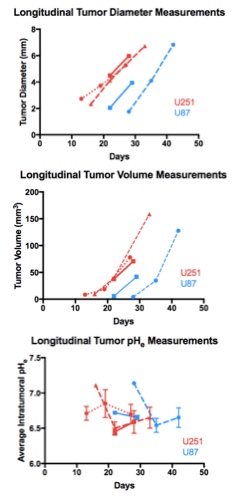
U87 and U251 cells were injected (~6.0x10⁵ cells) intracranially into Athymic/NUDE rats. Tumors were allowed to grow for 10-14 days prior to imaging. All imaging data were acquired using an 11.7T Bruker horizontal-bore spectrometer. Once tumors reached ~2mm diameter, imaging and pHe measurements using BIRDS were performed and repeated every 5-7 days. T2-weighted images were acquired using a spin-echo sequence (TR 6000ms, TE 10-100ms, FOV 25x25mm2, matrix 128x128, slice thickness 1mm). T1-weighted images were acquired before and after 0.25 mmol/kg gadobutrol using a RARE sequence (TE 10ms, TR 400-5000ms, slice thickness 0.7mm with 0.3mm gap). A contrast enhanced T1-weighted 3D FLASH was acquired with TE 5ms, TR 30ms, and 0.33mm isotropic resolution. For BIRDS pHe measurements, 100 mg/kg probenecid was administered and followed after 20 min by a coinfusion of 100 mg/kg probenecid and 1 mmol/kg TmDOTP5-. Chemical shift imaging for BIRDS was performed as previously described6,7 using the H2, H3, and H6 resonances of TmDOTP5- for pHe quantification in each voxel (1 mm3). The average pHe of all voxels within the tumor and spatial distribution of pHe changes from the tumor center was calculated. Tumor volume was measured using contrast-enhanced T1 images and tumor diameter was measured in the slice with the largest cross sectional diameter.Results and Discussion
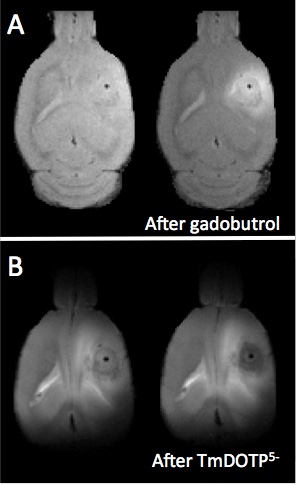
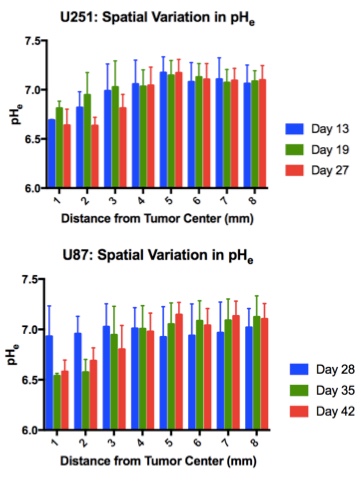
Both U251 (n=3) and U87 (n=2) tumors were monitored longitudinally using pHe measurements from BIRDS and diameter/volume measurements from T2 and contrast-enhanced T1 images. Tumors displayed signal enhancement within the tumor core after gadobutrol infusion on T1-weighted images that corresponded to regions of signal darkening after TmDOTP5- in T2-weighted images (Figure 1) providing multiple contrasts for measuring tumor size/volume. After an initial variable delay, tumor size increased in all tumors as shown in representative time courses for U251 (Figure 2) and U87 (Figure 3) tumors. Further, coinfusion of probenecied and TmDOTP5- allowed for successful longitudinal pHe mapping. At all time points, the intratumoral pHe was lower than the pHe of the brain parenchyma (~7.1) indicating that the pHe within the tumor becomes acidic early during tumor growth, once the tumor becomes detectable by imaging methods. However, as tumors become larger there is no corresponding change in pHe (Figure 4). Although the pHe remains stable or slightly increases at late time points, the volume that is acidified is exponentially larger as represented in the progression of the spatial variation in pHe (Figure 5), indicating significant changes in metabolic output despite the small variations in pHe. Given the variation in pHe within the tumor and at the tumor boundary, further characterization of the spatial pHe changes within the tumor microenvironment may shed insights into parenchymal transformation as well as the role of surrounding stroma on tumor growth.Conclusion
Using a combination of probenecid and TmDOTP5- allows for successful longitudinal BIRDS pHe quantification in both intratumoral regions and the surrounding parenchyma. The pHe is acidic at early time points and remains acidic as the tumor continues to grow. The acidic intratumoral pHe may create an environment that is conducive for tumor cells to invade10. Furthermore these results also suggest a biomarker of tumor metabolism that is independent of tumor size and may in future studies be used to monitor treatment response.Acknowledgements
Supported by NIH: R01EB-011968 (FH), R01EB-023366 (FH), R01CA-140102 (FH), P30NS-052519 (FH) and T32GM-007205 (Yale MSTP).References
1. Woehrer A, Bauchet L, and Barnholtz-Sloan JS. Glioblastoma survival: has it improved? Evidence from population-based studies. Curr Opin Neurol. 2014; 27:666-674.
2. Ryken TC, Aygun N, Morris J, Schweizer M, Nair R, Spracklen C, Kalkanis SN, and Olson JJ. The role of imaging in the management of progressive glioblastoma: a systematic review and evidence-based clinical practice guideline. J Neurooncol. 2014; 118: 435-460.
3. Gatenby RA and Gillies RJ. Why do cancers have high aerobic glycolysis? Nature Reviews Cancer 2004; 4:891-899.
4. Webb, BA, Chimenti M, Jacobson MP, and Barber DL. Dysregulated pH: A perfect storm for cancer progression. Nature Reviews Cancer 2011; 11:671-677.
5. Coman D, Huang Y, Rao JU, DeFeyter HM, Rothman DL, Juchem C, and Hyder F. Imaging the intratumoral-peritumoral extracellular pH gradient of gliomas. NMR Biomed. 2016; 29:309-319.
6. Rao JU, Coman D, Walsh JJ, Ali MM, Huang Y, Hyder F. Temozolomide arrests glioma growth and normalizes intratumoral extracellular pH. Scientific Reports 2017; 7(1):7865.
7. Coman, D, Trubel HK, Rycyna RE, and Hyder F. Brain temperature and pH measured by 1H chemical shift imaging of a thulium agent. NMR Biomed. 2009; 22:229-239.
8. Coman D, De Graaf RA, Rothman DL, and Hyder F. In vivo three-dimensional molecular imaging with Biosensor Imaging of Redundant Deviation in Shifts (BIRDS) at high spatiotemporal resolution. NMR Biomed. 2013; 26:1589-1595.
9. Huang Y, Coman D, Herman P, Rao JU, Maritim S, and Hyder F. Towards longitudinal mapping of extracellular pH in gliomas. NMR Biomed. 2016; 29(10):1364-1372.
10. Robey IF, Baggett BK, Kirkpatrick, ND, et al. Bicarbonate increases tumor pH and inhibits spontaneous metastases. Cancer Research 2009; 69:2260-2268.
Figures