3938
Monitoring theragnostic drug delivery in tumors using Fe(III) metal crosslinked-micelles at 7T1Moffitt Cancer Center, Tampa, FL, United States, 2Intezyne Technologies, Tampa, FL, United States
Synopsis
Stabilized micelles have shown prolonged blood circulation and targeting to solid tumors through enhanced permeability and retention (EPR) effect. It has been demonstrated that Intezyne's Versatile Encapsulation and Crosslinking Technology (IVECT™) has the advantage of allowing the micelles to be crosslinked via a pH-sensitive Fe(III) metal coordination reaction that permeates xenografted tumors and clears from circulation without retention in the kidneys or liver. In this work we developed a theragnostic method to study drug delivery over time of IVECT by T1-weighted image histogram and image intensity in the tumor, kidneys, liver and muscle in a HCT116 Xenograft Model.
INTRODUCTION
Polymeric micelle platforms incorporating therapeutic agents, molecular targeting, and diagnostic imaging capabilities has become a promising tool in drug delivery and molecular imaging applications. Stabilized micelles have shown prolonged blood circulation and targeting to solid tumors through enhanced permeability and retention (EPR) effect 1,2. Although the leaky vasculature of tumors enhances micelle accumulation in tumor tissues, in some cases, significant micelle uptake has also been observed in liver and spleen. For this reason proper monitoring is needed especially during drug delivery. It has been demonstrated that Intezyne's Versatile Encapsulation and Crosslinking Technology (IVECT™) has the advantage of allowing the micelles to be crosslinked via a pH-sensitive Fe(III) metal coordination reaction that permeates xenografted tumors 3. Furthermore, these Fe-containing particles, have a spherical shell that encapsulates its contents, and possess longitudinal and transverse relaxivities that together provide positive contrast in T1-weighted images 3. In this work we developed a T1 monitoring method to monitor and study drug delivery over time of IVECT by using the image histogram and calculating the mean and standard deviation of the signal in the tumor, kidneys, liver and muscle over a course of a week in a HCT116 Xenograft Model.METHODS
All the experiments were done in a 7T horizontal magnet (ASR 310, Agilent Technologies, Inc.) with 205/120/HDS gradients and 310 mm bore, using a 35-mm Litzcage coil (Doty Scientific). Three nude mice, HCT116 Xenograft Tumor Model, were injected with IT-141 (IVECT encapsulated SN-38) via tail vein. Mice were anesthetized with 2% isoflurane and restrained in a specific holder. Whole body coronal slices were acquired using a multislice spin-echo (SEMS) sequence with TR/TE = 315/7.43ms, 17 slices, 1 mm slice thickness and 2 averages, FOV = 80 x 40 mm 256 x 128 pixels. Images were acquired before drug injection, and again at 6, 24, 48, 72, and 96 hours to monitor drug delivery and clearance. Tumors were manually segmented using a Matlab script to calculate mean and standard deviation of each entire tumor as well as tumor histograms. Regions of Interest (ROIs) in kidneys, liver, and muscle were also drawn manually with the same Matlab script to monitor drug clearance.RESULTS AND DISCUSSION
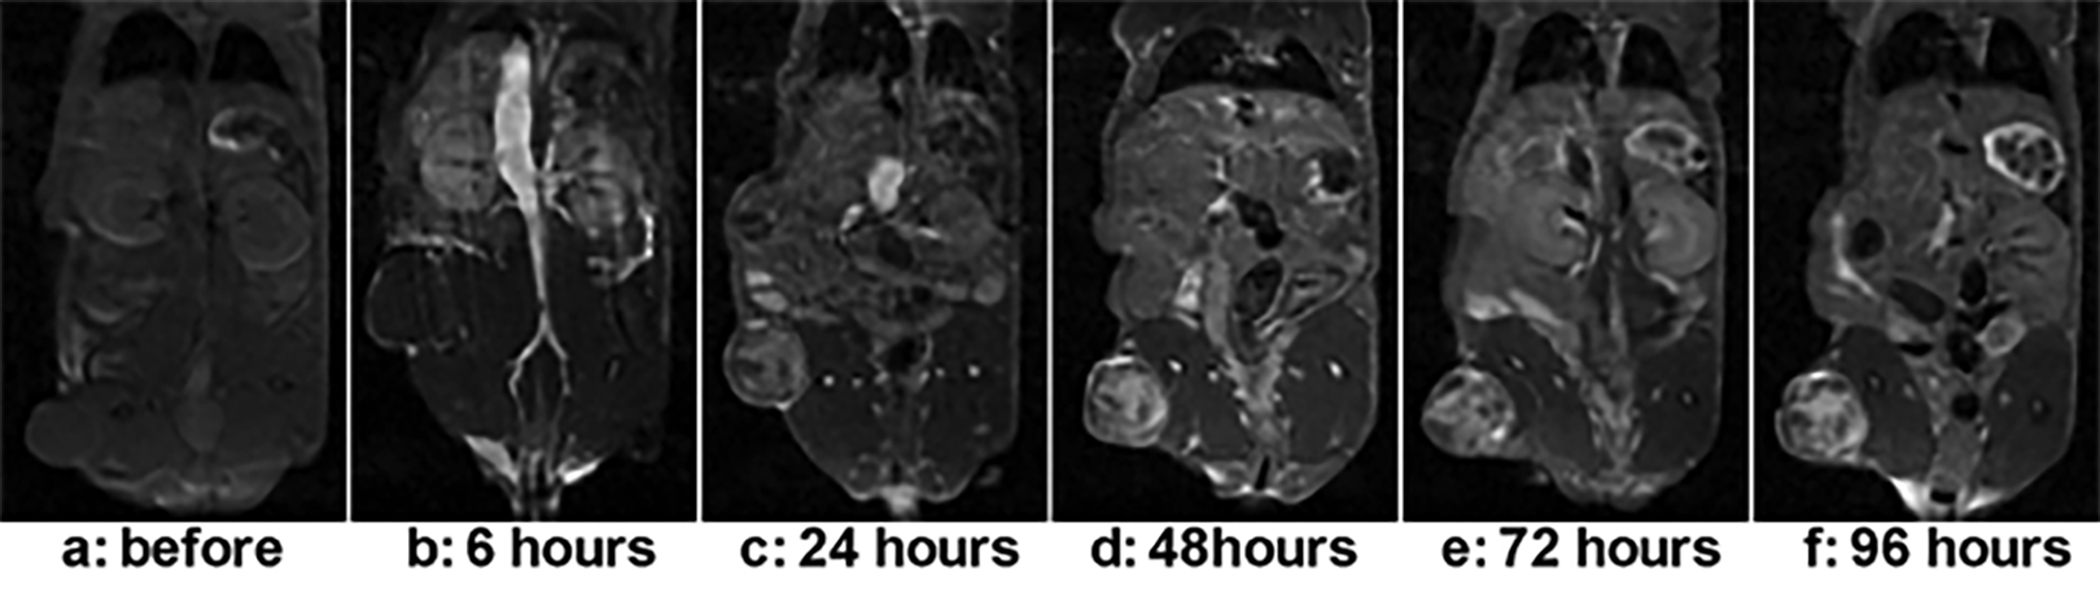
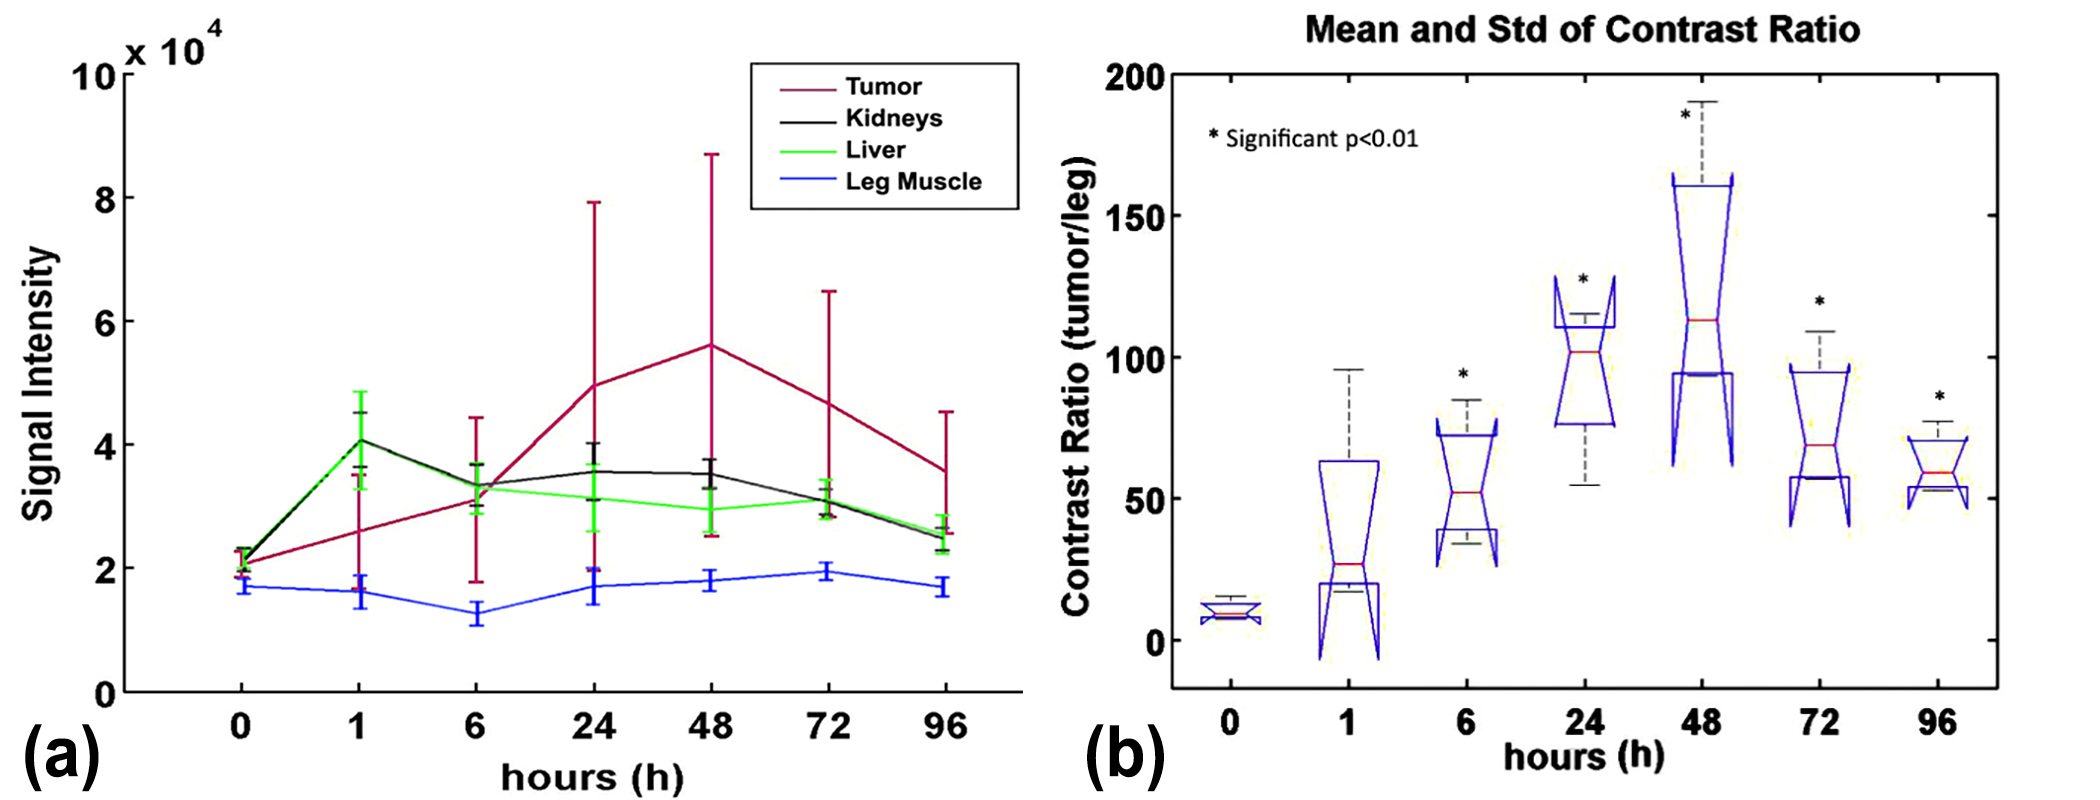
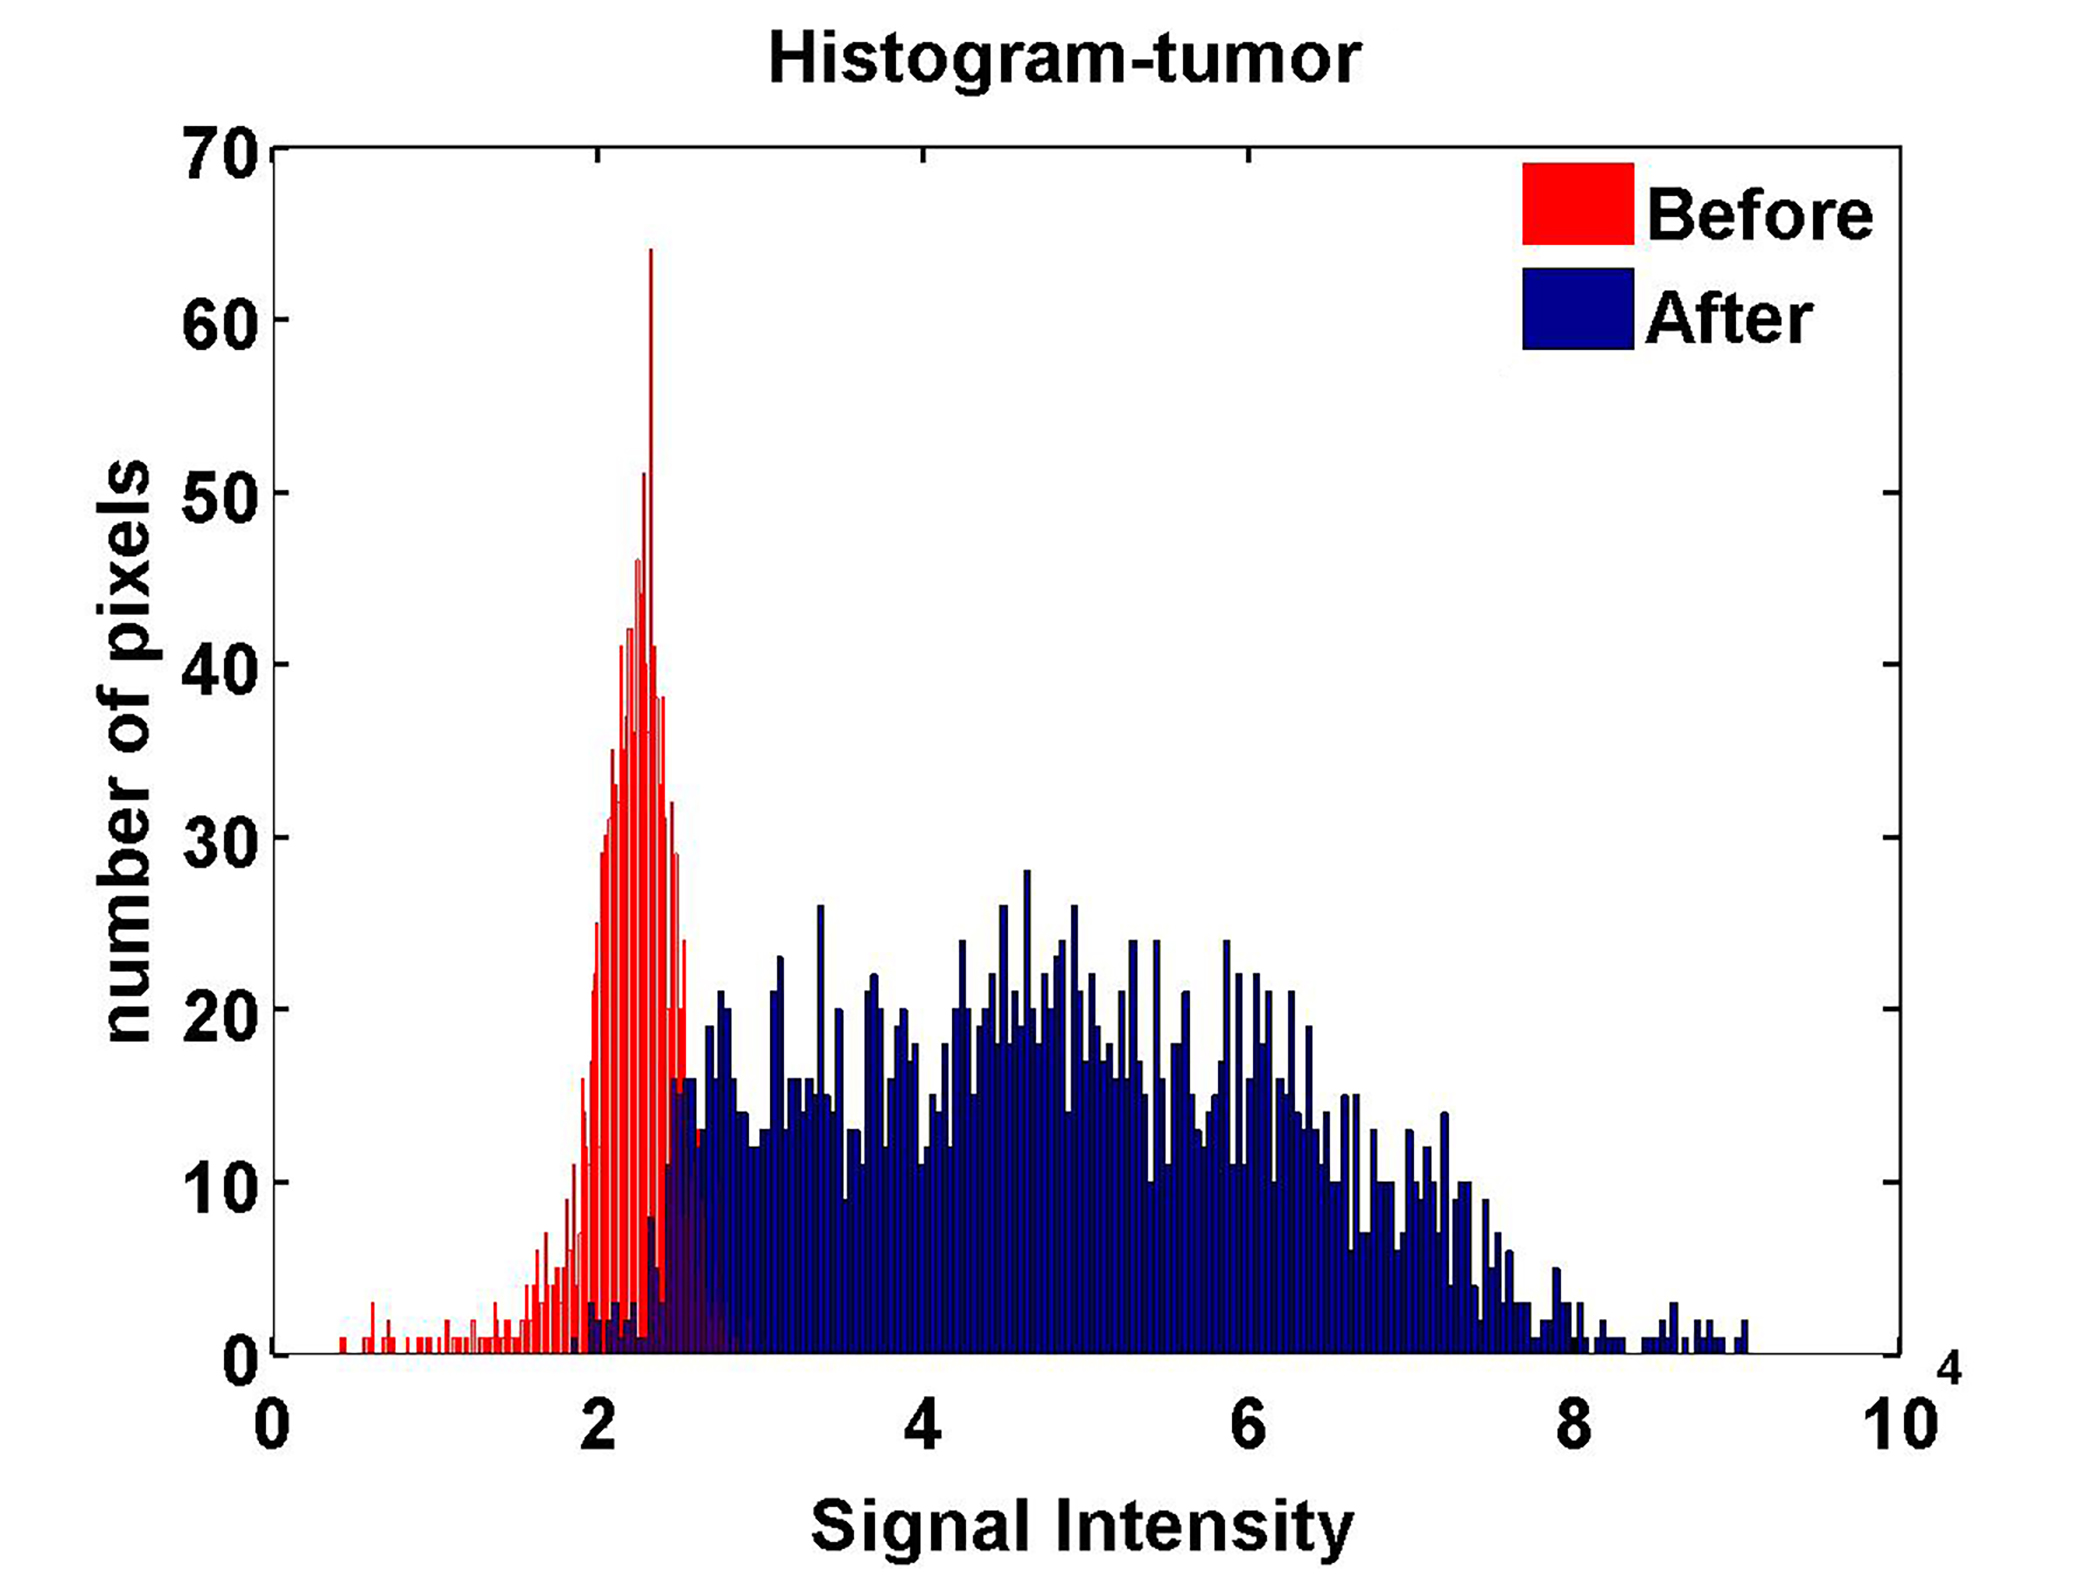
Figure 1 shows representative images of a mouse before and at 6, 24, 48, 72 and 96 hours post injection of IVECT™. At 6 hours the IVECT is still present in the circulatory system and starting to accumulate around the periphery of the tumor. After 24 hours the contrast increases accumulation inside the tumor with a maximum contrast in the tumor at 48 hours for all 3 mice, as shown in figure 1. The graph in figure number 2(a) shows the mean and standard deviation of the signal on tumor, kidneys, liver and leg muscle over the course of 96 hours. The contrast, in the kidneys and liver, peaks at 1 hour (black and green colors), mostly because of the contrast in the circulatory system. These organs are well perfused, while in the leg muscle (in blue) there is no sign of the contrast during the entire 96 hours. Both, the mean value of the signal and standard deviation, are at maximum in the tumor at 48h. Contrast ratio tumor to leg was calculated for each time point and analysis of variance was performed as shown in Figure 2b. There are significant differences in contrast after 6h with maximum at 48h. Figure 3 shows the histogram of the tumor ROI before and 48h after injection. The histogram of the tumor, before injection, is narrow (shown in red); which supports the poor contrast within the tumor at this time point (Fig 1a ). At 48 hours the histogram (shown in blue) is broad with maximum intensity in contrast to control. This means there is a much higher contrast within the tumor with higher signal intensity compared to the pre-injection histogram.CONCLUSIONS
In this work we describe a method for theragnostic monitoring drug delivery of IVECT IT-141. Using ROIs in tumor, kidneys, liver and muscle we were able to determine the peak of micelle accumulation in the tumor compared to the other tissues. Significant differences in tumor contrast after 6h with maximum at 48h was confirmed by analysis of variance. This work demonstrates that IVECT IT-141 can be used to monitor drug delivery and deposition in the tumor with MRI.Acknowledgements
Research reported in this publication was supported by the National Cancer Institute of the National Institutes of Health under Award Number U43CA179468 and under Contract No. HHSN261201400018C.References
1. Maeda H, Wu J, Sawa T, Matsumura Y, Hori K. Tumor vascular permeability and the epr effect in macromolecular therapeutics: a review. J Control Release 2000;65:271-84.
2. Maeda H, Sawa T, Konno T. Mechanism of tumor-targeted delivery of macromolecular drugs, including the EPR effect in solid tumor and clinical overview of the prototype polymeric drug SMANCS. J Control Release 2001;74:47-61.
3. Bakewell SJ, Carie A, Costich TL, Sethuraman J, Semple JE, Sullivan B, Martinez GV, Dominguez-Viqueira W, Sill KN. Imaging the delivery of drug-loaded, iron-stabilized micelles. Nanomedicine: Nanotechnology, Biology and Medicine. Online publication January 2017
Figures