3935
MEMRI-guided preclinical trial of an experimental TAM-targeted therapy in mouse medulloblastomaHari Rallapalli1, I-Li Tan2, Alexandre Wojcinski2, Alexandra L Joyner2, and Daniel H Turnbull1
1New York University School of Medicine, New York, NY, United States, 2Sloan Kettering Institute, New York, NY, United States
Synopsis
Using our high-throughput MEMRI pipeline, presented previously, we tested an experimental anticancer drug in mouse models of sporadic medulloblastoma.
Purpose
Approximately 95% of anticancer drugs fail in Phase 1/Phase 2 clinical trials after demonstrating sufficient efficacy in preclinical trials. One possible contributing factor is the prevalence of non-orthotopic tumor allograft or patient-derived xenograft animal models and the use of invasive or qualitative measurement tools in preclinical study of novel anticancer therapeutics. We have developed a high-throughput, manganese enhanced MRI (MEMRI) - based pipeline to test such drugs in sporadic mouse models of medulloblastoma1. We have applied this pipeline to test the efficacy of an experimental CSF1R-inhibiting drug designed to reduce the number of tumor associated microglia and macrophages (TAMs).Methods
Mice expressing an oncogenic form of Smoothened (SmoM2) in rare cerebellar granule precursors were made by generating mice carrying an Atoh1-CreER 2 transgene and R26loxPSTOPloxP-SmoM2 (R26LSL-SmoM2)3 allele as a model for the Sonic Hedgehog (SHH) subgroup of human medulloblastoma. Expression of the SmoM2 oncogene was induced by subcutaneous injection of low doses (1µg/g or 5µg/g) of Tamoxifen (TMX) at postnatal day (P)2. Pre-treatment MEMRI sessions using 7-Tesla MRI (Bruker) were conducted at postnatal week 5 (W5) and W7. MnCl2 (50-60 mg/kg) was injected intraperitoneally 24 hours before imaging. Scan protocol: 1 min low-resolution pilot, 21min 150µm isotropic resolution T1-weighted gradient echo (GE) sequence (TE/TR = 4/30 ms; FA = 20°; FOV = 19.2 mm × 19.2 mm × 12 mm; Matrix = 128 × 128 × 80). Tumor volumes were quantified after each imaging time point by semi-automated segmentation in Amira. An absolute volume threshold of 7mm3 was applied to W5 and W7 tumor volume data to predict progression outcome (e.g. ‘progressing’ or ‘regressing’) based on preliminary data. ‘Regressing‘ animals were excluded from the study. Mice with ‘Progressing’ tumors were randomly assigned to treatment (DRUG, n=16 mice) or control (CTL, n=16 mice) arms, and fed either drug-laden or vehicle-laden chow. Imaging continued biweekly from W9 to W13. Animals were sacrificed post-imaging at W13 for either FACS or histopathology. Assessment of tumor volume changes pre/post treatment was used as the primary metric for drug efficacy.Results
The MEMRI-based pipeline provided a sensitive method for estimating changes in tumor volume (Fig. 1). Absolute volume thresholding at 7mm3 correctly selected for ‘progressing’ tumors in 75% (n = 6/8) of mice, and for ‘regressing’ tumors in approximately 67% (n = 4/6) of mice. Response to treatment was heterogeneous, and TMX dose-dependent (Fig. 2). In both the 1µg/g and 5µg/g TMX models, immunohistological analysis showed that the number of TAMs was reduced in the DRUG compared to the CTL groups (Fig. 2). Normalized tumor volumes did not significantly differ between DRUG (Fig. 2A, red, n = 14) and CTL (Fig. 2A, green, n = 14) groups in the 1µg/g TMX model (Fig. 2C, p = 0.2582), and approximately 57% (n = 8/14) of DRUG tumors regressed after treatment, compared to 42% (n = 6/14) of CTL tumors. Heterogenous response was also observed in the 5µg/g TMX model, although normalized tumor volumes were statistically different between DRUG (n = 12) and CTL (n = 12) groups in the 5µg/g TMX model (Fig. 2C, p = 0.043). Approximately 83% of DRUG tumors (Fig. 2B, red, n = 10/12) regressed after treatment, compared to 33% (Fig. 2B, green, n = 4/12) of CTL tumors. These preliminary results have guided ongoing study of drug efficacy in the 5µg/g TMX model to improve the statistical power and verify whether there is a real response to the TAM-targeted drug.Discussion and Future Directions
Our high-throughput, MEMRI-driven preclinical pipeline revealed unanticipated heterogeneity between individual tumors in terms of growth rates, and in the progression of tumors within an individual animal. This highlights the critical need for in vivo imaging in preclinical studies of anticancer drugs. In future, we plan to explore targeted imaging methods, such as immune cell molecular imaging, to extend and improve our analysis of TAM-targeted therapy in medulloblastoma.Acknowledgements
This work was made possible by NIH grants R01NS038461 (DHT) and R01CA192176 (ALJ).References
- Rallapalli, H. et al. A High Throughput, MEMRI-Based Imaging Pipeline to Study Mouse Models of Sporadic Human Cancer. ISMRM (2017)
- Machold, R. & Fishell, G. Math1 Is Expressed in Temporally Discrete Pools of Cerebellar Rhombic-Lip Neural Progenitors. Neuron 48, (2005).
- Mao, J. et al. A novel somatic mouse model to survey tumorigenic potential applied to the Hedgehog pathway. Cancer Res. 66, 10171–8 (2006).
Figures
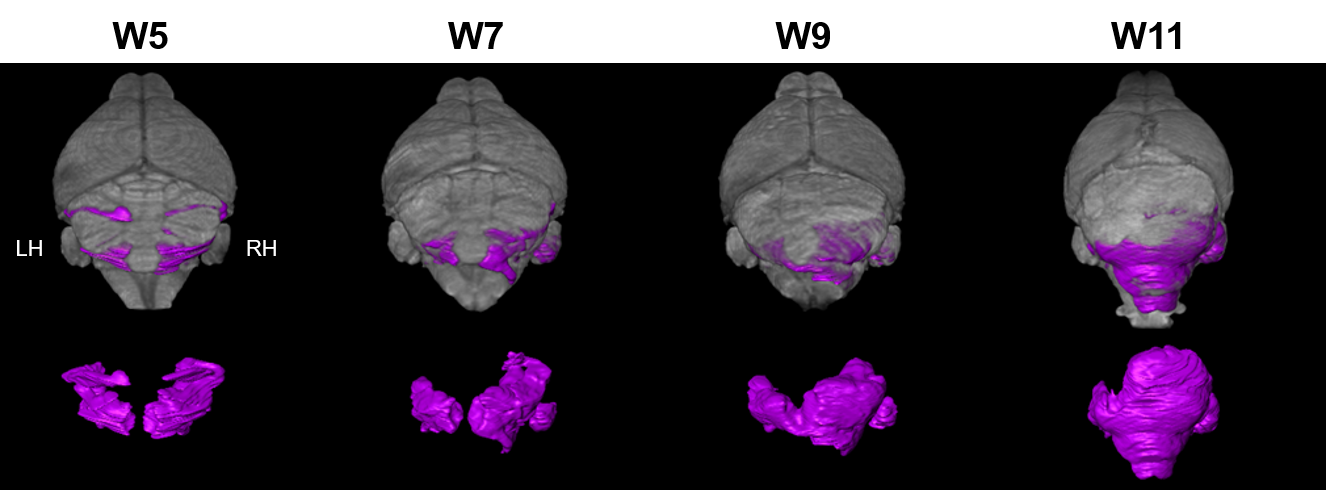
Figure 1. MEMRI potentiates
longitudinal study of heterogeneous tumor progression in mouse models of
sporadic human cancer. TOP: 3D-rendered MEMRI datasets show distribution of
early lesions at W5 (purple) in the lateral cerebellar hemispheres and full
tumor morphology at W11. BOTTOM: Lesions were apparent in both posterior
cerebellar hemispheres at W5. The lesion in the left hemisphere (LH) appeared
to regress while the lesion in the right hemisphere (RH) grew under the vermis.
At W11, it was apparent that the RH tumor is the primary source of the tumor
burden in this animal while the LH tumor persisted but did not grow in volume.
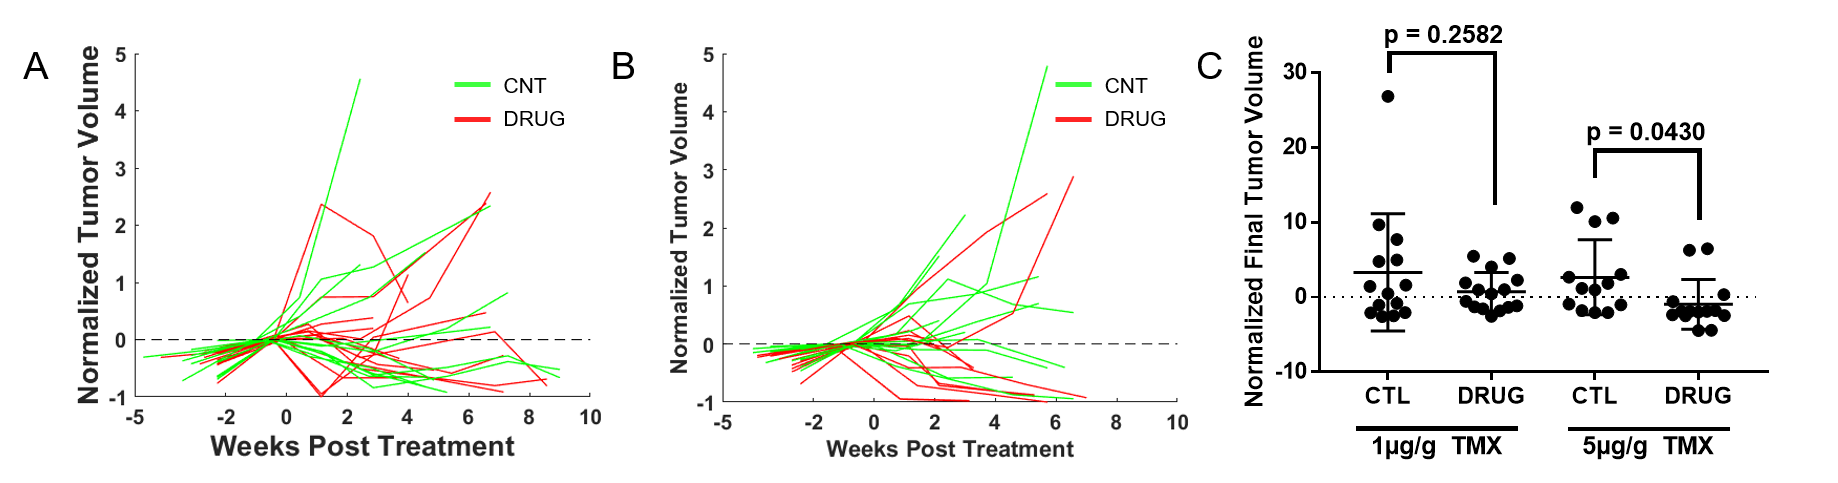
Figure 2. Preliminary
drug efficacy results were heterogeneous and TMX dose dependent. Normalized
tumor volume {(V(t) – VPT)/VPT} over time did not differ between CTL and DRUG groups in 1µg/g TMX dose model
(A), but may be altered in the DRUG group in the 5µg/g TMX dose model (B). VPT is the pre-treatment tumor volume, and V(t) is the volume at
each post-treatment time t (in weeks). Normalized final tumor volumes {(VF – VPT)/VPT} were not significantly different between CTL
and DRUG groups in the 1µg/g TMX dose model, but were statistically different
between CTL and DRUG groups in the 5µg/g TMX dose model (C).