3932
Towards quantitative multiparametric evaluation of response to treatment following loco-regional treatment for HCC- pilot study.1Radiology, Medanta Hospital, Gurgaon, India, 2IIT Delhi, Delhi, India
Synopsis
The aim of the present study was to explore the feasibility and utility of quantitative volumetric change in ADC, tumor volume and percentage differential enhancement in the various phases in being able to predict response to treatment following loco-regional therapy (LRT).This IRB approved pilot study included 40 consecutive patients following LRT for
Introduction
Hepatocellular carcinoma (HCC) is the most common liver cancer, however, only 10-20% of the patients are eligible for curative surgical treatment. Non surgical loco-regional therapy (LRT) include Trans-arterial chemoembolization (TACE), Trans-arterial radioembolization (TARE), radiofrequency ablation (RFA), microwave ablation (MWA). The ultimate goal of LRT for HCC is tumor cell death and necrosis. Accurate assessment of response to therapy requires an evaluation of tumor size, margins, and necrosis as well as early detection of residual or recurrent tumor 1. Visual qualitative assessment of tumor necrosis seen as non-enhancing tissue based on contrast-enhanced dynamic imaging is routinely used to predict response to treatment this is however prone to inter-rater bias and is reader dependant. LIRADS 2017 2 has recently come up with discrete criteria to evaluate and report response to treatment, however, this is also not quantitative.
The aim of the present study was to explore the feasibility and utility of quantitative volumetric change in ADC, tumour volume and percentage differential enhancement in the various phases in being able to predict response to treatment following LRT.
Methods
This IRB approved pilot study included 40 consecutive patients (n=10 with residual disease, n=30 with complete response) following LRT for HCC (n=28 RFA, n=8 TACE, n=4 combined RFA and TACE). Patients with baseline imaging,1,3 and 6 months follow up dynamic contrast-enhanced MRI were included in our study. The final outcome was based on 6 months follow up on imaging in consensus with two expert abdominal radiologists. Images included in the final analysis were T1 fat-suppressed spoiled 3-D GRE before and after dynamic injection of 0.1 mmol/kg of gadobenate dimeglumine at the rate of 2 ml/kg. The images were acquired at 4-time point: Arterial phase (25-35 sec), portal phase (45-60 sec), hepatic-venous phase/equilibrium (60-75 sec), delayed phase (03 min). Respiratory triggered fat suppressed single shot echo-planar imaging DWI was performed in axial plane with tri-directional diffusion gradients using 3b values of 0, 50 and 500 s/mmsq.
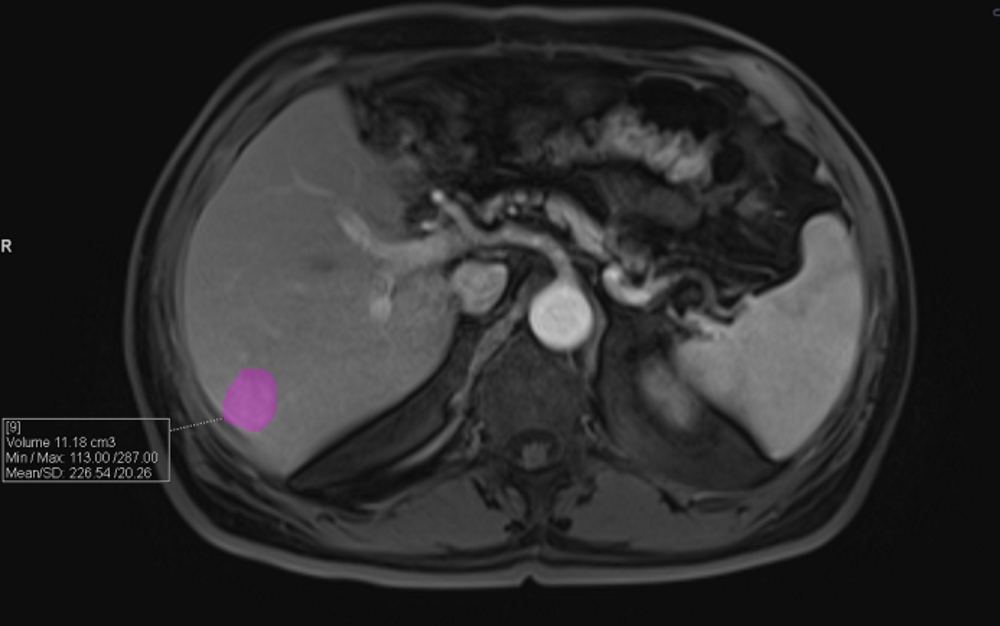
Images were anonymised and analysed on dedicated MMWP workstation. A volume of interest was generated by hand drawing around the lesion similar voxel VOI were extrapolated at the same anatomical site in both pre-contrast and post-contrast dynamic images. The mean volumetric enhancement of particular phase was calculated by the formula:
(Mean signal intensity in particular phase - Mean Signal intensity in precontrast phase) / (Mean Signal intensity in precontrast phase)
Percentage of mean volumetric enhancement was calculated at each phase. Images were evaluated at pre-treatment, post-treatment time point 1 (post- LRT 1 month) and time point 2 (post- LRT 3 month). In line software generated ADC maps based on b values as given above. VOI was hand drawn on the lesion in ADC maps- mean ADC value was used for data analysis.
Percentage change in arterial, portal venous and hepatic-venous differential enhancement, as well as change in ADC and tumor volume at time point 1 and 2, was calculated for all values
Median values of group 1 with residual disease and group 2 with no residual disease were compared. Two-tailed t-test was used to compare the various values.
Results
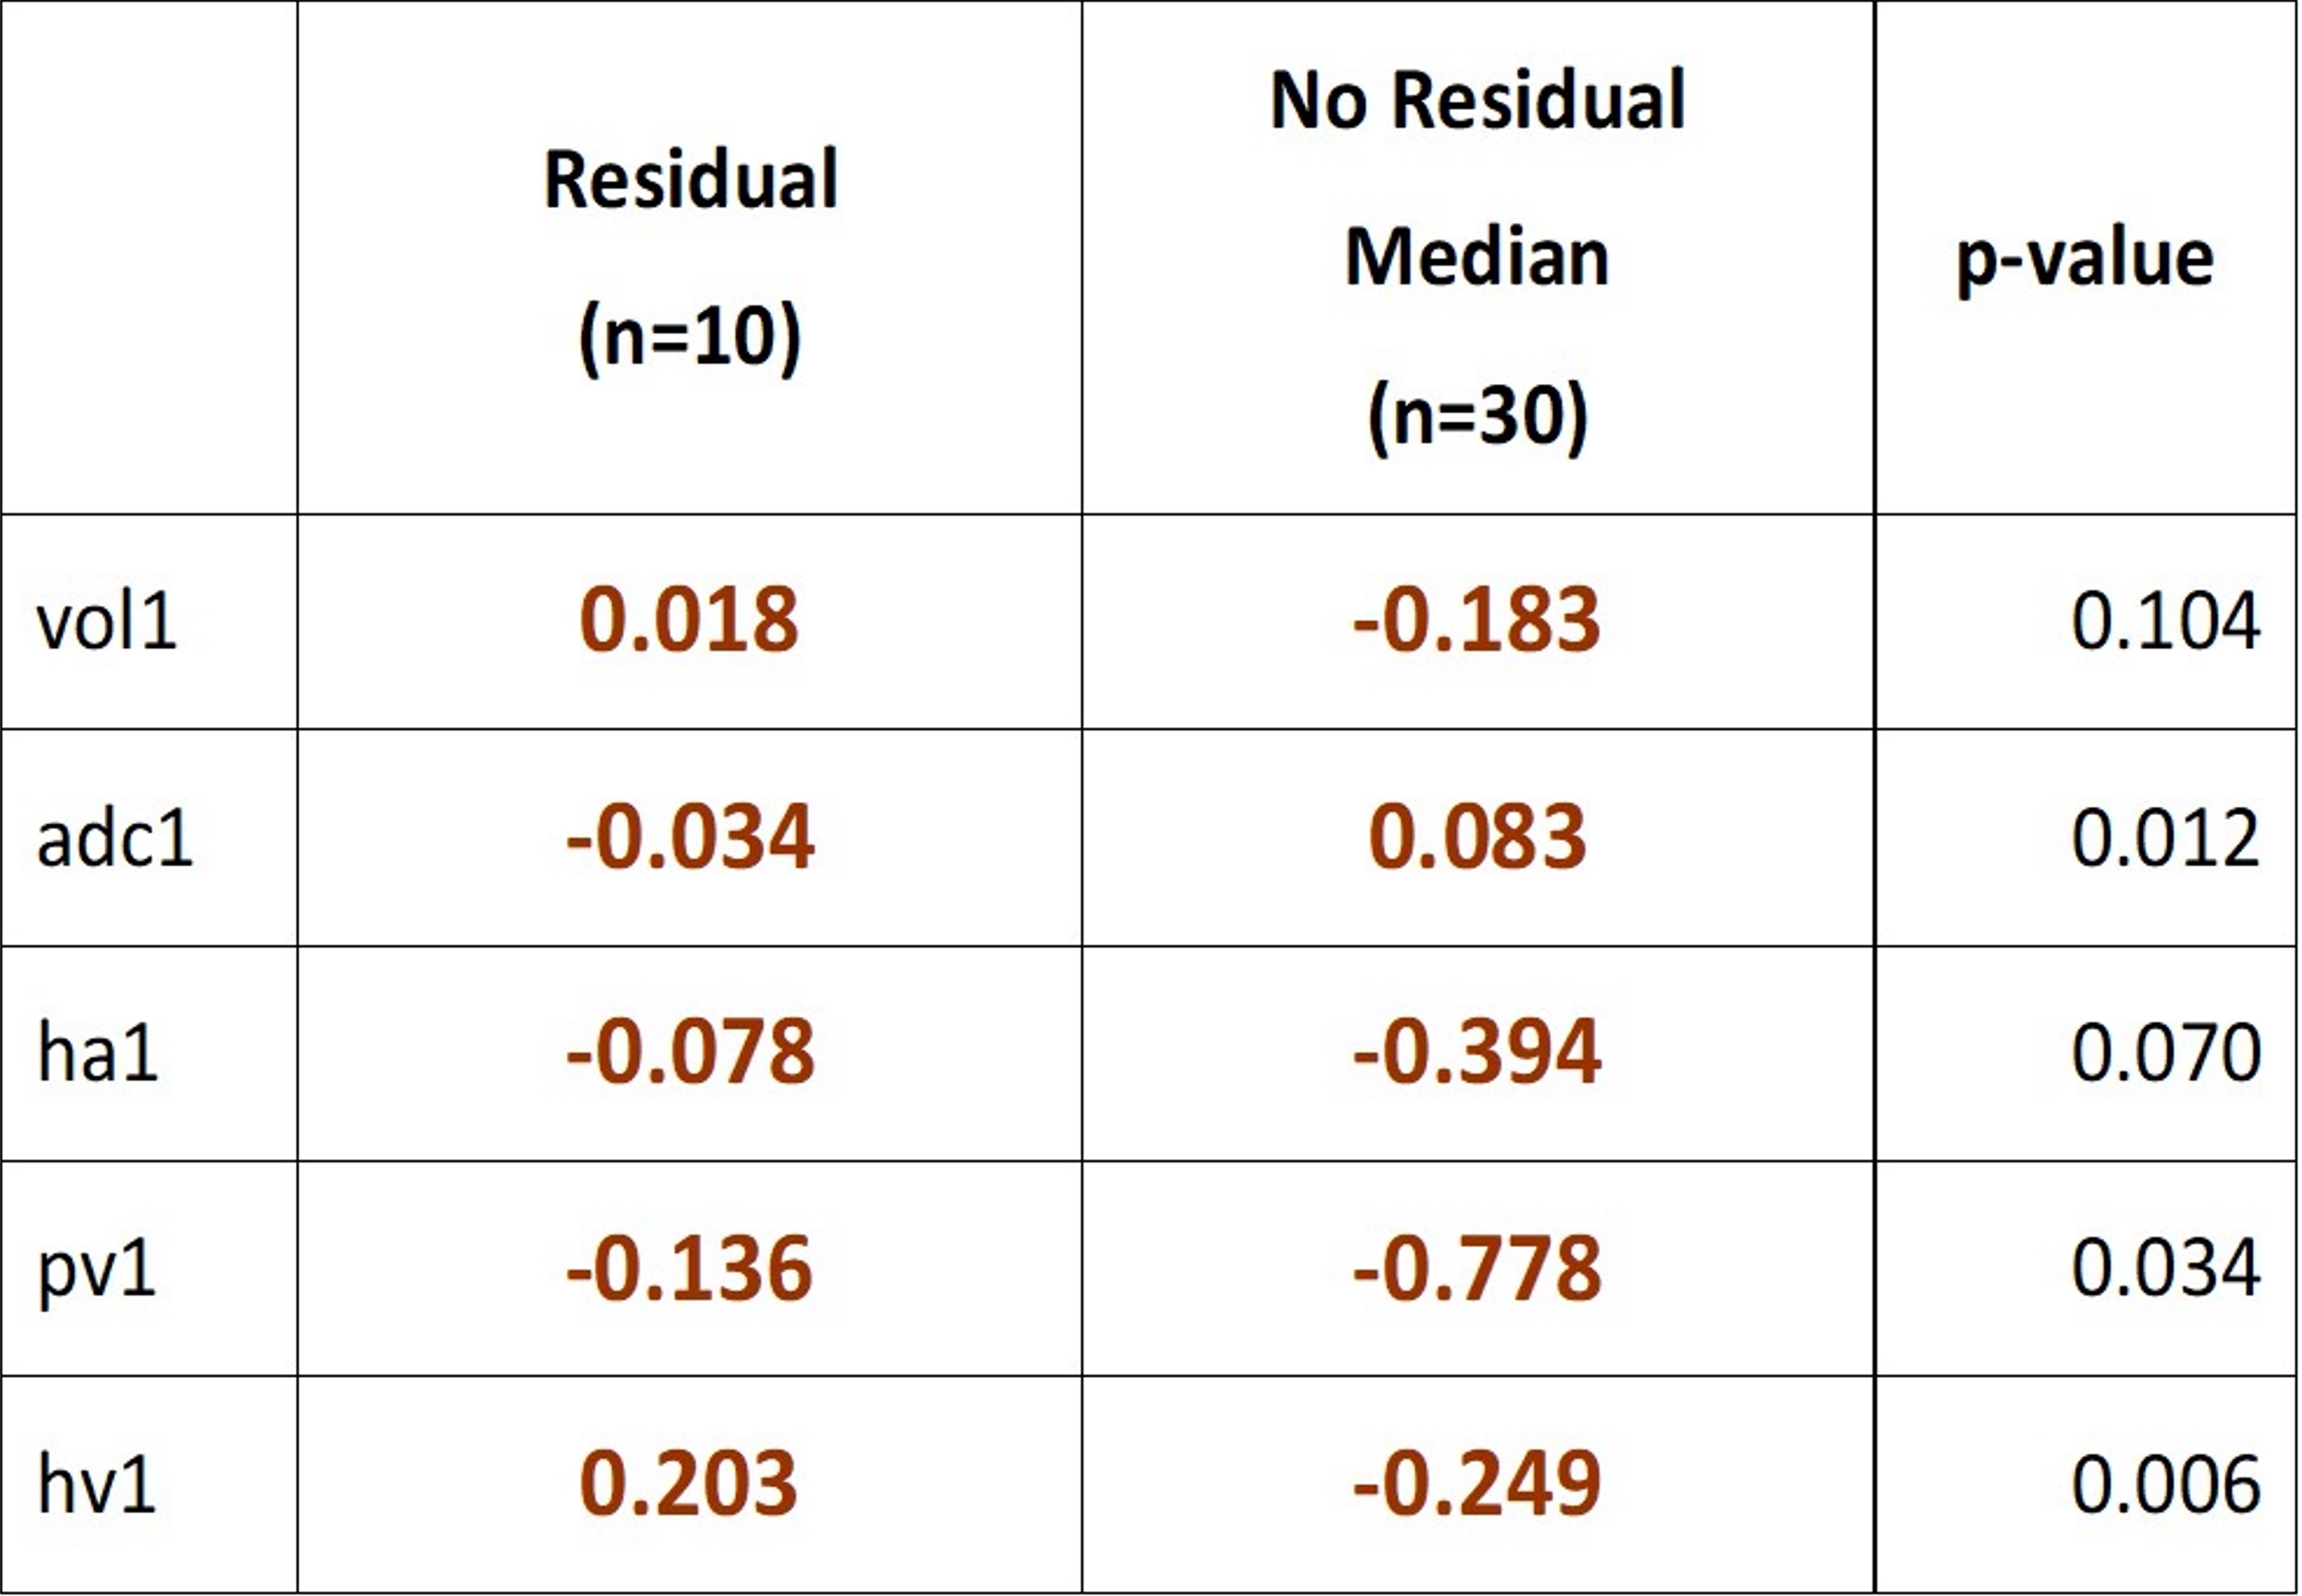
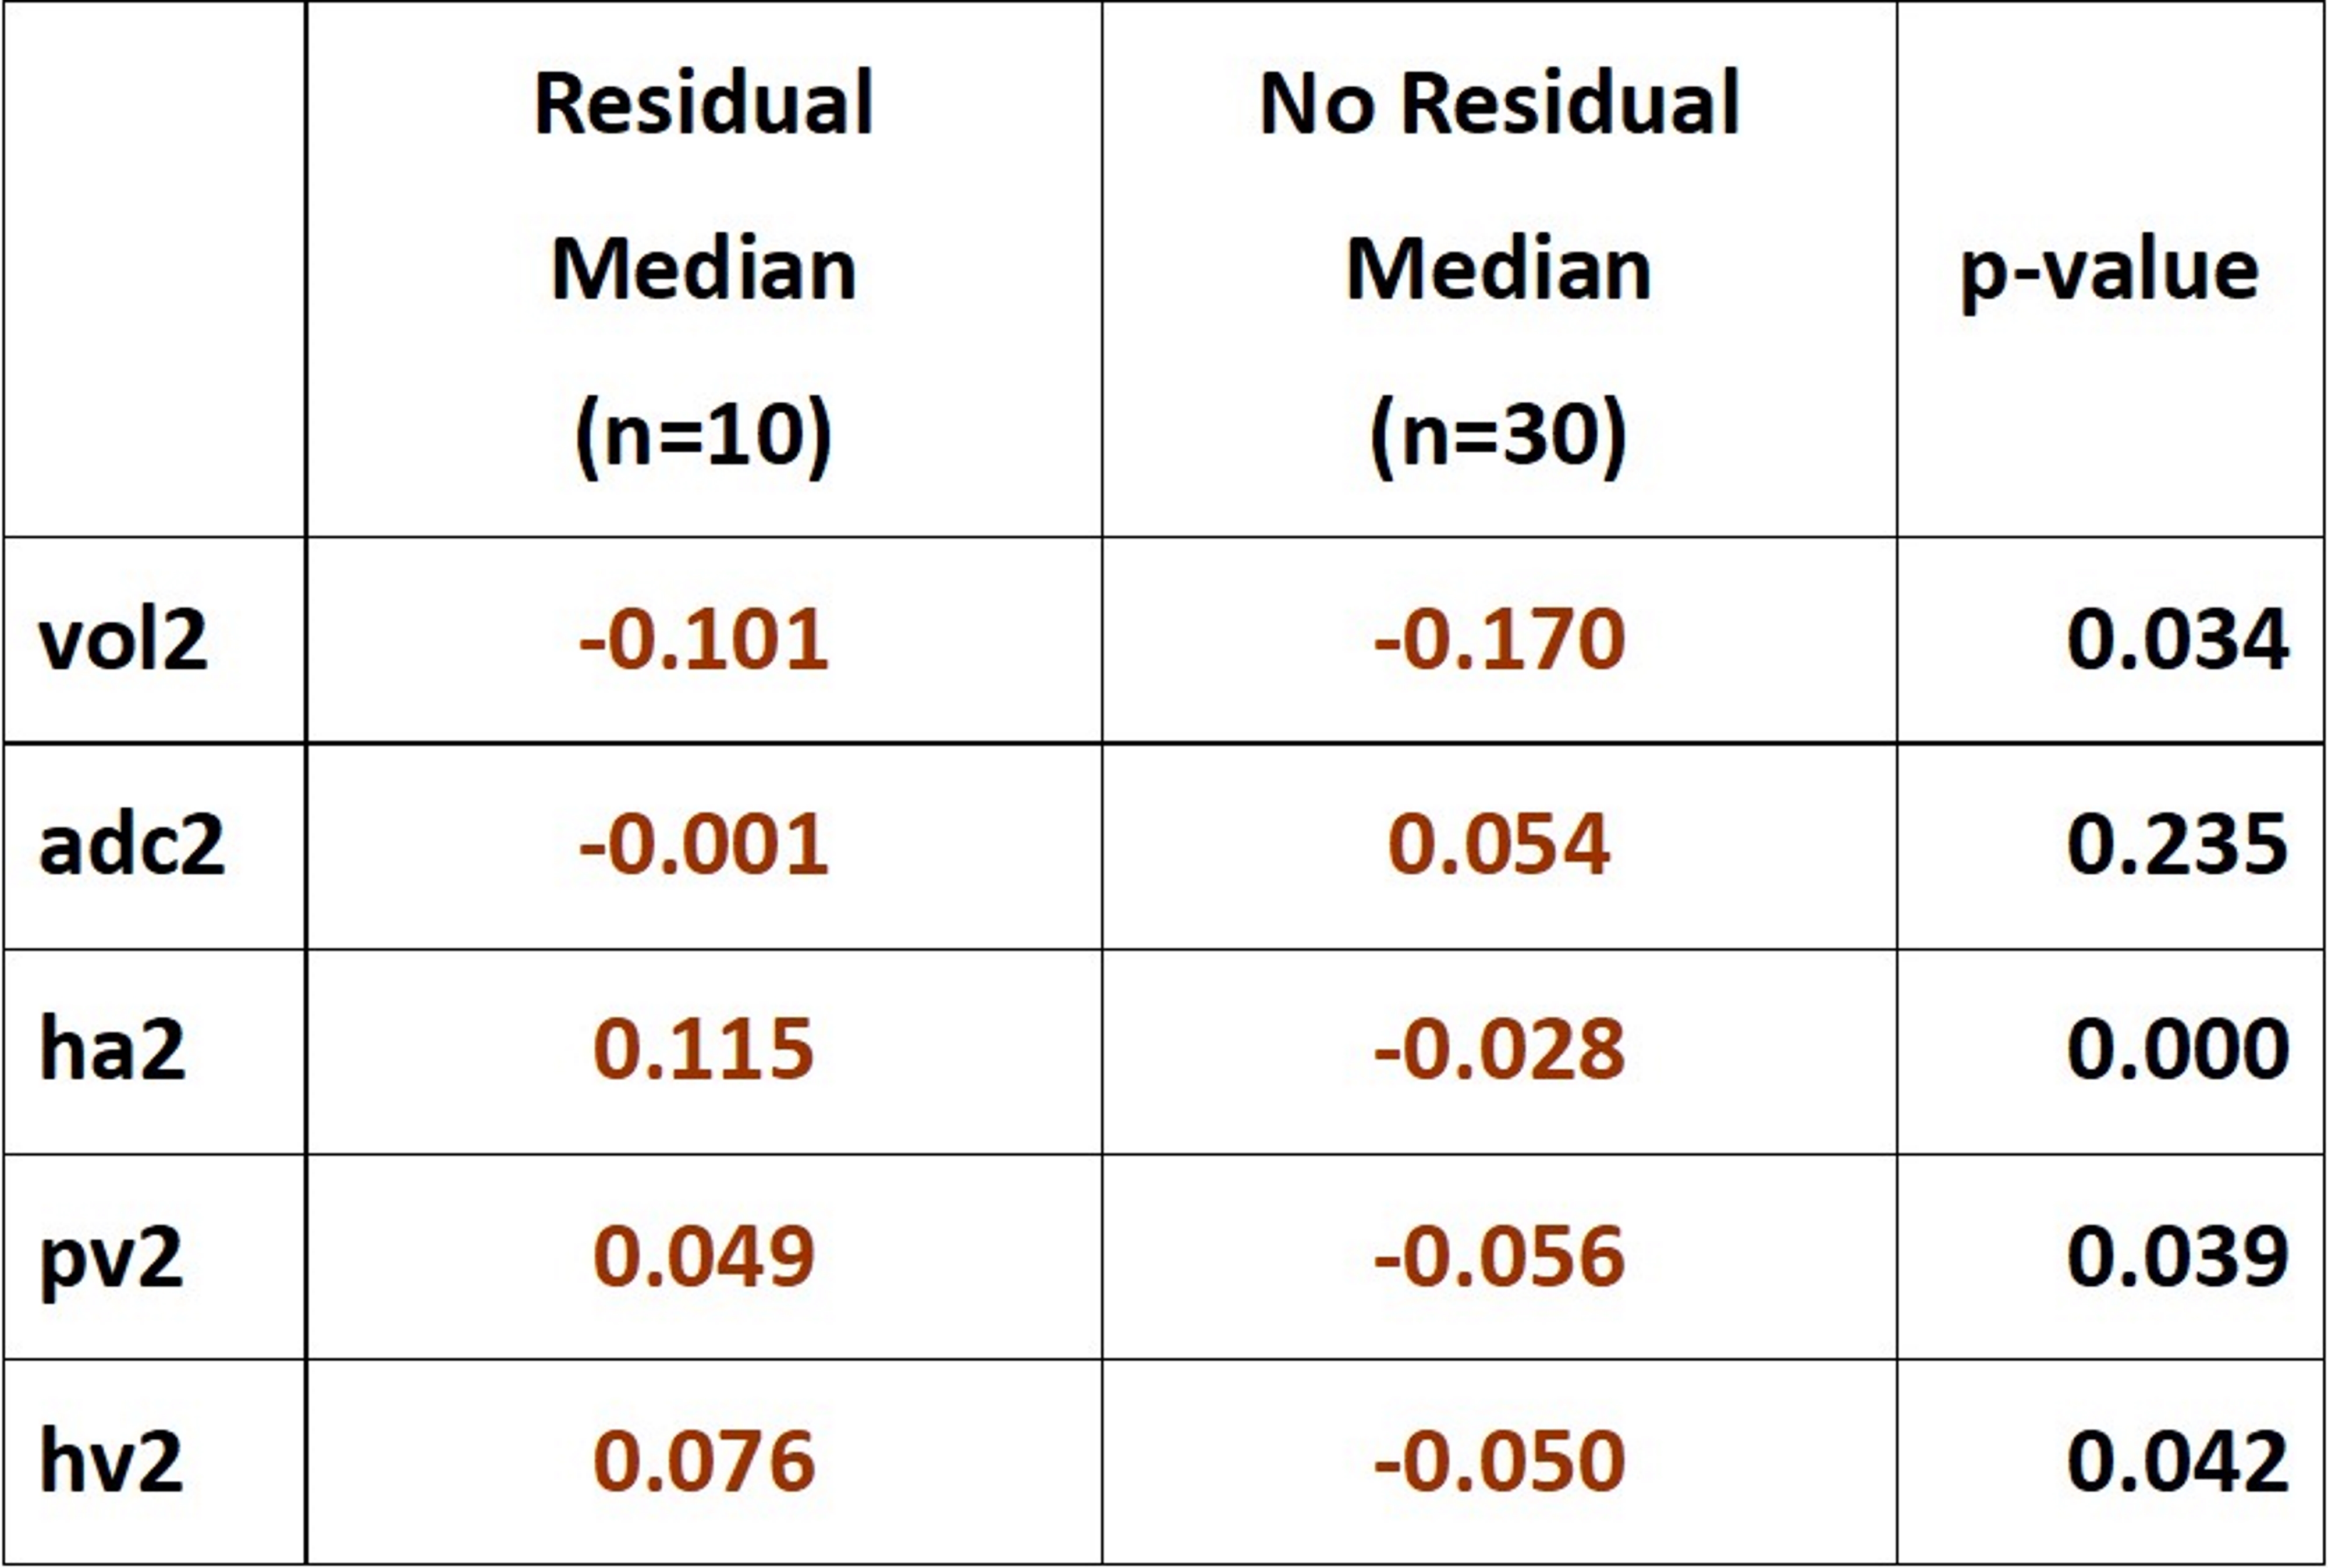
Table 1 and 2 respectively show the percentage change in differential enhancement, ADC and volume at time point 1 and 2 in the two groups.
There is a global reduction in the percentage of mean volume and differential enhancement seen in all phases in the group with no residual disease. Increase in ADC is also seen in this study group. In patients with residual tumor, there is paradoxical decrease in ADC and increase in hepatic venous enhancement at time point 1. At time point 2 patients with no residual tumor continue to show decrease in percentage enhancement in all the phases whereas there is a global increase in percentage enhancement in all the phases in patients with residual tumor.
Discussion
Our pilot study has shown that volumetric quantitative evaluation of differential enhancement of the treated lesion in various phases combined with ADC and change in tumor volume are feasible and quick to perform on a routine workstation. In our study mean percentage ADC paradoxically decreased in patients with residual disease while differential hepatic venous enhancement increased. Similar studies have shown that change in ADC and enhancement patterns can act as surrogate markers for evaluating response to treatment 3,4 Further prospective multicentre trials are warranted to identify absolute cut off.Conslusion
Quantitative imaging is a usefull adjunct to qualitative visual assessment in evaluating response to treatment Further studies are however needed to evaluate the current status of quantitative multiparametric imaging in evaluating response to treatment.Acknowledgements
No acknowledgement found.References
1. Vahid Yaghmai, Cecilia Besa. Edward Kim et al Imaging Assessment of Hepatocellular Carcinoma Response to Locoregional and Systemic Therapy. American Journal of Roentgenology. 2013;201: 80-96
2. ACR CT/MRI LI-RADS® v2017-core document.
3. Hazim I.Tantawy, Faten FawzyMohamed. Diagnostic value of apparent diffusion coefficient (ADC) in evaluating hepatocellular carcinomas post trans-catheter arterial chemoembolization and radiofrequency ablation. The Egyptian Journal of Radiology and Nuclear Medicine. 2016; 47(3) : 699-706
4. Susanne Bonekamp, Vivek Gowdra Halappa, Jean-François H. Geschwind et al. Unresectable Hepatocellular Carcinoma: MR Imaging after Intraarterial Therapy. Part II. Response Stratification Using Volumetric Functional Criteria after Intraarterial Therapy. Radiology 2013 ;268(2):431-9
Figures